Abstract
The purpose of this report is to provide a detailed description of a database management system that operates on an IBM PC, and was designed to help mod¬ elers choose appropriate smog chamber runs for mechanism testings. In addition, this report desctribes the outlines for a prospective expert system.
This report covers:
• a brief discussion of model developing and testing;
• recisons for choosing Turbo Prolog as the implementing language for the sys¬ tem;
• a detailed description of the database fields and underlying organizing princi¬
ples;
• an overview of the data set;
• a brief introduction to the structure of Turbo Prolog; • an overall structure of the database management system;
• an introduction to the hierarchical structure of predicates in the system; • detailed explanations of selected predicates defined in the source program. • a discussion of the long-term goal of this project involving the incorporation of
the database management system into an expert system capable of: a) choosing appropriate runs to test the mechanisms;
b) carrying out automatic model evaluations by making inferences from the
sets of testing results;c) explaining the rules it used in the process of model evaluations at different
levels of details;d) acquiring new knowledge from the domain expert through an intelligent
editor.
A user's guide to the database management system, a hierarchy of predicates defined in the system, the source codes, and a sample output will also be provided
Acknowledgements
I wish to acknowledge and thank my advisor, Dr. Harvey Jeffries, for his support and guidance throughout my studies at the UNC. Although the work described in this report is my own, the inspirations which started it all came from Dr. Jeffries.
I also wish to thank Dr. Miller and Dr. Flynn for their help reading the report
and their comments and criticisms.
Some of the tables and plots were provided by Dr. Kenneth Sexton. The origi¬ nal experimental conditions database were prepared by Dr. Sexton and Mr. Jeffry Arnold. Thanks to both of them. I would also like to thank Ms. Terry Kale for helps she offered to me.
Finally, a special thank should go to my wife, Lai-Choi, for her encouragement.
Contents
1 Introduction 1
Model Development and Testing... 1
Model Development... 1
Model Testing... 2
Explanations vs Predictions... 3
A Hierarchical Approach... 5
Need for Experimental Conditions Database... 5
Computer Language: Turbo Prolog... 5
Areas of Application... 9
Declarative vs Procedural... 9
Logical Database... 10
Knowledge Base and Expert System... 10
Why Turbo Prolog?... 11
Previous Work ... 12
Structure of This Report... 12
2 Database Records 18 Date of Run ... 18
Class of Run... 18
Dilution... 20
Injection... . 20
Hydrocarbon Type... 21
Processing Status... 21
Project... 24
Series... 24
Rank ... 26
Concentrations and HC Species/Mixture Identifications... 26
HC Instrument... 27
Quality of Run ... 27
Sunlight... 27
3 Overview of Data Set 28 Period Covered, Distribution ... 28
Compoiinds and Mixtures Used... 30
Experimental Series... 33
Quality, Rank, Processing Status, Sunlight... 34
4 Overview of OSCECIS 37 Sample Turbo Prolog Program... 37
Overall Organization of OSCECIS... 39
Tutorial... 40
Access to DOS Commands... 40
Editor... 40
Loading and Saving Database... 41
Viewing the Database Codes... 42
Diagnosing the Database ... 42
Miscellaneous... 43
Querying the Database... 44
Step 1: Query Posing... 44
Step 2: Templates Collecting and Records Searching ... 46
Step 3: Printing Results... 47
Overall Picture... 48
Updating the Database... 50
Display Record... 50
Delete Record... 50
Insert Record... 50
Modify Record... 53
Overall Picture... 54
5 Components of OSCECIS 57 More About Turbo Prolog... 57
Hierarchy of Predicates... 59
Description of Selected Predicates ... 60
Searching... 60
Printing Results... 65
6 Future Work 70 What Is Next? ... 70
Features of Expert Systems... 70
Basic Components of Expert Systems... 71
The Knowledge Base... 71
The Inference Engine... 73
Justification / Explanation... 73
Knowledge Acquisition... 73
Outline of Future Work... 74
Long-Term Goal ... 74
System Configuration... 74
Implementation of ASKME ... 77
Closing Remarks... 79
References 80 A User's Guide to OSCECIS 82 System Requirements... 82
Files Needed... 82
Getting Started... 83
Important Notes... 83
Querying the Database... 83
Selecting Output Devices and Forms... 84
Viewing the Database Codes... 84
Updating the Database... 84
Saving Database on File ... 85
Diagnosing the Database... 85
Miscellaneous... 85
Access to DOS Commands ... 86
Editor... 86
B Hierarchy of Predicates 88 C Program Listings 97 D Sample Outputs 133
Tables
1. Example Segmented Data File ... 13
1. cont. Example Segmented Data File... 14
1. cont. Example Segmented Data File... 15
2. Composition of HC Mixtures... 22
S. Composition of HC Mixtures... 23
4. Series Codes Used in the Experimental Conditions Database ... 25
5. General Run Rankings... 26
6. Distribution of Experiments by Year... 28
7. Distribution of Experiments by Month ... 29
8. Distribution of Ebcperiments by Project... 30
9. Distribution of Ebcperiments by Class... 30
10. Distribution of Experiments by Dilution and Injection Conditions... 30
11. Distribution of Ebcperiments by HC Type ... 31
12. Number of Chamber Sides Containing Species... 31
IS. Distribution of Experiments by Series... 33
14. Distribution of Experiments by Quality... 34
15. Distribution of Experiments by Rank... 35
16. Distribution of Ebcperiments by Processing Status ... 35
17. Distribution of Ebcperiments by Sunlight... 36
18. Examples of Matched Structures... 58
19. Examples of Unmatched Structures... 58
Figures
1. Schematic Diagram Illustrating the Process of Model Development and Test¬
ing... 4
2. Hierarchy of Species in Photochemical Mechanisms... 6
S. Hierjirchy of Experimental Conditions ... 7
4. Chamber Runs as Examples of Hierarchical Experimental Conditions... 8
5. An Example Plot... 16
6. Structure of a Datab<ise Record... 19
7. Main Menu of OSCECIS ... 41
8. Menu for Viewing the Database Codes ... 43
9. Menu for Four Query Types... 45
10. Menu for Eight Output Choices... 48
11. Grouping of Runs in solution Templates... 49
12. Flows of Four Query Types in OSCEIS... 51
12. Flows of Four Query Types in OSCEIS, cont... 52
18. Menu for Updating Database... 53
14. Flows of Four Updating Database Choices in OSCECIS... 55
14. Flows of Four Updating Database Choices in OSCECIS, cont... 56
16. Four Basic Components of a Typical Expert System... 72
16. Configuration of ASKME... 75
1
Introduction
This report provides a detailed description of a database management system called
OSCECIS (Outdoor Smog Chamber Experimental Conditions Information System).
The system was written in Turbo Prolog, a fifth generation computer language based
on a subset of predicate logic known as Horn clauses.^'^'* For the time being,
OSCEr-CIS stands alone as a helping tool whose main function is to provide easy access to the experimental conditions database for the smog chamber experiments conducted in the Outdoor Smog Chamber of the University of North Carolina at Chapel Hill over the past ten years. In the long run, OSCECIS will be incorporated into an expert system capable of assisting the photochemical kinetics model developers in testing their models, as well as carrying out automatic model evaluations.
Model Development and Testing
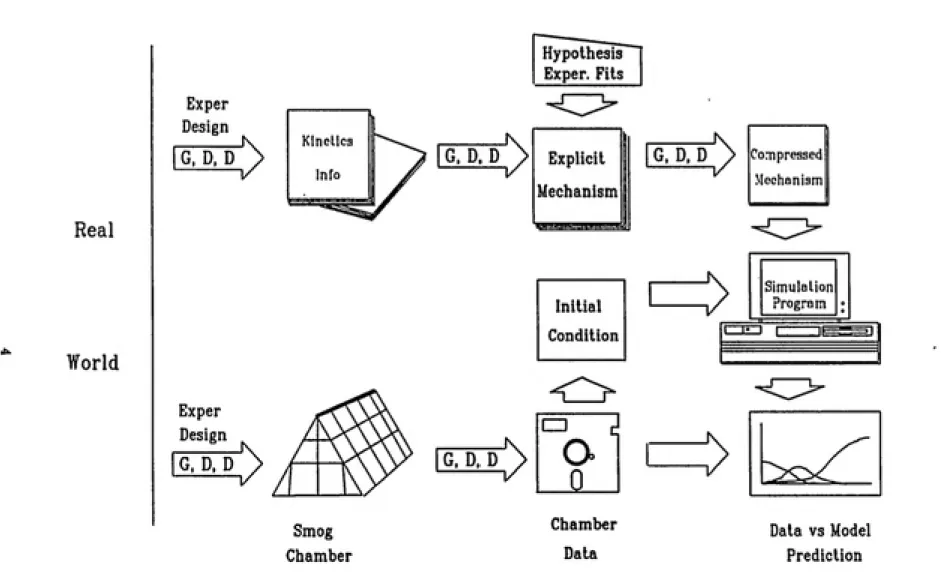
One of the objectives of conducting smog chamber experiments is to collect reliable data to test photochemical kinetics models which simulate the photochemical re¬ actions taking place in the lower atmosphere. Photochemical kinetics models are the major component in methods for computing control requirements for organic emissions needed to meet Federal Air Quality Standard for ozone.''
Model Development
Although the past fifteen years of model development saw many breakthroughs in photochemistry, the photochemical processes of the lower atmosphere are still not
completely known. Today, photochemical reactions taking place in the troposphere
fall into three categories according to the degree to which they are understood: 1) well-known accepted reactions;
Introduction___________________________________________________________________________________Model Tegting 3) partially understood reactions.
The incomplete knowledge of photochemical reactions makes it necessary for mod¬ elers to speculate about choices in a range of uncertainty.
What complicates the model development even more is that photochemistry is not the only factor affecting the smog formation. Meteorological conditions also play
a crucial role in the process. Because multi-cell simulations of smog formation with
reasonable meteorological information still demand too much computer memory and time, most models today are restricted to single-cell simulations with minimum
meteorological input.
The complexity of photochemistry and meteorology of the lower atmosphere
requires that mathematical models be simpler than the actual atmospheric chem¬ istry. This simplification is achieved by three processes: generalization, deletion, and distortion.
The generalization process involves using a single representation (called "lump¬
ing" ) for similar aspects of the process being modeled to reduce the number of items
that must be included in the model. The deletion process involves omission of some aspects of the process judged to be unimportant. The distortion process involves changing from exact model representation in some way to an inexact or incorrect representation, for example, treating two consecutive processes as a single step. Each of these simplification processes may be used intentionally or unintentionally
by the modelers.*
The three simplification processes involve subjective judgements of individual model development groups as to what reaction is more important than the other, what species need to be combined or deleted, what reaction rates are to be used etc. As such, different modelers may produce different descriptions even though the real world situation they are describing is identical and they are using the same kinetics
database.
Model Testing
To test the "appropriateness"of the descriptions, smog chamber experiments which
vary in concentrations of nitrogen oxides (NOx) and hydrocarbons (HCs) as well
as other initial conditions were conducted and data were collected. These dataExplanations vs Predictions______________________________________________________________________Introduction
Because the condition of a given chamber experiment represents only a tiny fraction of the countless combinations of conditions in the real world, a good fit between even a large set of experimental data and model predictions does not guar¬ antee a good fit between model predictions and data collected from the real world. On the other hand, it is quite safe to say that a model showing poor fit to chamber data is not likely to be an accurate representation of the real world.
But why don't we use the data collected from the real world to test the model instead? Jeffries* argued against this approach by considering five factors:
• The meteorological factors are so influential in atmospheric concentration
that it is hard to isolate the chemical factors.
• The atmospheric hydrocarbon mixture is too complex and various compo¬ nents of the chemical mechanism can only be tested in isolation.
• The large number of possible combinations of conditions in the urban-like simulations suggests that extremes in conditions may be the most feasible method of covering the range of conditions needed.
• When mechanisms fail in the comparison, "debugging"experiments are needed to assist in understanding why they failed; these types of experiments remove some of the complexity of the urban-like simulation to make the cause and
effect relation clearer.
• Whitten's strategy of "bottom-up" construction (to be discussed very soon) and testing of complex mechanisms requires a series of conditions to avoid the ambiguity of oifsetting errors and to increase the degree of understanding of the workings of the complex description being constructed.
Figure 1 shows a schematic diagram illustrating the processes of model develop¬ ment and model testing. The arrows marked by "G,D,D"represent steps in which generalization, deletion, and distortion are likely to take place.
Explanations vs Predictions
Besides giving an explanation of the process of smog formation, a good model should also be able to provide predictions. While a great amount of knowledge h«LS accumulated during the past fifteen years of model development, the knowledge of photochemical reactions in troposphere is still far from complete. Every now
and then a new reaction rate would be determined or a new species found to have
played a role in a previously obscure reaction. The business of model development
Real
World
Exper Design
G. D. D
Exper Design
Smog
Chamber
Hypothesis Exper. Fits
Kinelicg
G, D. D Explicit G, D, D
Mechanism
G, D, D G, D, D
Initial Condition
s—i
a
0Chamber Data
Compressed
Mechanism
Simu alion Program
Data vs Model Prediction
Need for Experimental Conditions Database_______________________________________________________Introduction
discovered facts v*rhich may readily tilt the balance painstakingly maintained in an earlier time. This is one reason why despite fifteen years of continuous efforts, no
model developed so far has been found to be totally satisfactory.
A Hierarchical Approach
The formidable task of model development can be made easier if the modelers follow a concept of hierarchy of chemical species to test their models. The concept of hierarchy of chemical species was first described by Whitten.^ It is based on the number of HC/NOx system in which the species occur, with the most ubiquitous species occupying the lowest levels. Figure 2 is a modified version of Whitten's schematic diagram by Jeffries.* According to this concept, the models should be tested in a "bottom-up" fashion beginning from the bottom box in the diagram.
The hierarchical approach is very important in the sense that it not only helps establish the cause-and-effect in the mechanisms of a model but also suggests that a complex mechanism should not be constructed in one operation but in a stepwise fashion. ^
The "bottom-up" approach is also applicable to the design of chamber experi¬
ments. That is, the experimenter begins with the simplest set of conditions that the mechanism is designed to simulate and increase the complexity of the experimental system one factor at a time. To produce data which simulate the urban environment more closely, Jeffries et al. further extend the concept of hierarchy to experimen¬ tal conditions with different combinations of dilution and injection processes. The
hierarchy begins with No Dilution / Initial Injection as the simplest condition and ends in Large Dilution / Continuous Injection as the most complicated condition. Figure 3 is a detailed diagram of this hierarchy produced by Jeffries tt al. Figure 4
is an illustration of the concept using three chamber experiments.
Need for Experimental Conditions Database
As the knowledge of photochemistry grows, so do the models and the database for testing the models. A direct result of the growth of database is the increase in its physical size and complexity of experimental conditions. The database of the
UNC smog chamber experiments hats grown to such a point that a separate data¬
base containing merely experimental conditions need to be created for easy access to individual experiment or groups of experiment sharing certain combination of experimental conditions. This report deals primarily with this experimental con¬
ditions database, so called to separate it from the "main" database containing the
PARAFFINS r Ethylene
ͣ
Methane
OLEFINS
Ketones
AROMATICS
ROHO (Rt^H) - Dicarbonyls
RC(0)00N02
HCHO HCO
CO
NO NO2 NOi N2O5
HONO HNOj HO- HOj H2O2
Hydrocarboxui
(figher Garbonylfl
PAN Compounds
Formaldehyde
Inorganics
Lowest LevelOperating Conditions Injection Beginning — Experiment No Dilution Single
J HC
LHC
Mixture
-c
Simple Complex
Large .
Dilution No Enirainment
-[.
Single HC HC Mixture<
Simple ComplexpSingle
— Entrainment — ^^
[_HC
Mixture
-c
Simple Complex
Injection During ----Experiment
No _
Dilution Only HC Dynamic HC&NOx Dynamic Single
_J HC
Mixture
e-C
_. , r Constant
Simple—L Varying
ConstantComplex-L Varying
^,
Single HC HCMixture
ͣ
tC
Constant
Simple—L Varying
Constant
^ , rV'Onsiani
Complex-L Varying
Large 'Dilution
No
Entrainment I up ^Single
HC
Constant
Varyi
MixturTL Complex-C^°"/y^„g
ireL„. . r Constant
Simple—L Varying
Constant — Entrainment Single__Thc
"Li
HC MixturereL ConstantComplex-L Varying
„. , rConstan'Simple—L Varying
Constant
Figure 3. Hierarchy of Experimental Conditions to Simulate the
NO DILUTION LARGE DILUTION '•'cr-1 ' 1 ' i 1 ' i • 1 1 ' 1 ' ͣ ' 1 ' 1 ' ! ' 1
).3 —
June 27, 1963 -j g:».8
-ͣ
j
t^*.?L J
O - 4
i.i r •A
S».!L 0i .-•••"•-•ͣ'... -!
Z • -i
t.4 —
,' H
o..a
-NO NO, /ͣ' -^
t.2 —— ---,,---''•^... —J *.l ,_ •...••'ͣ'' ͣ ""----.-...PAN _]
ft A > ͣ 1 ---l , 1 , ! ,>-u\ .1,1.1.1,1,1 1 1
S « 7 a i U It 12 13 U tS l( 17 18 1«
HO UA 3 e 9 T
l.O £ .£ ft O O K 0.J o o z C«.3 Z
'ͣ| ' I ' I ' I ' I ' . ' I ' I ' I—m n
July 29, 1935
HOURS E ) T
O H
.£
«
-p' 1
June 14, 1983
T g:..a -fll.7 o -0, ,-•-• -2S r ͣ it .— V
NO, /ͣͣ'
_...- -n."-...--- PAN 1 v::i;,.,ci:'.../ ,1,1. 7T"i~" i 1 , 1
-s < 7 i > 1« U 12 13 14 19 U
NOU R 2 C D T
17 l« 1» ͣ
1.0 *.) £ .£ Q. C ).i O. a.
M roi.7
O o 4.< ^ •t OJ CM O9.1 *- ^L. .4 ^ •k
O Ot I
z z
«.2
t.l
«.«
I I I 1 ' i I I I 1 '
1 ' I ' I ' I II 11
June 27, 1983
H 0 U it S ED
Figure 4. Outdoor smog chamber runs as examples of hierarchial experimen¬
tal Conditions. NO, concentration approximately 0.25 ppm, HC concentration ap¬
proximately 2.6 ppmC of propylene/n-butane/toluene mixture. Large dilution means
that 20% of initial mass is left after 10 hours of dilution (equilivalent to mix¬
ing height rise from 250-m to 1250-m).
£ O (VI O O O H
O O
Declarative vs Procedural_________________________________________________________________________Introduction
Computer Language: Turbo Prolog
Turbo Prolog, a new version of Prolog programming language, was chosen as the
implementing language for OSCECIS after careful considerations of its several dis¬
tinctive features. The following sections will cover some features of Prolog language
in general, followed by specific features of Turbo Prolog.
Areas of Application
Prolog is a relatively new programming language, which has gained worldwide pop¬
ularity since its first release in 1972 by Alain Colmerauer at the University of Mar¬
seilles, France. In 1983, Prolog was chosen as the fundamental system language for
the ambitious Japanese national project involving the design and production of fifth
generation computers. Today, Prolog is a major contender to the older language
Lisp for applications of symbolic computation ranging from relational database,
mathematical logic and abstract problem solving to many areas of artificial intelli¬
gence such as natural language processing, robotics and expert systems. Although
both Lisp and Prolog have efficient way of handling recursive structures, the power¬
ful pattern-recognition facility of Prolog dwarfs the relatively primitive and limited
pattern-matching capability of Lisp, not to mention the much cleaner syntax of
Prolog. On the other hand, early versions of Prolog tended to make much severe
demands on the computer memory than Lisp did, though we will see how Turbo
Prolog solves this problem to a great extent in a latter section.
Declarative vs Procedural
One major difference between Prolog and conventional high level languages such
as Pascal and PL/l is that the former allows declarative descriptions of problems
whereas the latter are strictly procedural. In a declarative language, the program¬
mer supplies to the computer a set of assertions about entities and their relations
without giving execution details. The Prolog system derives procedural meaning
automatically from the syntax of the declarative language and carries out required
executions. In a procedural language, the programmer supplies stepwise execution
details to the computer which, in turn, follows the pre-programmed steps closely
to obtain desired answers. In brief, a declarative language tells what, whereas a
procedural language tells how.By virtue of the declarative nature of the Prolog language, a program for a given application typically requires ten times fewer program lines with Prolog than
with Pascal or PL/1. This helps decrease the time and cost of software development
Introduction________________________________________________________________________________Logical Databage
Another advantage associated with the declarative nature of Prolog is that it can solve that class of problems having an undeterministic nature; that is, the class of problems which can not be pre-programmed stepwise because the problem space is too large to be handled by a computer or involves combinatorial explosion.
Logical Database
As mentioned at the beginning of this report, Prolog is founded on a subset of predicate logic called Horn clauses. Predicate logic is a formalism that is a natural and powerful representation language marred only by its perceived computational ineflBciency.* By restricting its foundations to Horn clauses, Prolog loses some degree of expressiveness, but gains a great deal in computational efficiency.®-^" More details
about Horn clauses will be given in Chapter 4.
The structure of Prolog and its strong pattern-recognition facility make it espe¬ cially suitable for implementing database systems. Database systems implemented in other languages usually require different representations for the database, the query language and the host unit where searching and other data manipulation mechanisms reside. For example, a typical database management system may have the following characteristics: its database may be in the form of a text file, its host unit may be written in a high level language such as Pascal, and its query language may take the form of certain linguistic structures limited only by the imagination of the designer. In Prolog, however, the database, the query language and the host unit all share the same structure. Moreover, the expressiveness inherited from the predicate logic by Prolog provides for free a query language which is natural and very close to human language.
Knowledge Base and Expert System
One of the goals of building a database is to collect facts against which hypotheses, theories or models can be matched. The process of these testing activities involves complex mental exercises which call upon great perseverances and ingenuities on the paxt of the researchers. While the human intelligence is indispensable in this process, artificial intelligence represented in the computer may be a highly desirable helping tool which can take over some of the chores of reasoning details and leave the more subtle aspects of the problems to the researchers.
Why Turbo Prolog?______________________________________________________________________________Introduction
inference mechanism, and an explanatory interfax:e, constitutes an expert system which, if successfully implemented, can perform the tasks of a given domain at an
expert's level.
The Prolog language provides a bridge between a database and a knowledge base by virtue of its unique language structure. The knowledge base can be built in an incremental fashion without changing the structure of the original database
system (there is only one language structure anyway). This will result in a great
saving of efforts and time. Unless the database designer is very sure that his or her database is not going to involve in any form of complex reasoning or that there is never a need to develop the database into a knowledge base, Prolog should be seriously considered as a candidate for the implementing language.
Why Turbo Prolog?
As a latest implementation of Prolog language, Turbo Prolog retains all the major advantages of Prolog language discussed in previous sections while at the same time adding to it many desirable new features. Some of them are summarized below.
1. Turbo Prolog is a full-fledged compiler which can produce stajid-alone pro¬ grams for the IBM PC and compatibles. Older versions of Prolog are mostly interpreters. The differences between an interpreter and a compiler are: In¬ terpreter accepts a source program, translates it into some intermediate data structure, and then executes the algorithm by carrying out each operation given in the intermediate structure. An interpreter is considerably less effi¬ cient than a compiler because it has to carry out the translation "ritual" every time it executes the program. A compiler performs translation step once and
the output (an execution file) can be executed many times without overhead.
It demands fairly heavy computer resources while compiling, but when exe¬ cuting, only those resources needed by the executing program are required.^^ A compiled Turbo Prolog program is more conservative in its memory re¬ quirements than an equivalent interpreted program of any earlier version of Prolog while, at the same time, it executes at a much faster speed.
2. Turbo Prolog has a typed structure in much the same way that Pascal does. The typed structure not only makes debugging a much easier job but also reduces the space requirements of the Prolog language.
Introduction___________________________________________________________________________________Previoug Work
which are linked together in a later stage. This feature is highly desirable for developing huge programs. Moreover, the Turbo Prolog development group is currently putting their efforts in developing an interface between Turbo
Prolog and Turbo Pascal, an exciting feature which will enhance the powers of the two already powerful languages even more.
5. Turbo Prolog allows a full control of window facility which contain mixed
text and graphics. It also allows an easy access to the memory and I/O ports. These tools will be especially useful for creating user-friendly programs. The features discussed in this and earlier sections suit our purposes of develop¬ ing the OSCECIS well. As mentioned earlier, OSCECIS is a first step towards an ultimate goal of developing an expert system capable of assisting the modelers in testing their models as well as carrying out automatic model evaluations based on the given sets of testing results. The suitability of Prolog as an expert system devel¬ oping language has been proven by many successful applications.^^ The additional features of Turbo Prolog can only enhance this suitability.
Previous Work
The experimental conditions database is extracted from the main database con¬
taining the experimental outcomes and complete documentation of the UNC smog
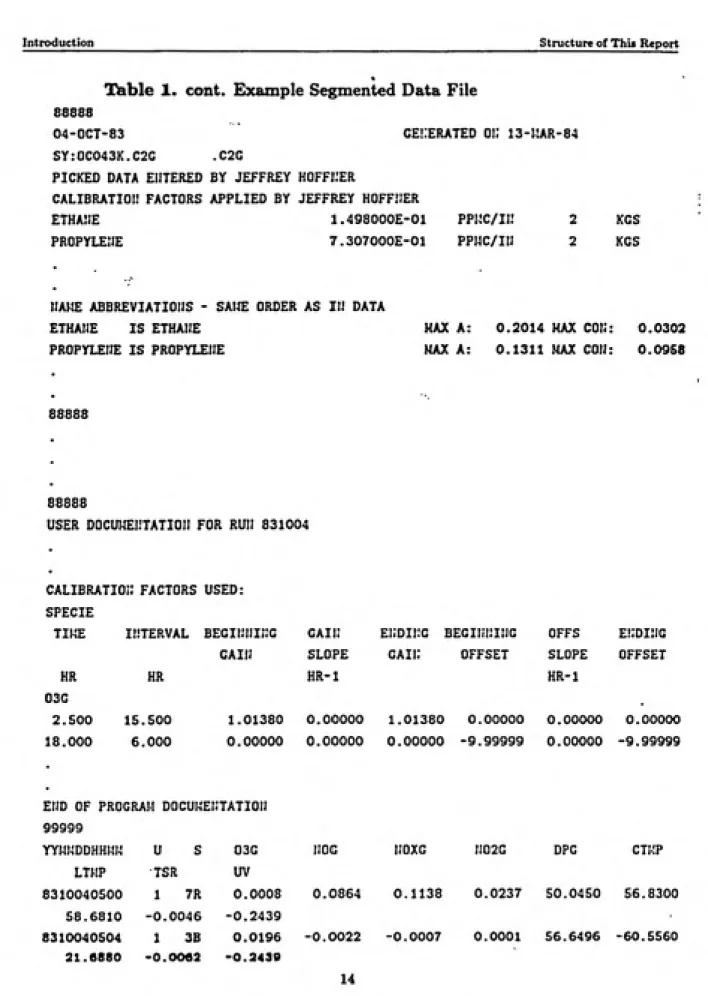
chamber experiments. Table 1 shows an example Segmented Data File (SegFile) for the run conducted in October 4, 1983. A SegFile contains complete information of a fully processed run in the main database. The data in a given SegFile can be
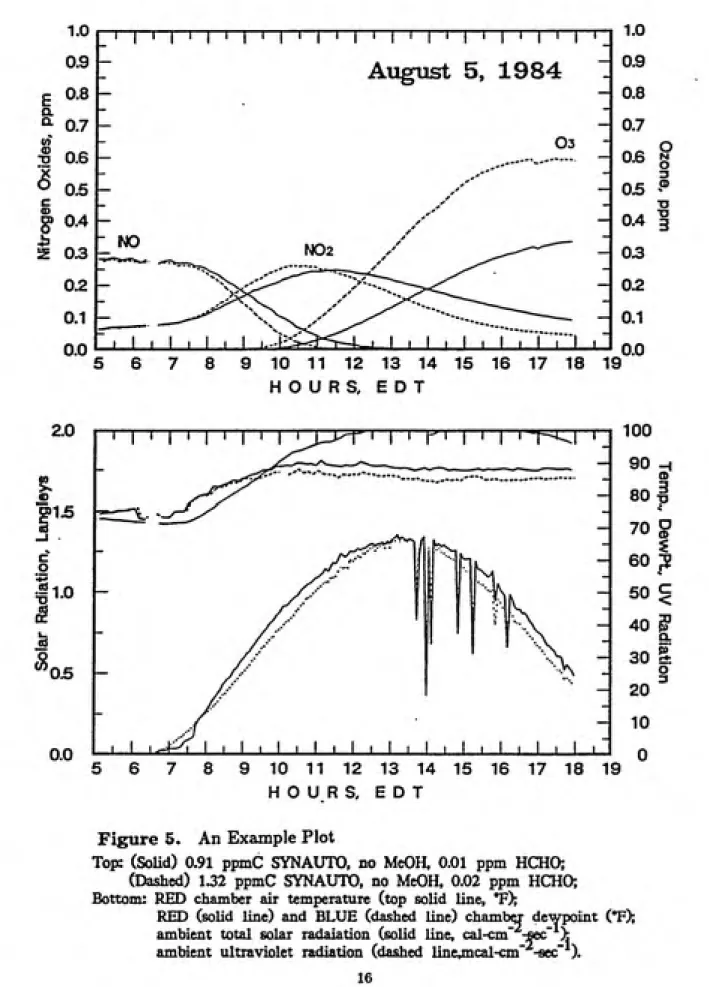
used to generate plots such as those shown in Figure 5.
The organizing principles of the experimental conditions database has been discussed in the 1985 UNC report entitled "Outdoor Smog Chamber Experiments to Test Photochemical Models: Pheuse IV ' which also contains a complete index to all pre-1984 chamber experiments and suggestions on run selection for model testing. The OSCECIS follows these organizing principles closely with only a slight change in run series and rankings and an addition of a new field containing information of
percentage of sun light.
Structure of This Report
Structure of This Report_____________________________________________ Introduction Table 1. Example Segmented Data File
GENERAL DOCUHENTATIOI!
RUNDATE: OCTOBER 04, 1983
RUNTYPE: AUTO
RUN DESCRIPTION: COMPARISON OF REACTIVITY OF EXHAUST
FROM DIRECT INJECTION FROM DODGE CHARGER IN HIGH IDLE
*ITH SYNTHETIC AUTOEXHAUST.
RESULTS: TWO SYSTEMS RESULTED IN SIMILAR REACTIVITY
INITIAL CONDITIONS: BLUE RED
DODGE CHARGER 0.0 2.587
SYNTHETIC EXHAUST NMHC 2.190 0.0
HO 0.214 0.21S
H02 0.037 0.039
88888
O4-0CT-83 GENERATED Oil 19-MAR-84 SY:OC043K.C1G .CIG
PICKED DATA ENTERED BY JEFFREY HOFFIIER CALIBRATION FACTORS APPLIED BY CHARLES
TOLUENE 2.912000E-01 PPHC/IN 2 KGS
ETHYLENE 9.020000E-02 PPMC.IN 2 KGS
NAME ABBREVIATIONS - SAME ORDER AS Ii: DATA
Introduction Structure of This Report
GE!:ERATED OI: 13-MAR-84
Table 1. cont. Example Segmented Data File
88888 04-0CT-83
SY:0C043K.C2G .C2G
PICKED DATA EIJTERED BY JEFFREY HOFFI.'ER
CALIBRATIOI! FACTORS APPLIED BY JEFFREY HOFFIIER
ETHAIJE 1.498000E-01 PPMC/Ii: PROPYLEIIE 7.307000E-01 PPHC/III
KGS KGS
IJAME ABBREVIATIOIIS - SAME ORDER AS II! DATA
ETHANE IS ETHAWE MAX A:
PROPYLEIIE IS PROPYLEIIE MAX A:
0.2014 MAX CON: 0.0302 0.1311 MAX COIJ: 0.09&8
88888
88888
USER D0CUI.!E1.'TATI0II FOR RUN 831004
EI;DI1.'G BEGIIinillG OFFS
GAii; OFFSET
E!;di:!g
CALIBRATIOi: FACTORS USED:
SPECIE
TIME INTERVAL BEGINNING GAIi;
GAIN SLOPE
HR HR HR-1
03G
2.500 15.500 1.01380 0.00000 1.01380 0.00000 0.00000 0.00000
18.000 6.000 0.00000 0.00000 0.00000 -9.99999 0.00000 -9.99999
SLOPE OFFSET HR-1
END OF PROGRAM DOCUMENTATION
99999
YYHMDDHHHI.! U S 03G NOG
LTMP TSR UV
8310040500 1 7R 0.0008 0.0864 58.6810 -0.0046 -0.2439
8310040504 1 3B 0.0196 -0.0022 21.6880 •o.ooea -0.2439
NOXG N02G DPG CTHP
0.1138 0.0237 50.0450 56.8300
Structure of This Report Introduction
Table 1. cont. Example Segmented Data File
8310041704 1 3B 0.5787 -0.0012 0.0513 0.0507 72.7266 -60.5120
20.5120 0.1592 11.7073
8310041708 1 7R 0.5508 -0.0013 0.0578 0.0573 64.7658 83.3620 81.3040 0.1376 10.2439
99999
YYMMDDHHMH USER SIDE GEIIERATED 01.' 19-MAR-84
2.4.4 TRI TOLUEIIE ETHYLEtlE II-BUTA!IE TRAI.'S-2-B ISOPEIITAIJ tl-PEIITAI.'E ACETYLEtlE 8310040625 IB.
0.2266 0.4546 0.4435 0.0877 0.0366 0.1339 0.0000 0.0905 8310040655 1 R
0.1868 0.2580 0.2248 -999.0000 0.0459 0.1195 0.0634 0.2332
8310041455 1 R
0.1439 0.1573 0.0890 -999.0000 0.0000 0.0828
8310041525 1 B
0.1821 0.2514 0.1300 0.0688 0.0000 0.0921 99999
YYMWDDHHMH USER SIDE GEIIERATED Oi: 13-MAR-84
ETHYLEIIE ETHAIIE PROPYLENE
8310040625 1 B
0.4522 0.0093 0.0952
8310040655 1 R
0.4097 0.0238 0.09S8
0.0340 0.167:
0.0000 O.OOOi
8310041525 1 B
0.1603 0.0086 0.0000
8310041555 1 R
0.2675 0.0260 0.0000
1.0
0.9
£ 0.8
a
^ 0.7
m
-S 0.6
° 0.6
c v>
g> 0.4
2 0.3
0.2
0.1
-0.0
I ' I ' I M ' I I I ' I I I M M I T
NO
August 5, 1984
i_I_L
1.0
- 0.9 - 0.8
- 0.7 03
-0.6 I
-H 0.5 «®
0.4 I
0.3
0.2
0.1
10 11 12 13 14 16 16 17 18 19
HOURS, EOT
0.0
2.0
I
15
c
o 'Jp
-10
05
-0.0
^
W
7 8 9 10 11 12 13 14 15 16 17 18
H O U R S, E D T
Figure 5. An Example Plot
Top: (SoUd) 0.91 pjanC SYNAUTO, no MeOH, 0.01 ppm HCHO; (Dashed) 1.32 ppmC SYNAUTO, no MeOH, 0.02 ppm HCHC^ Bottom: RED chamber air temperature (top solid line, T);
RED (solid line) and BLUE (dashed line) chambq- dewpoint (°F);
structure of This Report ________ ____________________________________________________Introduction
gives detailed explanations of selected predicates defined in OSCECIS. Chapter 6 discusses the long-term goal of this project: the development of an expert system into which the OSCECIS will ultimately be incorporated. Appendix A contains the user's guide to the system. Appendix B contains the hierarchical structure of predicates defined in the system. Appendix C lists the source program. Appendix
2
Database Records
This chapter covers a detailed description of the fields of the database records. The organizing principles of the database have been described in the 1985 UNC report "Outdoor Smog Experiments to Test Photochemical Models: Phase IF .^ In the process of explaining the organizations of the database fields, some organizing
principles will be reiterated but not covered in full details.
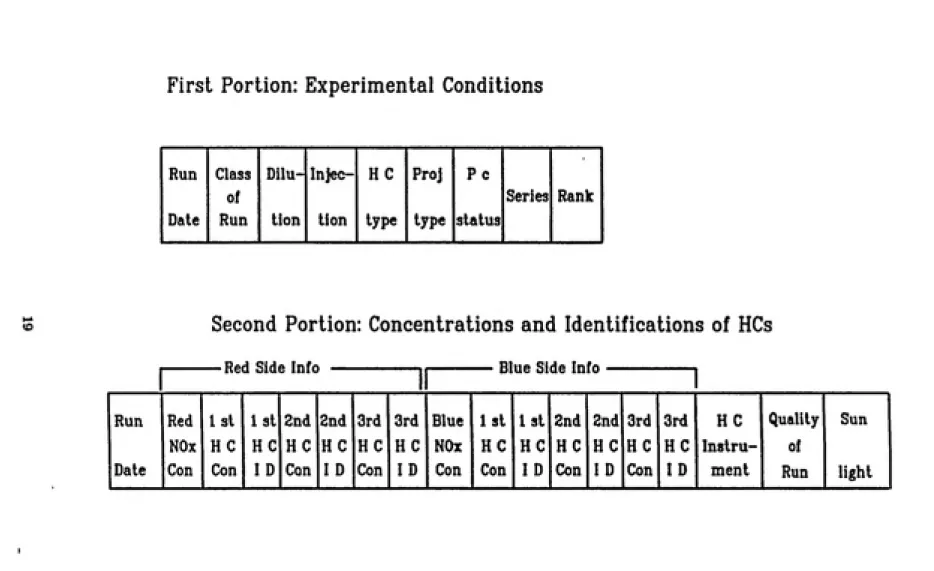
Each record in the database is comiposed of 27 fields. For reasons which will be made clear in chapter 4, each record is physically broken up into two portions. The first portion contains mainly codes of experimental conditions, whereas the second
portion contains mainly concentrations and identifications of nitrogen oxides (NOx) and hydrocarbons (HCs) for a given experiment in the two sides of the smog chamber. Figure 6 is a schematic diagram of the structure of a single record in the database.
Each box in the record encloses the name of the corresponding field. Detailed
description of each field follows.
Date of Run
This is the principal key for each record. It consists of a character string of length
six in the form "yymmdd", where y's are the last two digits of the year in which
the run was conducted, mm is the month and dd is the day. For example, the run
date "770518" uniquely identifies the run conducted in May 18, 1977.
Class of Run
First Portion: Experimental Conditions
Run Class of
Dilu¬Injec¬ HC Proj Pc
Series Rank Date Run tion tion type type status
Second Portion: Concentrations and Identifications of HCs
———Red Side Info i ' Blue Side
Info---Run Red Isl 1st 2nd 2nd 3rd 3rd Blue 1st 1st 2nd 2nd 3rd 3rd HC Quality Sun NOx HC HC HC HC HC HC NOx HC HC HC HC HC HC Instru¬ of
Date Con Con ID Con ID Con ID Con Con ID Con ID Con ID ment Run light
Database Records__________________________________________________________________________________ Dilution
Characterization runs address unique aspects of the UNC chamber performance. They are designed to provide chamber-specific data such ais the magnitude of 03
produced by rural background air, magnitude of NOx emissions from the chamber
walls, photolysis rate of aldehydes etc. The following codes designate the Charac¬
terization runs:
• C - Characterization experiment.
• D - Characterization experiment, second day.
Organic / NOx runs are designed to test the chemical aspect of a mechanism. For instance, a run of this type may contain propylene in one side of the chamber and ethylene / acetaldehyde in the other side of the chamber in order to test whether a mechanism can adequately describe the chemical transformations of both sides. The Organic / NOx runs and their corresponding codes are shown below:
• O - One day organic NOx experiment.
• T - Two day organic NOx experiment, first day.
• S - Two day organic NOx experiment, second day. Dilution
This field identifies two types of chamber experiments: runs with dilution rates controlled at about 1 dilution rates which are used to approximate various patterns of mixing height rises. The following codes designate the two types of dilution:
• N - Normal dilution (about 1 % / hour).
• L - Large dilution (about 5-fold dilution in 10 hours). Injection
This field is similar to the previous field. It classifies runs into various injection
levels of reactants. The following codes designate the five injection levels:
• I - All reactants injected before sunrise.
• H - HC injected during experiment, NOx injected before sunrise. • N - NOx injected during experiment, HC injected before sunrise. • B - Both HC and NOx injected during experiment.
Hydrocarbon Type__________________________________________________________________________Database Records
By varying the two attributes of Dilution and Injection, a hierarchy of experi¬ mental conditions can be developed to simulate the urban environment in a progres¬
sive manner. The hierarchy begins with No Dilution / Initial Injection combination at the lowest level and ends with Large Dilution / Continuous Injection combina¬
tion at the highest level. Table 2 shows the four basic combinations of Dilution and
Injection.
Hydrocarbon Type
The field is designed to give a summary of the relationship of the hydrocarbon species or mixtures in both sides of a given side-by-side chamber experiment. It consists of a character string of length two. There are two basic types associated with this attribute of the database. The first type consists of runs with a single species on each side of the chamber. The following codes designate HC class of
species of this type:
• lA - aldehyde on each side;
• lO - olefin on each side; • IP - parafiin on ejich side; • IR - aromatic on each side;
• lU - olefin one side, aldehyde other side;
• IV - olefin one side, parafiin other side;
• IW - olefin one side, aromatic other side;
• IX - some other combination.
The second type consists of runs with mixture on at least one side of the cham¬ ber. The following codes designate HC class of species of this type:
• MB - simple mixture of two or three species;
• MC - named mixture or mixture of named mixtures;
• MV - mixture with time varying composition.
A simple mixture has two or three species. A named mixture or mixture of
named mixtures has at least four species and can have several hundred {e.g. auto exhaust). Table 2 and Table 3 give the named mixtures used in the UNC experi¬
Table 2 • Compoaition of Hydrocarbon MixtnrM ntcd la UNC Smog Chamber Ibeparlmemto.
oCompound SDv4MtXl SIKOvflXI UNCMIX StMARO COMARO AUTO-O ATTTO-IA AUTO-lB P/B P/B/T BASMIX
kutant 0.1003 0.4t3« Oi)3«l 0.0301 0.7tU 0JISS3 0.3140
ptntutt 0.3IU 0.3ttO 0.3S3I 0.13tS
Uoptnttnt O.l'tt't 0J>W6 aMlt »Mlt
J-mtthylptntutt O.OSM
},4-(Um«th)'lp«iitui( 0.0St4
],2,4-lrim<thylptnUa( 0.1301 0.1131 0.1131
•tkyltnt 0.1131 0.1150 0.11(7 0.1000 0.3301 0.3301 O.OOfiO
propylcnt O.IIM O.0S34 0.3300 0.0111 O.OtlO 0.3M7 O.KM 0.0«13
l-butcn< 0.03S4 OitlOt O.OltO
Iruii-l-buUot 0J>1«« 0.01»1
cii-}-bul«n« 0.0313
K 2-authyl-l-but(n« 0.0317
t>9
]-m<(hyl-2-buUn<
b«nicii«
0.0317
OMU 0.0831
toluint 0.4««l 0.3403 OJOOO OJIIS 0.31 It 0.3000 0.3000
m'i)rl«a( 0JS80 0.US3 0.3000
a-iyl<n( OjOISI 0.01(1
t,l,4-lruii«thylb«nicn* 0.1331 0.3S03 0.1350 0i>SI1 0.0S«4
n-propylbcni<at 0.1371
itc-butylbtnicnt 0.U33
fonnUdchydc Oinoo ojnoo
kc«t^d<hyd«
CO AUTO'
total pu-aSln 0.71M o.«tso 0.7077 0.0000 0.0000 0.0S&0 0.3031 0.3031 0.7IU 0.i3t3 0.4103
total olc&n O.ltlt O.ltSO 0.2923 0.0000 0.0000 O.«300 OJlftt 0.31M 0.3337 0.1 til 0.1St3
total aromatic 0.0000 0.0000 0.0000 1.0000 1.0000 04360 0.1731 0.1731 0.0000 0.1000 0.1000
|CO).yMt.ii. matcbtd t« |CO|„4,,i.
9B
•< a
3
a
a
3
cr
o
a
Table S. Compoiitlon of Hydrocarbon MixtnxM mad ia UNC Smog Chamber Bxperimanta. "^
Oompoiind______________TOLXYL-KflXl TOUXYL-MIXJ TOL-XYL>MIXt TOL-TMB-XYM ISO./»A»TMPBW1ANE8 DODOEMIX II
biituii »*U»
pcnluit
iioptnluii 0.8000 3-iD«tl\]rlpcn(u>i
3,4-diinclkylf cnUni
3,2,4-lruntlhylpcnUni 0.6000
tlliyltnt OiMlS propyltnt 0.0SIO
l-bultn<
truii-]-bulcn< 0X49B
1^ cii-l-bnunt
W 2nMlhyl-lbul«n« 2-mcthyl-3-butcn<
tolucDi CftOOO O.Mtt O.M«« 0.4}U mxyltnt O.iOOO O.SStI O.I««7 0.3t72 o-xyltnt 0.1A«7 0.1»t4
l,2,4-lriinelhylbtnicii( 0.1331
n-propylbtnttnt •tc-butylbcatcnc
fornuMthyiie OXHI actttldthydt 0.00tt
CO______________________________________________________________________________________________________«-__________»_______
toUl pkr>rin 0.0000 0.0000 O.OOOO OilOOO 1.0000 0.t44t
loul olc&ji 0.0000 0.0000 O.OOOO OMOO 0.0000 O.ltSS lot^ ifonuUc 1.0000 1.0000 l.OOOO IMOO 0.0000 O.lSSt
Databaae Records___________________________________________________________________________Procesaing Status
Processing Status
This field is composed of a character string of length one representing the processing status of a run. The suitability of a run for mechanism testing depends on feictors such as sunlight or whether there are instrument problems associated with the particular run. As such, not all runs are worth processing. In addition, runs are assigned a priority for processing based on factors such as the experimental conditions or the extent to which the run conditions provided unique information. Five types of existing processing status and their corresponding codes follow:
• S - A fully processed and documented run, available for distribution on
magnetic media.
• P - A partially processed run, currently being processed, available in graph¬
ical form with estimated initial conditions of ca. ±20 %.
• L - A partially processed run of low priority, available in graphical form for raw data with target initial conditions of ca. ±20 % for NOx and HCs. This
type of run may never be fully processed. • N - Not to be processed, not available.
• U - Unprocessed run; a processible run but no processing has occurred.
Project
Four projects using the UNC Outdoor Smog Chamber have contributed data for model testing as well as for the experimental conditions database. The codes iden¬ tifying the project types were declared as character strings of length two. They
are:
• ET - Experiments to test explicit mechanisms for aldehydes, olefins, paraf¬
fins, and simple two-component of mixtures.
• RE - The reactivity grant project, primarily dealing with mixtures and
changes in mixture composition.
• AU - The automobile exhaust smog chamber project, dealing with the rela¬ tive reactivity of exhaust from two vehicle, with two g£isolines.
• ME - Methanol exhaust project, dealing with the relative reactivity of ex¬
haust from vehicle with methanol additive fuel. Series
Serieg______________________________________________________________________________________Databzise Records
SO as to aid modelers in choosing appropriate runs for model testings. Table 4 contains the forty series types set up for this purpose. Note that the leading zeros
for those series codes smaller than 10 can not be omitted since the database field
containing the series type is a character string of length two instead of an integer. Table 4. Series Codes Used in the Experimental Conditions Database
Code Series Name
01 Characterization; Background
02 Characterization; NOx oxid. NO only 03 Characterization; NOx oxid. CO added 04 Characterization; 03 decay
05 Characterization; N02/03,dark
06 Characterization; Aid. added 07 Matched propylene
08 Matched mixture
09 Matched other
10 Replicate propylene 11 Replicate other
12 Aldehyde development 13 Olefin development 14 Paraffin development 15 Aromatic development 16 HC type transition 17 Terpene development 18 Reactivity comparison 19 Single to Simple 20 Simple Comp. change 21 Complex Comp. change 22 Simple to Complex 23 Substitution, UNCMIX
24 Substitution, P/B
25 Substitution, SIMMIX 26 Substitution, Other 27 Addition, one species 28 Addition, CO
Databaac Records_______________________________________________________________________________________Rank
31 AutoExhaust 32 EKMA test 33 Delta HC 34 Delta NOx
35 Static to dynamic
36 Temperature effects
37 Water effects 38 Solar effects
39 Ketone development
40 All N02
Rank
Unlike all the fields mentioned earlier, this field is composed of an integer instead of a char£u:ter string. The purpose of ranking runs is to aid in selecting runs from
the database for model testing. Runs are ranked into various categories as shown
in Table 5.
Table 5. General Run Rankings Rank Range Category
1 Best in HC type
2-10 Best of kind
11-50 Satisfactory
51-100 Supporting
101-500 Some problems
501- Not for modeling
The assignment of the rank number to a run is a result of a subjective judgement based on overall quality of the run, weather conditions, and HC instruments used.
Concentrations and HC Species/Mixture Identifications
This section discusses a collection of fields whkh contain information on NOx and
HC concentrations, and HC species/mixture identifications. The fields are marked
Sunlight ________________________________Databage Racordi
6 reveab that the "Red Side Info" and "Blue Side Info" share a comnaon structure.
For simplicity, the structure of the "Red Side Info" will only be discussed since the discussion applies abo to the "Blue Side Info".
The first field of the "Red Side Info" contains the NOx concentration in ppm. The second, fourth and sixth fields of the "Red Side Info" contain concentrations,
in ppmC, of the first, second and third HC species/m^bcture respectively. The third, fifth and seventh fields of the "Red Side Info" contain identifications of the first, second and third HC species/mixture respectively. When there is less than three HC species/mixtures , the field corresponding to the empty HC species/mixtiire
will be given a value zero. As a rule, these fields are filled up in left to right order. All fields containing concentrations are of real type whereas all fields containing HC identifications are of integer type.
HC Instrument
This field contains the number of HC instrument used in a particulsu* experiment. The information in this field will be used to judge the quality of the run and to assign a rank to the particular run. This field is of integer type.
Quality of Run
The major determining factors in the quality of a run are weather conditions such as sunlight, cloudiness and haze condition as well as the number and performance of the analytical instruments. Details of grading techniques has been covered in the 1982 final report "Outdoor Smog Chamber Experiments to Test Photochemical
Models".^^ Experiments are rated on a scale of 0 to 9 (highest). This field is of
integer type.
Sunlight
3
Overview of Data Set
This chapter provides a general view of the data set by presenting the distributions of chamber runs according to different database attributes discussed in the previous chapter. A chapter with similar goal has been given in the 1985 UNC report.* Since
the publication of the report, however, eighty seven new runs have been added to the database. Not only these new runs brought the total number of runs in the database from 345 to 432, but they also made the information contained in the old report obsolete. This chapter updates the distributions information of the database and, at the same time, serves as a supplement to the discussions in the previous
chapter.
Period Covered, Distribution
Table 6 shows the distribution of experiments by year. Runs conducted in 1977-80 period were discussed in an earlier report.^* The number of runs listed for these years only included those experiments that have been fully processed. Runs conducted in 1984-86 period have not been covered in any earlier report.
Table 6. Distribution of Experiments by Year
Year Runs
'77 18
'78 45
'79 28
'80 23
Period Covered, Distribution Overview of Data Set
'82 90
'83 74
'84 52
'85 19
'86 16
Table 7 shows the distribution of experiments by month. It can be seen that experiments were performed mainly in the summer months when sunlight is abun¬ dant. Experiments conducted in non-summer months were primarily designed to provide data on temperature and solar effects.
Table 7. Distribution of Experiments by Month
Month Runs
Jan 3
Feb 1
Mar 2
Apr 1
May 4
Jun 65
Jul 91
Aug 97
Sep 73
Oct 69
Nov 23
Dec 3
Overview of Data Set Period Covered, Distribution
Code
Table 8. Distribution of Experiments by Project
Project Runs ET Exp. Test Photo. Mech. 1978-80 114 ET Exp. Test Photo. Mech. 1981-83 128 ET Exp. Test Photo. Mech. 1984-86 40
RE HC Reactivity 69
AU Automobile Exhaust 34
ME Methzmol Exhaust 47
The distribution of experiments by class is shown in Table 9. As can be seen, the majority of the runs are of "One day, regular" type.
Table 9. Distribution of Experiments by Class
Code Class Rims
C D 0 T S
Characterization 48
Second day, char 12 One day. regular 364 Two day, regular 5 Second day, reg. 3
Table 10 presents the breakdown of the runs by dilution and injection conditions. The characters enclosed in parenthesis are codes for the corresponding types.
Table 10. Distribution of Ebcperiments by Dilution and Injection Conditions
Dilution Injection Rims
Normal (N) Initial Only (I) 414
HC Continuous (H) 6
NOx Continuous (N) 0
HC tc NOx Continuous (B) 7
Other Combination (C) 1
Large (D) Initial Only (I) 2
HC Continuous (H) 0
NOx Continuous (N) 0
HC b NOx Continuous (B) 0
CompoundB and Mixtures Used___________________________________________________________Overview of Data Set
Compounds and Mixtures Used
A summary of experiments by the HC type is shown in Table 11 . "Single, olefins"
and "Mixture, complex" are by far the two predominant types of run.
Table 11. Distribution of Experiments by HC Type
Code HC T3rpe Runs
lA Single, aldehyde 49
10 Single, olefins 103
IP Single, paraffins 13
IR Single, aromatics 11
lU Single, ole vs aid 16
IV Single, ole vs par 2
IW Single, ole vs aro 3
IX Single. other 14
MB Mixture. simple 37
MC Mixture, complex 131
MV Mixture, varying 3
B Background air 41
S One side 4
Table 12 Number of Chamber Sides Containing Species lists all the species and the mixtures used in the experiments. The number given in the table is the number of chamber sides in which the species or mixture appreared.
Table 12. Number of Chamber Sides Containing Species
Sides Runs 54 ETHYLENE 204 PROPYLENE
Overview of Data Set Compounds and Mixtures Used
40 N-BUTANE
7 TRANS-2-BUTENE
1 ISOPENTANE
1 N-PENTANE
3 2,3-DIMETHYLBUTANE
1 BENZENE
50 TOLUENE
2 N-OCTANE
5 ETHYLBENZENE
28 M-XYLENE
14 O-XYLENE
5 N-PROPYLBENZENE
6 1,2,4-TRIMETHYLBENZENE
1 2,2,4-TRIMETHYLPENTANE
1 M-ETHYLTOLUENE
22 ISOPRENE
9 A-PINENE
78 FORMALDEHYDE
4 METHACROLEIN
4 METHYLVINYLKETONE
62 ACETALDEHYDE
3 ACETONE
3 BENZALDEHYDE
5 METHYL ETHYL KETONE
2 PROPIONALDEHYDE
9 BIACETYL
8 METHYLGLYOXAL
1
METHYLBENZYLQUINONE
1 N-PROPYLNITRATE
4 N-BUTYLNITRATE
4 3-PENTANONE
1 GYLYCOALDEHYDE
1 ACETONITRILE
12 METHANOL
7 03
41 CO
8 H202
5 N20
24 SYNTHETIC AUTO EXHAUST
Experimental Series Overview of Data Set
7 '72 DODGE AUTO EXHAUST CRYO
18 '79 VOLARE AUTO EXHAUST DIRECT
2 SYNTHETIC AUTO EXHAUST 0
3 SYNTHETIC AUTO EXHAUST lA
2 SYNTHETIC AUTO EXHAUST IB
18 SYNURBAN
4 SYNAUT084
2 HIMWAUTO
6 2 2 2 4
TOL/XYL/MIXl T0L/XYL/MIX2 TOL/XYL/MIX3 TOL/TMB/XYLS ISO-/2,2,4-TM-PENTANES
111 UNCMEK
9 SIMMIXl
11 COMARO
24 SIMARO
15 20
BUTANE/PROPYLENE
SIMMIX2
13 AROMATIC MIX
4 DODGEMIXn
28 TWODAYCON'T
56 BACKGROUND
Experimental Series
The distribution of runs by series is given in Table 13 . The series are grouped
according to properties designated by the first word of the name of each series. Table 13. Distribution of Experiments by Series
Code Name Runs
01 Char; Background 12
02 Char: NO oxid. NO only 7 03 Char: NO oxid. CO added 11
04 Char; 03 decay 9 05 Char; N02/03. dark 4
Overview of Data Set Qua
07 Matched propylene 39
08 Matched mixture 13
09 Matched other 25
18 Reactivity Comparison 149
23 Substitution. UNCMIX 12
24 Substitution. P/B 5
25 Substitution. SIMMIX 2
26 Substitution. Other 17
27 Addition, one species 3
28 Addition. CO 14
29 Addition. Aid 5
30 Addition, Other 6
33 Delta HC 60
34 Delta NOx 8
35 Static to dynamic 18
Quality, Rank, Processing Status, Sunlight
Quality, Rank, Processing Status, Sunlight
The distribution of runs by quality is shown in Table 14. It can be seen that the
majority of the runs are of resonably good qualities.
Table 14. Distribution of Experiments by Quality
Quality Runs
9 80
8 116
7 96
6 34
5 66
4 18
3 12
2 7
1 2
Quality, Rank, Processing Statua, Sunlight_________________________________________________Overview of Data Set
Table 15 gives the distribution of runs by rank. The distribution of runs by rank is pretty close in shape to that by quality. This is because quality of run is a
major factor influencing the assignment of rank to a run.
Table 15. Distribution of Experiments by Rank
Category of Rank Runs Best in HC type 10 Best of kind 167
Satisfactory 173
Supporting 42
Some Problems 22
Not for modeling 18
The distribution of runs by processing status is given in Table 16. Note the distinction between "Not to be processed" runs and "Unprocessed" runs. The former are runs which have been judged to be unsuitable for model testing, whereas the latter are runs which have not been processed but are suitable for model testing.
Table 16. Distribution of Experiments by Processing Status
Code Processing Status Rims S Fully processed; segfile 201 P Partially processed 56 L Partially processed; low priority 45 N Not to be processed 20 U Unprocessed run 110
Overview of Data Set_________________________________________________Quality, Rank, Processing Status, Sunlight
Table 17. Distribution of Experiments by Sunlight
Sunlight Runs
0- 10 31
11-20 13
21-30 15
31- 40 19
41-50 28
51-60 30
61-70 44
71-80 54
81-90 90
4
Overview of OSCECIS
We have discussed the features of the experimental conditions databases in Chap¬ ter 2 and 3. In this chapter and next, we will look at the Turbo Prolog program, OSCECIS, that handles the database. This chapter begins with an introduction to the three basic sections of a typical Turbo Prolog program. It then provides an overview of OSCECIS by presenting some of its special features and the principles underlying its design. The materials covered in this chapter lay the ground for the detailed discussions of the components of OSCECIS in next chapter.
Sample Turbo Prolog Program
To provide some common language for our disciissions in this and latter chapters, it is desirable to look at a simple Turbo Prolog program at this point.
A sample Turbo Prolog program is shown below. The numbers preceding the lines are for reference purposes. They are not part of the program. The wordings enclosed between "'/*'"diud "*/''are conmients.
Lines 2, 7, and 12 in the example contain kejrwords which prefaced the three basic sections found in a typical Turbo Prolog program.
1 /* Sample Turbo Prolog Program */
2 DOMAINS
3 person, author = symbol 4 title = string
Overview of OSCECIS __________________________________________________ Sample Turbo Prolog Program
7 PREDICATES
8 father(person, person) 9 reads(person, publication) 10 grandfather(person,person)
11
12 CLAUSES
13 father(torn,bob).
14 father(bob.george). 15 father(george,bill).
16 reads (torn, book (knuth,''The Art of Programming")). 17 reads (bob, book(dicken8, "The Tale of Two Cities")). 18 reads (george. book(tol8toy. "War and Peace")).
19
20 grandfather(X.Z) :- /* The grandfather of X is Z if */
21 father(X.Y). /* the father of X is Y and */ 22 father(Y.Z). /* the father of Y is Z */
The DOMAINS section is a mirror image of the TYPE section in a Pascal
program. In the example, line 3 declares two domains, person and author, which
consists of elements from the standard domain type symbol. Line 4 declares a
domain, title, which consists of elements from the standard domain type string.
Other staindard domain types available are integer, real, a.ndchar. Line 5 declares
a compound domain, publication, which consists of elements from the structured
domain type, book(author, publication), defined by the user.
The PREDICATES section corresponds to the VAR section in a Pascal program but with a major distinction: It declares the relations known to exist between the objects in the program through the predicates which take the forms:
predname
or
predname (domainl ,domain2...domainN)
where predname stands for predicate name and domainl,...,domainN stand for stan¬
dard type or user-defined domains. Lines 8, 9, and 10 contain examples of predicate
declarations.
Sample Turbo Prolog Program _____________________________________________________Overview of OSCECIS
are called facts. Line 20 through line 22 contain a different type of assertion called a rule.
In this report, we will use the word predicate (and avoid using the word clause)
to refer collectively to both facts and rules in a Turbo Prolog program. When a distinction between facts and rules is necessary, we will use the words "facts" and "rules" directly.
The only rule in the sample program is an example of Horn clauses which take
the form:
A if Bl and B2 and ... Bn.
where A is the head of the rule and Bl and B2 and ... Bn is the tail. In contrast to a Horn clause, a non-Horn clause takes the form:
Al or A2 or ... Am if Bl and B2 ... Bn.
Note that a non-Horn clause contains at least two heads separated by a logical or. Although a non-Horn clause can always be converted to a logically equivalent Horn clause by mioving the extra heads to the tail while negating them, the conversion is not unique in the sense that there is more than one way to choose the it heads to be moved over. This is the major reason why a language based on non-Horn clauses is inefficient in terms of computation time, although this type of language is more expressive than Prolog. As an example, the following non-Horn clause:
Al or A2 if Bl and B2 and ... Bn.
can be converted into either of the following two Horn clauses:
Al if not(A2) and Bl and B2 and ... Bn.
or
A2 if not(Al) and Bl and 82 and ... Bn.
Overview of OSCECIS_______________________________________________________Overall Organitation of OSCECIS
Overall Organization of OSCECIS
The main objective of developing OSCECIS is to make the information contained in the database easily accessible. To achieve this end, the window facility of Turbo Prolog was used extensively to produce a series of menus. An interactive session with OSCECIS is almost equivalent to choosing appropriate panels from a series of pop-up menus. Whenever the user makes a mistake, he or she can easily back up by striking the Esc key as many times as necessary without causing any adverse side effect or even a failure to the system. Other handy facilities that OSCECIS provides are: access to the DOS commands, access to an editor, an online tutorial containing instructions on how to use the system, database updating f2M:ilities, a database diagnosing tool, and access to the eight types of codes use in the database. These features, together with the ease with which the users can get information out of the database, make OSCECIS a user-friendly system.
Figure 7 shows the main menu of OSCECIS. The panels in the box contain the ten options available in the system. In this section, we will discuss in detail the options which are comparatively simpler than the two particular options, "Query the database" and "Update the database". The last two options constitute the core of OSCECIS and are fairly complicated. They will be discussed separately in the
next two sections.
Tutorial
The online tutorial is stored on a text file. It is invoked by choosing the "Tutorial" panel in the main menu of OSCECIS. The content of the tutorial can be inspected
(but not altered) using cursor control keys {e.g. arrow keys to move one position at
a time, Home to move to the first position of a line etc.), screen control keys (e.g.
PgUp to go up one page of screen), or function keys {e.g. F2 to go to a line, FS to
search for a chara<:ter string). In addition, the window which displays the tutorial can be resized by following the instructions shown in the highlighted area below the window. These nice facilities are provided for free with a simple call to a built-in
predicate, display, of Turbo Prolog.
Access to DOS Commands
Loading and Saving Database Overview of OSCECIS
Main Menu
Tutorial
DOS commands Editor
Load the database
Save the database on file View the database codes
Diagnose the database
Update the database
Query the database
Miscellaneous
Figure 7. Main Menu of OSCECIS
Editor
The editor is accessible by choosing the "Editor" panel in the main menu. Besides text entering, the editor allows uses of cursor control keys to move around the window while editing. Many function keys can also be used to Jwrhieve certain functions such as copying, searching, or moving text strings. A second editor can also be brought to the currently active editor window to achieve viewing or copying of text from other files. An online help on the use of the editor is also available by choosing the Fl key from within the editor. A summary of the functions of the
editor is given in Appendix A. Loading and Saving Database
Overview of OSCECIS________________________________________________________ Viewing the Database Codea
contains the experimental conditions of each run in the database. The third file
contains mainly concentrations of NOx, and identifications and concentrations of HC species/mixtures used in the two sides of the chamber for each run in the database. A review of Figure 6 is helpful at this point. The reasons for breaking up the run records into two files are primarily due to the considerations of execution efficiency and of the limitation imposed by the Turbo Prolog system on the size of
a file to 64 kilobytes. We will come back to these in next section.
The "Save the database" option should be invoked whenever the user wants the changes made to the database to be saved. When the option is selected, the updated copy of the database will be saved to files ee.dbl and ec.dbS, and the old database will be moved to files ecdb.dbl and ecdb.dbS respectively.
The users are allowed to choose the "Load the database" panel only once in the
entire interactive session. The "Save the database on file" option, on the other hand,
may be selected as many times as necessary in a session.
Viewing the Database Codes
The codes and corresponding attribute names in the file ec.cod mentioned previously
can be viewed by choosing the "View the database codes" panel in the main menu.
When the panel is selected, a menu containing eight options for viewing the
database codes as shown in Figure 8 will appear. The first two types of codes, species and series codes, are especially useful in the process of querying the database.
Since the first two types of codes can not fit into a screen, two separate text files,
ec.spe and ec.ser, were created to contain the respective codes and names. The species codes are arranged in increasing order of species names whereas the series codes are arrajiged in increasing order of the codes. When either type of codes is chosen for viewing, OSCECIS will display the contents of the chosen type of codes
in the same way it does to display the text file containing the tutorial. The users
can inspect the codes and corresponding names the way they inspect the tutorial file by using either cursor or screen control keys, or other function keys.
The remaining six types of codes are all relatively short. Upon request, the codes and names of each type will be extracted from the ec.cod file and printed on
Miscellaneous Overview of OSCECIS
---Viewing
Codes---Species codes
Series Codes
HC Type Codes
Class Codes Dilution Codes
Injection Codes
Project Codes
Processing Status Codes
Figure 8. Menu for Viewing the Database Codes
Diagnosing the Database
To check the possible errors in the database, the "Diagnose the database" panel should be chosen. Upon being activated, OSCECIS will collect the eight types of codes from the file ec.cod and put them into eight different lists. It then picks
up eaich record (recall that each record is divided into two parts) and examines
the fields against the lists. Whenever a certain field contains a code which can not be found in the corresponding list, a message will be generated, telling which field of which record is possibly in error. The word "possibly" was used in the last sentence because the error may be due to the codes in the ec.cod file instead. This happens when new species or new conditions was used in the new experiments but their corresponding codes have not been added to the ec.cod file by the time when the interactive session is taking place. This option can, thus, help maintain the consistency among various database files.
Miscellaneous