A
New Topology For Hybrid Wind-Solar Energy System
1*
Shaik Jainulabdin,
2*Firoz Ali Mohammed
M.Tech Scholar,
Associative Professor
Department of Electrical & Electronics Engineering,Nimra College Of Engineering & Technology, Krishna (Dist.,), A.P; India.
ABSTRACT:
Preventing Environmental pollution is becoming a tough task to the scientist. This paper presents a new system configuration which allows the two sources to supply the load separately or simultaneously depending on the availability of the energy sources. The inherent nature of this Cuk fused converter, additional input filters are not necessary to filter out high frequency harmonics. Harmonic content is detrimental for the generator lifespan, heating issues, and efficiency.
The structure proposed is a fusion of the buck and buck-boost converter. The systems in literature require passive input filters to remove the high frequency current harmonics injected into wind turbine generators. The harmonic content in the generator current decreases its lifespan and increases the power loss due to heating .In this project, an alternative multi-input rectifier structure is proposed for hybrid wind/solar energy systems. The proposed design is a fusion of the Cuk converter.
Key word: Boost Converter, inverter, Fuel cell unit, Photovoltaic system, Wind plant.
1. INTRODUCTION:
With increasing concern of global warming and the depletion of fossil fuel reserves, many are looking at sustainable energy solutions to preserve the earth for the future generations. Other than hydro power, wind and photovoltaic energy holds the most potential to meet our energy demands. Alone, wind energy is capable of supplying large amounts of power but its presence is highly unpredictable as it can be here one moment and gone in another. Similarly, solar energy is present throughout the day but the solar irradiation levels vary due to sun intensity and unpredictable shadows cast by clouds, birds, trees, etc. The common inherent drawback of wind and
photovoltaic systems are their intermittent natures that make them unreliable. However, by combining these two intermittent sources and by incorporating maximum power point tracking (MPPT) algorithms, the system’s power transfer efficiency and reliability can be improved significantly.
When a source is unavailable or insufficient in meeting the load demands, the other energy source can compensate for the difference. Several hybrid wind/PV power systems with MPPT control have been proposed and discussed. Most of the systems in literature use a separate DC/DC boost converter connected in parallel in the rectifier stage as shown in Figure 1 to perform the MPPT control for each the renewable energy power sources. A simpler multi input structure has been suggested by that combine the sources from the DC-end while still achieving MPPT for each renewable source.
The structure proposed by is a fusion of the buck and buck-boost converter. The systems in literature require passive input filters to remove the high frequency current harmonics injected into wind turbine generators. The harmonic content in the generator current decreases its lifespan and increases the power loss due to heating. In this paper, an alternative multi-input rectifier structure is proposed for hybrid wind/solar energy systems. The Proposed design is a fusion of the Cuk converter.
The features of the proposed topology are:
1. The inherent nature of these two converters eliminates the need for separate input filters for PFC
2. It can support step up/down operations for each renewable source (can support wide ranges of PV and wind input)
3. MPPT can be realized for each source; 4. Individual and simultaneous operation is
.
Figure 1: Hybrid system with multi-connected boost converter
2. PROPOSED MULTI-INPUT
RECTIFIER STAGE:
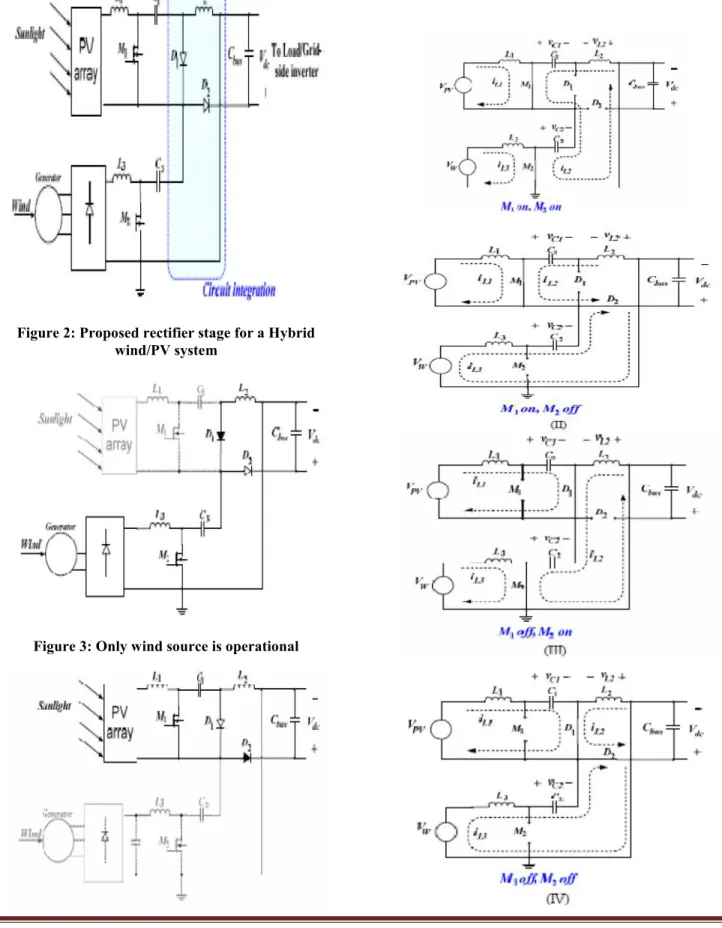
A system diagram of the proposed rectifier stage of a hybrid energy system is shown in Figure 2, where one of the inputs is connected to the output of the PV array and the other input connected to the output of a generator. The fusion of the two converters is achieved by reconfiguring the two existing diodes from each converter and the shared utilization of the Cuk output inductor by the SEPIC converter. This configuration allows each converter to operate normally individually in the event that one source is unavailable. Figure 3 illustrates the case when only the wind source is available. In this case,D turns off and
D turns on; the proposed circuit becomes a SEPIC converter and the input to output voltage relationship is given by (1). On the other hand, if only the P source is available, thenD turns off andD will always be on and the circuit becomes a Cuk converter as shown in Figure 4 The input to output voltage relationship is given by (2). In both cases, both converters have step-up/down capability, which provide more design flexibility in the system if duty ratio control is utilized to perform MPPT control.
=
=
versa. To provide a better explanation, the inductor current waveforms of each switching state are given as follows assuming thatd >d ; hence only states I, III, IV are discussed in this example. In the following,
I, is the average input current from the PV source;
I, is the RMS input current after the rectifier (wind case); andI is the average system output current. The key waveforms that illustrate the switching states in this example are shown in Figure 6. The mathematical expression that relates the total output voltage and the two input sources will be illustrated in the next section.
State I ( on, on):
=
,+
< <
=
+
+
< <
=
,+
< <
State III ( off, on):
=
,+
−
;
< <
=
+
;
< <
=
,+
;
< <
Figure 2: Proposed rectifier stage for a Hybrid wind/PV system
Figure 3: Only wind source is operational
Figure 5 (I-IV): switching states within a switching cycle
Figure 6: Proposed circuit inductor waveforms Find an expression for the output DC bus voltage, Vdc, the volt-balance of the output inductor,L , is examined according to Figure 6 with d > d . Since the net change in the voltage of L is zero, applying volt-balance toL results in (3). The expression that relates the average output DC voltage (V ) to the capacitor voltages (v andv ) is then obtained as shown in (4), where v andv can then be obtained by applying volt-balance to L and L . The final expression that relates the average output voltage and the two input sources (V andV ) is then given by (5). It is observed thatV is simply the sum of the two output voltages of the Cuk converter. This further implies thatV can be controlled by d and d .Individually or simultaneously.
( + ) + ( )( − ) + ( −
− =
The switches voltage and current characteristics are also provided in this section. The voltage stress is given by (6) and (7) respectively. As for the current stress, it is observed from Figure 6 that the peak current always occurs at the end of the on-time of the MOSFET. Both the Cuk MOSFET current consists of both the input current and the capacitors (C
orC ) current. The peak current stress ofM andM
are given by (8) and (10) respectively.L AndL , given by (9) and (11), represent the equivalent inductance of Cuk and SEPIC converter respectively. The PV output current, which is also equal to the average input current of the Cuk converter, is given in (12). It can be observed that the average inductor current is a function of its respective duty cycle (d ). Therefore by adjusting the respective duty cycles for each energy source, maximum power point tracking can be achieved.
=
+ −
( )
=
+ −
( )
,
=
,+
,+
( )
=
+
( )
,
=
,+
,+
( )
=
+
( )
,
=
−
( )
unpredictable shadows cast by clouds, birds, trees, etc. These drawbacks tend to make these renewable systems inefficient. However, by incorporating maximum power point tracking (MPPT) algorithms, the systems’ power transfer efficiency can be improved significantly. To describe a wind turbine’s power characteristic, equation (13) describes the mechanical power that is generated by the wind [6].
= . ( , ) ( )
where
Ρ = air density, A = rotor swept area,
C (λ , β) =Power coefficient function, λ = tip speed ratio,
β = pitch angle,
v = wind speed
The power coefficient (Cp) is a nonlinear function that represents the efficiency of the wind turbine to convert wind energy into mechanical energy. It is dependent on two variables, the tip speed ratio (TSR) and the pitch angle. The TSR, λ, refers to a ratio of the turbine angular speed over the wind speed. The mathematical representation of the TSR is given by (14). The pitch angle, β, refers to the angle in which the turbine blades are aligned with respect to its longitudinal axis.
=
( )
Where
R = turbine radius,
ω = angular rotational speed
Figure 7 and 8 are illustrations of a power coefficient curve and power curve for a typical fixed pitch (β =0) horizontal axis wind turbine. It can be seen from figure 7 and 8 that the power curves for each wind speed has a shape similar to that of the power coefficient curve. Because the TSR is a ratio between the turbine rotational speed and the wind speed, it follows that each wind speed would have a different corresponding optimal rotational speed that gives the optimal TSR. For each turbine there is an optimal TSR value that corresponds to a maximum value of the power coefficient (Cp,max) and therefore the maximum power. Therefore by controlling rotational speed, (by means of adjusting theelectrical loading of the turbine generator) maximum power can be obtained for different wind speeds.
Figure 7: Power Coefficient Curve for a typical wind turbine
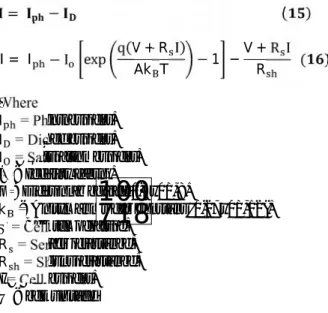
Figure 8: Power Curves for a typical wind turbine A solar cell is comprised of a P-N junction semiconductor that produces currents via the photovoltaic effect. PV arrays are constructed by placing numerous solar cells connected in series and in parallel. A PV cell is a diode of a large-area forward bias with a photo voltage and the equivalent circuit is shown by Figure 9. The current-voltage characteristic of a solar cell is derived in and as follows:
= − ( )
I = I − I exp q(V + R I)
Ak T − 1 − V + R I
R ( )
Where
I = Photocurrent,
I = Diode current,
I = Saturation current, A = Ideality factor,
q = Electronic charge 1.6x10⁻⁹,
k = Boltzmann’s gas constant (1.38x10⁻²³), T = Cell temperature,
R = Series resistance,
Figure 9: PV cell equivalent circuit
Typically, the shunt resistance (R ) is very large and the series resistance (R ) is very small. Therefore, it is common to neglect these resistances in order to simplify the solar cell model. The resultant ideal voltage-current characteristic of a photovoltaic cell is given by (17) and illustrated by Figure 10.
=
−
−
( )
Figure 11: PV array output characteristics The typical output power characteristics of a PV array under various degrees of irradiation is illustrated by Figure 11. It can be observed in Figure 11 that there is a particular optimal voltage for each irradiation level that corresponds to maximum output power. Therefore by adjusting the output current (or voltage) of the PV array, maximum power from the array can be drawn.
Figure 11: PV cell power characteristics Due to the similarities of the shape of the wind and PV array power curves, a similar maximum power point tracking scheme known as the hill climb search (HCS) strategy is often applied to these energy sources to extract maximum power. The HCS strategy perturbs the operating point of the system and observes the output. If the direction of the perturbation (e.g. an increase or decrease in the output voltage of a PV array) results in a positive change in the output power, then the control algorithm will continue in the direction of the previous perturbation. Conversely, if a negative change in the output power is observed, then the control algorithm will reverse the direction of the pervious perturbation step. In the case that the change in power is close to zero (within a specified range) then the algorithm will invoke no changes to the system operating point since it corresponds to the maximum power point (the peak of the power curves).
4. PROPOSED MODULATION
TECHNIQUE:
Multicarrier Modulation:
This technique involves the carrier based PWM Carrier Based PWM. These are the classical and most widely used methods of pulse width modulation. They have as common characteristic sub cycles of constant time duration, a sub cycle being defined as the total duration Ts during which an active inverter leg assumes two consecutive switching states of opposite voltage polarity. Operation at sub cycles of constant duration is reflected in the harmonic spectrum by two salient sidebands, centered around the carrier frequency, and additional frequency bands around integral multiples of the carrier.
The multi carrier modulation technique is very suitable for a multilevel inverter circuit. By employing this technique along with the multilevel topology, the low THD output waveform without any filter circuit is possible. Switching devices, in addition, turn on and off only one time per cycle. That can overcome the switching loss problem, as well as EMI problem.
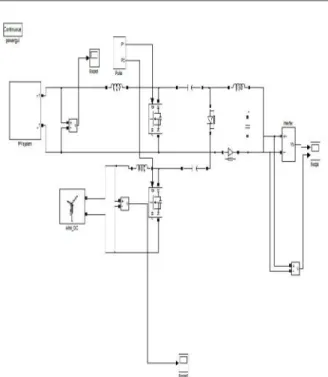
Fig. 12: Simulation Diagram of Hybrid wind- solar energy system
6. SIMULATION RESULTS:
In this section, simulation results from PSIM 8.0.7 is given to verify that proposed multi-input rectifier stage can support individual as well as simultaneous operation.
Figure 13: simultaneous operation of the AC & DC Voltage sources
Figure 14: Simultaneous operation with both wind and PV Voltage source
7. CONCLUSION:
In this paper a new multi-input Cuk-SEPIC rectifier stage for hybrid wind/solar energy systems has been presented. The features of this circuit are:
1) Additional input filters are not necessary to filter out high frequency harmonics.
2) Both renewable sources can be stepped up/down. 3) MPPT can be realized for each source.
4) Individual and simultaneous operation is supported. Simulation results have been presented to verify the features of the proposed topology.
ADVANTAGES:
a. Low operating cost b. High power quality c. Easy to chargeAPPLICATIONS:
a) Distributed Generation Applications, b) Constant Speed and Variable Speed Wind
Energy Conversion Systems, c) Photovoltaic Energy System.
REFERENCES:
[1] S.K. Kim, J.H Jeon, C.H. Cho, J.B. Ahn, and S.H. Kwon, “Dynamic Modeling and Control of a Grid-Connected Hybrid Generation System with Versatile Power Transfer,” IEEE Transactions on Industrial Electronics, vol. 55, pp. 1677-1688, April 2008. [2] D. Das, R. Esmaili, L. Xu, D. Nichols, “An Optimal Design of a Grid Connected Hybrid Wind/Photovoltaic/Fuel Cell System for Distributed Energy Production,” in Proc. IEEE Industrial Electronics Conference, pp. 2499-2504, Nov. 2005. [3] N. A. Ahmed, M. Miyatake, and A. K. Al-Othman, “Power fluctuations suppression of stand-alone hybrid generation combining solar photovoltaic/wind turbine and fuel cell systems,” in Proc. Of Energy Conversion and Management, Vol. 49, pp. 2711-2719, October 2008.
[4] S. Jain, and V. Agarwal, “An Integrated Hybrid Power Supply for Distributed Generation Applications Fed by Nonconventional Energy Sources,” IEEE Transactions on Energy Conversion, vol. 23, June [5] Y.M. Chen, Y.C. Liu, S.C. Hung, and C.S. Cheng, “Multi-Input Inverter for Grid-Connected Hybrid PV/Wind Power System,” IEEE Transactions on Power Electronics, vol. 22, May 2007.
conversion systems” in Proc. of the IECON 2004 Conference, pp. 3100- 3105, Nov. 2004
[7] R. W. Erickson, “Some Topologies of High Quality Rectifiers” in the Proc. of the First International Conference on Energy, Power, and Motion Control, May 1997.
AUTHOR PROFILE:
1*
Shaik Jainulabdin
is a PG scholar doing his M. Tech in Power Systems in Nimra College of Engineering & Technology, Ibrahimpatnam. Earlier he has completed his undergraduate in the field of Electrical and Electronics Engineering in QIS College of Engineering and Technology, Ongole.His email id is:[email protected]..
2*