An Open Tracing System for P2P File Sharing Systems
Danny Hughes, James Walkerdine
Computing Department Lancaster University
Lancaster, UK
[email protected] | [email protected]
Kevin Lee
School of Computer Science University of Manchester
Manchester, UK [email protected]
Abstract— This paper describes the Open P2P tracing system which aims to improve the research community’s understanding of P2P file sharing systems by providing continuous and up-to-date traffic data which is anonymized and made freely accessible to all interested parties. It is our hope that this open data set will grow over time into a resource capable of exposing trends in P2P network usage and promote research into the socio-technical factors that drive user behaviour on P2P file sharing systems.
Keywords-component; P2P; File Sharing; Monitoring
I. INTRODUCTION
Since the release of Napster [1] in 1999, peer-to-peer (P2P) file-sharing has enjoyed a meteoric rise in popularity, to the point that P2P applications are now responsible for more traffic than any other Internet application [2]. Given the scale of P2P traffic, understanding traffic characteristics is of critical importance and has specific benefits in the context of: i) provisioning network infrastructure, ii) informing network policy, iii) informing the design of new P2P applications and managing existing P2P communities.
Several significant studies of P2P file sharing systems have been performed. These existing studies have illuminated a range of P2P characteristics; however, we believe that there remain significant shortcomings in the current body of research on P2P file sharing systems. These shortcomings include:
The extensive use of closed data sets, which prevents the findings of existing studies being revisited. Furthermore, as P2P traces may take months or even years to perform, the use of closed data-sets has led to significant duplication of effort.
Trend analysis is poorly supported by existing studies, which, with a few exceptions [3] [4], are not of sufficient duration to reveal trends in user behaviour.
Cross discipline perspective is often lacking in existing studies, which tend to concern themselves largely with technical factors.
We hope to address the above shortcomings through the development of the Open P2P Tracing System which aims to produce a significant, public and freely accessible data-set. P2P traffic will be monitored on a long-term basis and made available in near real-time, allowing the identification of trends and the revisiting of data points. Access to the data is simplified as far as possible to encourage the use of this data
set by researchers from non-computing backgrounds such as sociology and economics.
The remainder of this document is structured as follows: In section 2 we introduce P2P tracing methodologies. Section 3 discusses existing empirical P2P studies. Section 4 describes the design and implementation of the Open P2P Tracing System. Section 5 provides an initial evaluation of system functionality and finally, section 6 discusses avenues for future work.
II. P2PTRACING METHODOLOGIES
Empirical studies of P2P systems use one of three tracing methodologies: network-level tracing, passive application-level tracing or active application-level tracing, as described in ‘Monitoring Challenges and Approaches for P2P File Sharing Systems’ [5].
Network-level traces are performed by deploying code on core or gateway network infrastructure and performing IP-level packet monitoring. Network-level tracing is transparent to the P2P network, however, this approach introduces local bias, resulting from deployment location and accurate identification of P2P traffic can be highly problematic.
Passive application-level traces are performed by monitoring the messages passed at the application level. In modern decentralised file-sharing systems all peers participate in message passing and therefore passive monitoring can be achieved simply by modifying a peer to log the messages that it is required to route. Passive application-level tracing is transparent and may be performed without access to core network infrastructure, though the rate at which data can be gathered using this methodology is significantly lower than that of network-level tracing.
Active application-level traces address the scalability shortcomings of passive application-level tracing by employing an aggressive querying and connection policy wherein the monitoring peer attempts to reconnect to and interrogate as much of the application-level network as possible; crawling the P2P network in order to maximize the size and typicality of trace data. While this approach improves the quality of trace-data and the speed at which it is acquired, it does so at the expense of transparency due to the disruptive effect of repeated reconnections and high message generation on the P2P system being monitored.
Section 3 discusses significant empirical studies of P2P file sharing networks, organized according to the tracing
methodology used. The findings of these studies are summarized along with their shortcomings.
III. EMPIRICAL STUDIES OF P2PFILE SHARING SYSTEMS
Network-level traces are typically used to record the low-level characteristics of P2P traffic flows on private networks. Plonka et al performed the first network-level study of P2P traffic, which analyzed the bandwidth consumed by Napster on the University of Wisconsin-Madison campus network in 2000 [6]. Even at this early stage, it was found that P2P traffic consumed more bandwidth than web traffic. In June 2002, a university of Washington study [2] analyzed the bandwidth consumed by Napster and Kazaa, finding that these systems now consumed 43% of campus bandwidth, triple that of web applications. This study also provided valuable data regarding the characteristics of the P2P work-load including typical file-size and distribution. Gummadi et al. continued monitoring work at the University of Washington in 2003 with a 200-day trace of Kazaa [3]. Uniquely this trace was long enough to observe seasonal variations in traffic and the effect of changing network policies.
While Network-level tracing is transparent and scalable, this approach requires access to core network infrastructure and is subject to local biases, for example, one might expect that the level of P2P traffic on campus networks would be dependent upon the usage policy of such networks.
Passive application-level traces are typically used to study application-level properties in an Internet-wide context. The first passive application-level trace was performed by Adar and Huberman in 2000 on the Gnutella 0.4 network [7] to assess the scale of a problem known as ‘free riding’, wherein users download from, but do not upload to a P2P file-sharing system. Adar and Huberman discovered that participation in Gnutella was highly asymmetric, with only around a third of users choosing to share files. Hughes et al revisited the results of the Adar study in 2004 on Gnutella 0.6 [8]. Hughes discovered that in the intervening years, free-riding had increased from 66% to 85%. Hughes et al performed an additional study in 2005 to assess the level of illegal pornographic material being distributed on the Gnutella network [9]. The study found that an average of 1.6% of searches and 2.4% of responses contained references to illegal pornography.
Passive application-level monitoring is transparent. Unlike network-level monitoring, this methodology does not require access to low-level infrastructure. Unfortunately, in cases where a very large sample of network traffic must be acquired quickly, passive monitoring would be unsuitable due to the small-world properties of modern P2P systems.
Active application-level monitoring is typically used to study P2P traffic properties in an Internet-wide context, where a very large body of trace data is required. Ripneau et al [10] performed the first active application-level trace of the Gnutella network in 2001. This study mapped the Gnutella network and found that the structure of the network was such that it would not scale to very large number of nodes. Saroui et al. [11] later performed a one month crawl of Gnutella in May 2001 and recorded each peer’s IP address, latency, bandwidth and files shared. Chu et al [12] performed a study to quantify availability
on Gnutella in 2002. Chu found a strong correlation between time-of-day and node availability and proposed a model to describe peer availability.
Active application-level monitoring is relatively easy to deploy and data gathered in this manner should not contain local bias; however, the aggressive reconnection and interrogation methodology employed makes this approach invasive and limits its scalability.
The studies described in this section have provided valuable insights into the characteristics of P2P traffic, however; when considered as a body of work, they demonstrate the shortcomings described in section 1. Studies often tend to focus on technical factors and, with the exception of Hughes [9] do not include interdisciplinary work. Also, with the exception of Gummadi [3], these studies are not of sufficient length to show trends in user behaviour. Finally and perhaps most critically, all of these studies use closed data sets, preventing their findings being revisited or verified.
The work discussed in this survey demonstrates the advantages of each tracing methodology in certain situations. We will now examine the suitability of each methodology for supporting the requirements outlined in section 1.
Promoting re-use of trace data: Tracing methodology has a direct impact on the reusability of trace data. Specifically, as network-level tracing introduces local bias, data gathered in this way would typically be of interest to a smaller audience.
Supporting long-term trend analysis: Tracing methodology has a direct bearing on the feasibility of long-term tracing. A disruptive or invasive approach is not likely to be tolerated for very long by a P2P file-sharing community. For this reason, long-term active application-level tracing is infeasible.
Encouraging cross-discipline research: While tracing methodology has no direct bearing on facilitating cross-discipline research, fields which hold promise for understanding P2P communities, such as sociology and economics tend to be interested in high-level system properties, which are most readily available through application-level tracing.
It is therefore clear that in the context of providing an open, reusable and long term body of trace data; passive application-level monitoring is the most viable tracing methodology.
IV. DESIGN OF AN OPEN P2PTRACING SYSTEM
This paper has made the case that an open, easy to access and long-term P2P trace is required to improve our understanding of P2P file sharing systems. This section now discusses the design and implementation of such a system: The Open P2P Tracing System. As previously described, the system will use a passive application-level tracing methodology [5] to gather data. The implementation of this functionality will now be described.
A. Tracing Functionality
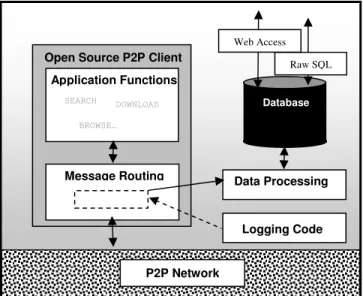
Implementation of tracing functionality is dependent upon the P2P system being monitored. As the Open Tracing System aims to provide a widely reusable data set, we intend to monitor several of today’s most popular P2P systems, including Gnutella [13], Fasttrack [14], eDonkey [15], DirectConnect [16] and Bittorrent [17]. In order to minimize the time required to port monitoring code to additional P2P networks we implement logging functionality by modifying existing open source clients available for each P2P network. Analysis of such clients, which include Jtella [18], Open DirectConnect [19] and Azureus [20] revealed that each shared elements of common structure. Of particular significance in terms of implementing tracing support was that each client implements a single routing component which is used to process incoming and outgoing messages. It is into this routing component that we insert monitoring code. This is shown in Figure 1.
Figure 1. System Architecture
In order to ensure that sufficient data is gathered, the system is capable of maintaining a large number of network connections, for example by connecting as an Ultrapeer when monitoring Gnutella. Furthermore, in order to ensure data is representative, the system periodically re-connects to different areas of the P2P network.
B. Maintaining User Anonymity
Publication of IP addresses and other identifying data is highly ethically dubious and would likely have a number of undesirable effects. Studies have suggested that P2P users are migrating to those file sharing systems which are more difficult to monitor [21]. It is therefore likely that publication of user data from one P2P system would drive users to other, unmonitored systems or perhaps even result in the P2P community excluding the tracing client. Recent research [9] has also suggested that the level of perceived anonymity offered by P2P networks has a significant effect on user
behaviour. This implies that the publication of IP addresses might cause a significant ‘observer effect’.
While maintaining anonymity is desirable, a globally unique user identifier (GUID) is often required to accurately track the behaviour of users over time. For this reason, as data is gathered, all IP addresses and user-names are switched for a randomly assigned GUID. Any additional information encapsulated in the original identifier, such as country and service provider, is resolved and stored separately in the database.
Replacing real world identifiers with a randomly assigned but consistent GUID prevents third parties from associating trace data with individuals. However, long term this method would lead to the accumulation of data on millions of P2P users, which gives rise to significant security implications. We have therefore arrived at a compromise solution, wherein we only attempt to ensure that GUIDs remain unique during a typical period of connection (session), after which time the IP/GUID mapping is discarded and, if that peer is observed again, it will be assigned a new GUID.
This compromise between maintaining anonymity and user tracking is evaluated in section 5.
C. Data Collection and Storage
Due to the scalability problems associated with resource discovery on decentralized P2P networks, P2P systems have increasingly moved towards Super-node architectures such as the architecture used in Kazaa [14] or the Gnutella 0.6 ultra-peer scheme. Concurrently, the scalability problems which arise from the use of a single indexing server have prompted centralised systems to move towards more decentralized architectures that utilize user-hosted indexing servers as demonstrated by DirectConnect and eDonkey. In both cases, the presence of peers on the application-level network which are responsible for routing a greater proportion of messages facilitates application-level monitoring. By connecting to the network as a Gnutella ‘ultra-peer’, a Direct Connect ‘hub’ or eDonkey ‘server’, a greater proportion of traffic can be captured using passive application-level monitoring.
As we intend that tracing data should be made accessible to a broad audience, we use a standard MySQL database for data storage. As SQL is currently the most popular database technology we hope this will maximize the accessibility of the system. A separate SQL database is maintained for each P2P system being monitored and each of these databases contains per-message tables. Each message that is stored in the database is time-stamped, facilitating the retrieval of data for a specific instant or time-period. In order to maintain flexibility, the system also logs all message types as it is difficult to predict in advance what data may be of interest to other researchers D. Data Access and Presentation
Alongside raw SQL access, we also provide a web-based method of data access for interested parties. We hope this will allow the system to support a range of users with diverse requirements. We envision that three classes of user will make
Open Source P2P Client
Message Routing P2P Network Application Functions SEARCH BROWSE… DOWNLOAD Database Raw SQL Web Access Data Processing Logging Code
use of the system: i) corporate users, ii) computing researchers and iii) non-computing researchers.
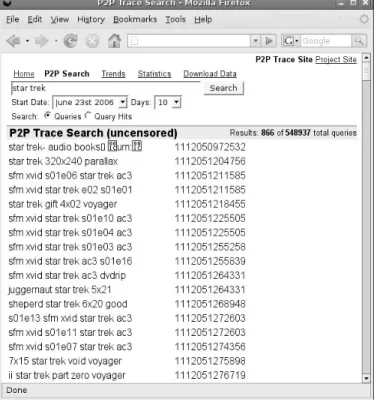
Corporate users of the system might include P2P developers, who could use the system to assess the market penetration of their P2P products, and the music and film industry that might use the system to assess the extent to which their products were being distributed on P2P systems. To facilitate access for corporate users in particular, the system supports on-the-fly generation of common graphs illustrating both current and historic data based on a number of criteria including: P2P client popularity, file popularity and availability, level of user participation and free-riding. The system is also capable of exporting this same data in common formats such as comma separated value (CSV) files and Excel (XLS) spreadsheet documents. To further facilitate the association of P2P traffic with real-world factors, graphical data is annotated with news articles containing references to P2P, which are culled from RSS feeds. This functionality may be used to answer questions such as whether high-profile copyright prosecutions increase levels of free-riding, or whether news about a specific P2P client affected its level of use.
Figure 2. Web Interface of the Open Tracing System
Computing researchers are most likely to be interested in accessing raw traffic data provided by the system. This is possible through direct access to the SQL database which allows more versatility in interrogation than hard-coded trend data that the system provides.
Non-computing researchers are supported by the systems ability to export traffic data in CSV and XLS formats, which can both be accessed using common office software. It is also possible that ‘casual’ Internet users may find this data of
interest, though the requirements of these users have not been explicitly considered in the design of the system. The web interface is shown in Figure 2 below.
E. Implementation Status and Access
The current implementation of the Open Tracing System focuses on the tracing of the Gnutella network, the results of which are being used as a basis to evaluate system functionality (as will be discussed in section 5). Adding support for tracing additional networks is being implemented in parallel to this.
The system is currently at a pre-alpha stage and therefore access to it must currently be arranged through the authors of this paper. However, we are actively looking for case studies, such as those described in section 6, which we hope will guide system development. We anticipate that, in due course, the open P2P tracing system will be made freely accessible online.
V. INITIAL EVALUATION RESULTS
We have begun analyzing the performance of the Open P2P Tracing System in terms of its network, computational and storage requirements. The system is hosted and evaluated on a 2.8GHz Intel P4 with 512MB RAM and a 100GB hard drive connected to the Internet via a high-speed academic network.
In order to minimize invasiveness during evaluation, the modified tracing peer maintains a single ultra-peer connection and allows unlimited incoming leaf-node connections. As previously described, in order to ensure the typicality of our trace, the system periodically reconnects to the network at an interval of six hours.
A. Networking Requirements
The local network requirements of tracing Gnutella have been assessed through experimentation, while gathering trace data. This reveals that the system consumes an average bandwidth of 98kbps as a result of routing resource discovery messages and an additional 9kbps due to routing control messages, which is commensurate with results obtained elsewhere [22]. The networking requirements of passive application level tracing can easily be met by our available networking infrastructure.
B. Storage Requirements
The storage requirements of our tracing methodology were assessed during the gathering of a single-connection Ultrapeer trace of the Gnutella network, conducted over a period of one month. Experimental results are shown in Figure 3.
The storage requirements of tracing the Gnutella network using MySQL’s standard data compression range from a minimum of 40MB per day to a maximum of 95MB per day. While this makes long-term tracing feasible using standard desktop storage hardware, available storage capacity still forms the bottleneck in our tracing capability and for this reason, only one tracing connection per monitored network will be maintained by the Open Tracing System for the immediate future.
Storage Requirements of Tracing 0 10 20 30 40 50 60 70 80 90 1 00 Day 01 Day 03 Day 05 Day 07 Day 09 Day 11 Day 13 Day 15 Day 17 Day 19 Day 21 Day 23 Day 25 Day 27 M e g a b y te s QUERYHIT QUERY PONG
Figure 3. Storage Requirements of Tracing
C. Anonymization
As previously discussed, the anonymization approach used is a compromise between storing large volumes of user records and providing a consistent GUID to support session tracking. During our month long trace of the Gnutella network, we performed a number of experiments to determine an optimal IP discard time.
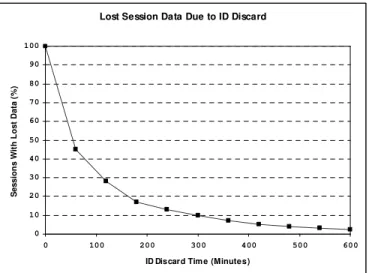
We first monitored session lengths across our trace and found that more than half lasted less than one hour and that more than 80% less than two hours, this is commensurate with results obtained elsewhere [11]. Figure 4 shows the relationship between IP discard time and the percentage of sessions where any data would have been lost.
Lost Session Data Due to ID Discard
0 10 20 30 40 50 60 70 80 90 100 0 100 200 300 400 500 600
ID Discard Tim e (Minutes)
S e s s io n s W it h L o s t D a ta ( % )
Figure 4. Effect of ID Discard Period on Lost Session Data
The ‘long tail’ of the graph shown in Figure 5 is due to the presence of a small number of highly available peers with server-like characteristics and implies that total session coverage would require an unfeasibly long ID-discard period, in turn leading to the maintenance of very large numbers of IP addresses.
Effect of ID discard time on Stored IDs
0 200 400 600 800 1000 1200 1400 1600 1800 1 3 5 7 9 11 13 15 17 19 21 23 25 27 Day of Trace S to re d I P A d d re s s t = 10 t = 8 t = 6 t = 4 t = 2
Figure 5. Effect of Discard-Period on Number of Stored IPs
Figure 5 explores the relationship between discard time and the number of IPs stored by the system. The graph shows that the number of stored IP’s varies significantly over the period of our trace and based upon the discard time used.
Based upon these results, we have selected a discard time of 6 hours. This period successfully captures 93% of sessions as shown in Figure 5 and results in the open tracing system storing an average of fewer than 800 IP addresses at any one time as shown in Figure 6.
VI. SUMMARY AND FUTURE WORK
This paper has highlighted significant shortcomings in the existing body of work on P2P monitoring, and described the implementation of a large-scale, open and ongoing trace that can be freely accessed by researchers from diverse backgrounds. Based upon an extensive review of existing P2P studies, we have selected a non-invasive tracing methodology that we will incrementally apply to five of today’s most popular P2P file sharing networks. At the current time, tracing functionality has been implemented for the Gnutella network and evaluation of the system shows that our methodology is capable of gathering, anonymizing and logging Gnutella traffic in real-time using standard desktop hardware. The system facilitates access for users from diverse backgrounds- a direct interface to the SQL database allows versatile access for computing researchers, while a simplified web interface and on-the-fly computation of common P2P characteristics such as the level of ‘free riding’ and relative file-type popularity facilitate access for those from non-computing fields.
In the short term, future work will focus on the implementation of tracing functionality for additional P2P systems. In the longer term we intend to investigate incorporating Natural Language Processing mechanisms into the system to allow the user to perform more sophisticated analyses. In addition to this we will also examine the feasibility of using technologies such as Aspect Oriented Programming to assist in the non-invasive monitoring of P2P systems, and also to investigate alternative, more scalable data storage solutions.
In parallel to extending tracing support, we intend to evaluate the usefulness of the system as a tool, using a number of case studies. Part of this will include working with psychology researchers to investigate the process of group formation in P2P communities. This will build upon our previous work [9] and allow us to explore the extent to which the system can support inter-disciplinary research. External organisations have also expressed interest in using the system, in particular the U.S. Patents Office who are interested in investigating the extent to which users accidentally share private files. Feedback from these case studies will help inform further refinement of the system.
REFERENCES
[1] Napster: www.napster.com
[2] “An Analysis of Internet Content Delivery Systems”, Saroiu S., Gummadi K., Dunn R. J., Gribble S. D., Levy H. M., published in the proceedings of the 5th International Symposium on Operating Systems Design and Implementation (OSDI), San Francisco, CA, December 2004.
[3] “Measurement, Modeling and Analysis of a P2P File-Sharing Workload”, Gummai K., Dunn R. J., Saroiu S., Gribble S. D., Levy H. M., Zahorjan J., published in the proceedings of the 19th symposium on Operating Systems Principles (SOSP’03), Bolton Landing, New York, October 2003.
[4] “Free Riding on Gnutella Revisited: the Bell Tolls?”, Hughes D., Coulson G., Walkerdine J., published in IEEE Distributed Systems Online, volume 6, number 6, Junel2005.
sdl2.computer.org/comp/mags/ds/2005/06/o6001.pdf
[5] “Monitoring Challenges and Approaches for P2P File Sharing Systems”, Hughes D, Walkerdine J., Lee K., in the proceedings of the 1st International Conference on Internet Surveillance and Protection (ICISP’06), Cap Esterel, France, August 2006.
[6] “Napster Traffic Measurement”, Plonka D., University of Wisconcin-Madison, March 2000, available online at: http://net.doit.wisc.edu/data/Napster
[7] “Free Riding on Gnutella”, Adar, E., Huberman, B., First Monday, October 2000, available online at: www.firstmonday.org/issues/issue5_10/adar/
[8] “Free Riding on Gnutella Revisited: the Bell Tolls?”, Hughes D., Coulson G., Walkerdine J., published in IEEE Distributed Systems Online, vol. 6, no. 6, June 2005. csdl2.computer.org/comp/mags/ds/2005/06/o6001.pdf
[9] “Is Deviant Behaviour the Norm on P2P File Sharing Networks?”, Hughes D., Gibson S., Walkerdine J., Coulson G., in press in IEEE Distributed Systems Online,
vol. 7, no. 2, February 2006.
csdl.computer.org/comp/mags/ds/2006/02/o2001.pdf
[10] “Mapping the Gnutella network”, Ripeani M., Iamnitchi A., Foster I., published in IEEE Internet Computing., vol. 6, no. 1, pp. 50-57, Jan. 2002.
[11] “Measuring and Analyzing the Characteristics of Napster and Gnutella Hosts”, Saroiu S., Gummadi K., Gribble S. D., published in Multimedia Systems 9, pp 170-184, 2003.
[12] “Availability and locality measurements of peer-to-peer file systems”, Chu J., Labonte K., Levine N., published in ITCom: Scalability and Traffic Control in IP Networks. July 2002, vol. 4868 of Proceedings of SPIE.
[13] “The Gnutella Protocol Specification v0.6”: rfc-gnutella.sourceforge.net/src/rfc-0_6-draft.html
[14] “Kazaa”: www.kazaa.com
[15] “eDonkey”: www.edonkey2000.com
[16] “Direct Connect”: dcplusplus.sourceforge.net
[17] “Bittorrent”: www.bittorrent.com
[18] “Jtella”: jtella.sourceforge.net
[19] “Open DirectConnect” sourceforge.net/projects/odc/
[20] “Azureus” azureus.sourceforge.net/
[21] “Is P2P Dying or Just Hiding?”, Karagiannis, T., Broido, A., Brownlee, N., Faloutsos, M., In the Proceedings of Globecom 2004, Dallas, U.S., December 2004.
[22] “Structured and Unstructured Overlays Under the Microscope - A Measurement-based View of Two P2P Systems That People Use”, Qiao Y., Bustamante F.E., published in the Proceeding of the USENIX Annual Technical Conference, Boston, USA, May 2006.