A DESCRIPTIVE, SURVEY RESEARCH STUDY OF THE STUDENT CHARACTERISTICS INFLUENCING THE FOUR THEORETICAL SOURCES OF
MATHEMATICAL SELF-EFFICACY OF COLLEGE FRESHMEN
____________________________________ DISSERTATION
_____________________________________
A dissertation submitted in partial fulfillment of the requirements for the degree of Doctor of Philosophy in the
College of Education at the University of Kentucky
By
Tonja Motley Locklear Lexington, Kentucky
Co-Directors: Dr. Margaret J. Mohr-Schroeder, Assistant Professor of Mathematics Education
and Dr. Carl W. Lee , Professor of Mathematics Lexington, Kentucky
ABSTRACT OF DISSERTATION
A DESCRIPTIVE, SURVEY RESEARCH STUDY OF THE STUDENT CHARACTERISTICS INFLUENCING THE FOUR THEORETICAL SOURCES OF
MATHEMATICAL SELF-EFFICACY OF COLLEGE FRESHMEN
The Sources of Middle School Mathematics Self-Efficacy Scale (Usher & Pajares, 2009) was adapted for use in this study investigating the impact that gender, race, sexual orientation, hometown location (rural, suburban, or urban), high school GPA, college GPA and letter grade of a mathematics course in the previous semester had on the four sources of mathematical self-efficacy of 102 college freshmen attending three small, private, liberal arts institutions. Even though this study found no interaction effects between the student characteristics, the four sources of mathematical self-efficacy, or the three subcategories of the vicarious experience construct, this study did find statistically significant results for several independent variables: gender, hometown environment, and the letter grade received in the mathematics course the preceding semester at the Bonferroni correction rate of .025. Additionally, small p-values for race and hometown environments warrant further investigation with a larger sample size.
KEYWORDS: Sources of Mathematical Self-Efficacy, Self-Efficacy, Mathematical Self-Efficacy, Mathematics Education, Post-secondary Education
Tonja Motley Locklear
A DESCRIPTIVE, SURVEY RESEARCH STUDY OF THE STUDENT CHARACTERISTICS INFLUENCING THE FOUR THEORETICAL SOURCES OF
MATHEMATICAL SELF-EFFICACY OF COLLEGE FRESHMEN
BY
Tonja Motley Locklear
Margaret J. Mohr-Schroeder, Ph. D. Co-Director of Dissertation Carl W. Lee, Ph. D. Co-Director of Dissertation Robert Shapiro, Ph. D. Director of Graduate Studies
I would like to dedicate this work to my wonderful children, Hannah and Peyton, who had to suffer through my frustrations, lack of quality time,
and stressful deadlines. May you both realize that nothing is impossible as long as you have the support of loving family and friends,
iii
ACKNOWLEDGEMENTS
Even though this paper was my own work, it would not have been possible without the support and guidance of many people:
ACCLAIM Doctoral Program Coordinators and Professors – Without this particular program offered by the collaboration of many outstanding professors from five universities, I would NEVER have had the opportunity to fulfill my dream. THANK YOU for your innovation and dedication to education!
ACCLAIM Cohort III – Without your own stories, experiences, knowledge and support, my understanding of mathematics teacher education would not have evolved. THANK YOU for making me a stronger mathematics educator!
Study Buddies – Without your support and encouragement throughout each of the 5-week summer sessions, as well as all of the online courses, I would not have felt as confident to press forward. Each of you has exemplified courage, strength and friendship through your own personal obstacles and setbacks. THANK YOU for always being there to listen! Dr. Margaret Schroeder and Dr. Carl Lee – Without your guidance and support as ACCLAIM professors and co-chairs of my dissertation committee, I would not have felt as prepared and confident during my defense. I hope you will forgive my tireless need to press forward, which may have rocked the boat on occasion. THANK YOU for your support and encouragement throughout this strenuous process!
Dr. Kenneth Tyler and Dr. Jennifer Wilhelm – Without your additional guidance and knowledge, I would not have focused on generating such a comprehensive study. Your questions and discussions during my qualifying examination and my proposal defense created additional layers of my knowledge of self-efficacy and my study of its sources. THANK YOU for illuminating the areas that needed more investigation!
Mom and Dad – Without your support, encouragement, and love, I would not have been able to accomplish this goal. Knowing that I could always count on you to watch the children provided such a peace of mind that allowed me to focus on the work at hand. THANK YOU for providing the foundation during my childhood that said that hard work will allow you to accomplish your goals!
My Husband – Without your understanding and support during this past year, I would not have been able to complete my dissertation. You allowed me to spend COUNTLESS hours working on “this little paper” without MUCH complaining during our FIRST year of marriage. Your support and love has meant so much to me. THANK YOU for allowing me the space to complete my professional dream!!!!
iv
TABLE OF CONTENTS
ACKNOWLEDGEMENTS ... iii
LIST OF TABLES ... vi
LIST OF FIGURES ... vii
Chapter I: Introduction ... 1
Theoretical Framework ... 2
Self-Efficacy ... 2
Sources of Self-Efficacy ... 3
Statement of the Problem ... 4
Purpose of the Study ... 5
Research Question ... 5
Significance of the Study ... 6
Definition of Terms ... 6
Assumptions ... 7
Limitations ... 7
Organization of the Study ... 8
Chapter II: Review of Literature ... 9
Mathematical Self-Efficacy ... 9
Sources of Mathematical Self-Efficacy ... 13
Mastery experience ... 14
Vicarious experience ... 16
Verbal and social persuasion ... 19
Physiological and emotional states ... 20
Conclusion ... 20
Chapter III: Methodology ... 23
Research Design ... 23
Population and sample ... 23
Instrumentation ... 25
Pilot study ... 28
Procedures ... 28
Data Analysis ... 30
Measures ... 30
Statistical analysis ... 31
Validity ... 33
Chapter IV: Results and Analysis ... 35
Missing Data ... 35
Demographics ... 36
Data Screening ... 36
v
Data Analysis ... 44
Descriptive statistics ... 44
Effect sizes, power, and Type I error value ... 45
Mean differences ... 46
Conclusion ... 61
Chapter V: Discussion, Conclusions and Implications ... 63
Factors Influencing Sources of Mathematical Self-Efficacy ... 63
Gender ... 63
Race ... 64
Hometown environment ... 66
High school GPA ... 67
College GPA ... 67
Mathematics course grade ... 68
Sexual orientation ... 69
Discussion ... 69
Conclusion ... 73
APPENDICES APPENDIX A Custom Listings Categories and Selections for the Research Study ... 75
APPENDIX B Letter to Students ... 76
APPENDIX C Research Survey ... 77
References ... 80
vi
LIST OF TABLES
Table 4.1 Descriptive statistics for the seven dependent variables ...44 Table 4.2 2x2x3 Factorial ANOVA on Mastery Experience with student
characteristics as independent variables ...48 Table 4.3 3x4x4 Factorial ANOVA on Mastery Experience with performance
variables as the independent variables ...49 Table 4.4 2x2x3 Factorial ANOVA on the dependent variable, vicarious experience,
with student characteristics as independent variables ...51 Table 4.5 3x4x4 Factorial ANOVA on the dependent variable, vicarious experience,
with performance variables as the independent variables ...52 Table 4.6 2x2x3 Factorial ANOVAs on the dependent variable, verbal and social
persuasions, with the student characteristics as the independent variables ...53 Table 4.7 3x4x4 Factorial ANOVA on the dependent variable, verbal and social
persuasions, with the performance variables as the independent variables ...54 Table 4.8 2x2x3 Factorial ANOVA on the dependent variable, physiological and
emotional states, with the student characteristics as the independent variable ...55 Table 4.9 3x4x4 Factorial ANOVA on the dependent variable, physiological and
emotional states, with the performance variables as the independent variables ....56 Table 4.10 2x2x3 Factorial ANOVA on the dependent variable, vicarious experience
– adult role models, with the student characteristics as the independent
variables ...57 Table 4.11 3x4x4 Factorial ANOVA with the dependent variable, vicarious
experience – adult role models, with the performance variables as the
independent variables...57 Table 4.12 2x2x3 Factorial ANOVA with dependent variable, vicarious experience
– peer role model, with student characteristics as the independent variables ...58 Table 4.13 3x4x4 Factorial ANOVA with the dependent variable, vicarious
experience – peer role model, with performance variables as the independent variables ...58 Table 4.14 One-Way ANOVA on the dependent variable, vicarious experience self
role model, with the independent variable, gender ...60 Table 4.15 One-Way ANOVA on the dependent variable, vicarious experience self
role model, with the independent variable, race ...60 Table 4.16 One-Way ANOVA on the dependent variable, vicarious experience self
role model, with the independent variable, hometown environment ...60 Table 4.17 3x4x4 Factorial ANOVA with the dependent variable, vicarious
experience with self role model, with the performance variables as the
vii
LIST OF FIGURES
Figure 4.1 Sexual Orientation Demographics ... 36
Figure 4.2 High School GPA Demographics (HSGPA) ... 37
Figure 4.3 College GPA Demographics (COLGPA) ... 37
Figure 4.4 High School GPA Demographics Reorganized (HSGPA2) ... 38
Figure 4.5 College GPA Demographics Reorganized (COLGPA2) ... 38
1
Chapter I: Introduction
Since the emergence of self-efficacy as a component of Albert Bandura’s social cognitive theory in 1977, much research has been conducted on how this construct affects learning. Similarly, with the emergence over the past 30 years of mathematics being a significant subject of discussion in education and politics as seen by publications such as Nation at Risk, NCTM’s Principles and Standards for School Mathematics, No Child Left Behind, and more recently the, Common Core State Standards Initiative much research has been directed towards understanding and improving the mathematical achievement of United States’ students. It is no surprise then that these two areas of research have
resulted in many studies focusing on the effects of self-efficacy on mathematics achievement. Consequently, the research has shown in school mathematics that
“perceived self-efficacy contributes to academic performance irrespective of the level of intellectual ability, and correlates strongly with academic outcomes, such as performance in problem solving, attitudes towards mathematics and math anxiety” (Michaelides, 2008, p. 222).
2
Ponton, 2005). If the issues regarding self-efficacy and mathematics achievement are not resolved during the K-12 years, then those same issues will be found on the collegiate level and may become worse by the increase in stress associated with freshmen students.
In Pajares’ (1996) review of the educational research of academic self-efficacy, he acknowledged the sound connection between self-efficacy and academic performances and achievement established through abundant research. Since this connection has been well established, the focus needs to shift toward research on how to enhance students’ level of self-efficacy through various sources of information. Lent, Lopez, Brown and Gore (1996) determined through confirmatory factor analysis that the four theorized sources of mathematical self-efficacy represent different types of information and, therefore, can be analyzed separately. Additionally, they posited the need “to clarify how the efficacy sources are structured in other populations and performance domains and whether the theoretical distinctions among the sources can inform interventions aimed at modifying self-efficacy percepts” (Lent et al., 1996, p. 306).
Theoretical Framework
Self-Efficacy. Self-efficacy is a component of Albert Bandura’s social cognitive theory and is referred to as the “beliefs in one’s capabilities to organize and execute the courses of action required to produce given attainments” (Bandura, 1997, p. 3). Thus, the mathematical self-efficacy of students is their belief about their capabilities to control the outcome regarding their mathematical performance. For this research study the definition of mathematical self-efficacy will be “the level of an individual’s belief in his/her
3
Such beliefs influence the courses of action people choose to pursue, how much effort they put forth in given endeavors, how long they will persevere in the face of obstacles and failures, their resilience to adversity, whether their thought patterns are self-hindering or self-aiding, how much stress and depression they experience in coping with taxing environmental demands, and the level of accomplishments they realize. (p. 3)
Hence, students with higher levels of mathematical self-efficacy will exert more effort, maintain their desire to persevere, and continue working towards successful results in their mathematics classes. Basically, what students believe they can or cannot accomplish is a driving force for them to actualize that success or failure.
Sources of Self-Efficacy. All self-efficacy judgments, including mathematical self-efficacy, are based on how each person processes various pieces of information. According to Bandura (1997), this cognitive processing takes place in two distinct steps. The first step involves which type of information a person uses in the process. The second step involves the amount of importance a person attributes to the various types of information. Bandura theorized that self-efficacy is formed through the cognitive
processing of four sources of information: mastery experiences, vicarious experiences, verbal and social persuasions, and physiological and emotional states.
4
into three subsections. Verbal and social persuasions refers to the cognitive processing of the faith, or lack thereof, others have in an individual’s abilities. The knowledge and credibility of the other person makes a difference in the level of influence of this source of self-efficacy. Finally, physiological and emotional states refers to the cognitive processing of an individual’s capabilities based on somatic information. Anxiety is a common somatic indicator associated with mathematics, which may affect how efficacious a person feels toward mathematics success (Bandura, 1997).
Statement of the Problem
Post-secondary education faces multiple challenges in providing the best environment to assist students from matriculation to graduation. Mathematics has been one area of contention with college students for years. “Knowing how to build a sense of efficacy and how it works provides further guidelines for structuring experiences that enable people to realize desired personal and social changes” (Bandura, 2006, p. 319). In order to create the experiences to enhance the mathematical self-efficacy of college students, more information is needed on how the different sources of self-efficacy impact various people and/or groups of people.
Bandura (1997) posited that mastery experience is the strongest source of self-efficacy, but Stevens et al. (2004), stated that previous mathematics achievement
(mastery experience) influenced the self-efficacy of Hispanic students in their study, but did not have a statistically significant impact on the Caucasian students. However, they used the students’ self-reported prior mathematics grades to represent the mastery
5
conducted research claiming to analyze one or more of the sources of self-efficacy without using a calibrated assessment tool specifically designed for those sources of mathematical self-efficacy or have deviated from the tenets of the theory. A thorough study of the sources of mathematical self-efficacy and their influence on various groups of college students utilizing a valid and calibrated assessment tool is needed to enhance and further this research.
Purpose of the Study
The purpose of this descriptive, survey research study was to determine which student characteristics (race, gender, sexual orientation and hometown location) influence the sources of mathematical self-efficacy of college freshmen, if any, utilizing a valid assessment tool aligned with the tenets of the self-efficacy theory.
Research Question
This research study investigated the four sources of mathematical self-efficacy of college freshmen. More specifically it addressed the following research question: What student characteristics influence the four sources of mathematical self-efficacy, if any?
6
while strengthening another. The overlapping of environmental, personal and behavioral aspects within each person makes the sources of mathematical self-efficacy construct harder to analyze.
Significance of the Study
Although self-efficacy has been broadly researched over the past 30 years since Bandura introduced the construct (Pajares, 1997), little research has been conducted on the impact of the sources of mathematical self-efficacy on groups of college students based on gender, race, sexual orientation and hometown location (rural, urban or
suburban). Moreover, the research on the sources of mathematical self-efficacy has been inconsistent because of the manner in which the sources have been “operationalized and assessed” (Usher & Pajares, 2009, p. 90). This study will contribute to the literature on the sources of mathematical self-efficacy by examining the impact of student
characteristics on the construct using a valid assessment scale. Definition of Terms
The following is a list of terms and definitions that will be used throughout this study.
Mathematical Self-Efficacy – the level of an individual’s belief in his/her competence to attain a favorable outcome regarding their mathematical performance
7
Vicarious Experiences – cognitive processing of competence generated by the comparisons of oneself with others (adult, peer or self-generated role models)
Verbal and Social Persuasions – cognitive processing of competence generated by verbal and social encouragement or discouragement of others
Physiological and Emotional States – cognitive processing of competence generated by an individual’s emotions or physiological state
Assumptions
1. The participants provided accurate demographic information on the surveys. 2. The participants were honest and reflective in their responses to the survey
questions.
3. All of the participants were accessible by email.
4. The email address provided by the college was accurate. 5. The intended recipient actually answered the survey only once. Limitations
Since it was not possible to survey all freshmen–level college students in small, private, 4-year institutions, this study was limited to the students enrolled in three universities selected through a customized list of institutions based on the Carnegie Foundation Classification system. The study consisted of 106 college freshmen students attending small, private institutions. Based on the three institutions that chose to
8
Furthermore, even though the four theorized sources of mathematical self-efficacy address distinct sources of information, and therefore, can be analyzed separately (Lent, Lopez, Brown, & Gore, 1996), the overlapping of environmental, personal and behavioral aspects within each person makes the sources of mathematical self-efficacy construct harder to analyze.
Organization of the Study
This research study is organized into five chapters, a bibliography, and appendices as follows:
Chapter I: Introduction
Chapter II: Review of Literature Chapter III: Methodology
Chapter IV: Results and Analysis
Chapter V: Discussion, Conclusions, and Implications
The first chapter provides introductory information for this dissertation study, including the purpose and significance of the study. The second chapter provides the review of the literature pertinent to this dissertation, including mathematics self-efficacy and sources of mathematics self-efficacy. The third chapter provides the research design of this
dissertation and the methodology for conducting the research. The fourth chapter of the dissertation explains the data analysis and results from the study. The final chapter provides a discussion of the findings and their implications, as well as recommendations for future research.
9
Chapter II: Review of Literature
This chapter contains the review of the relevant literature for this dissertation. Bandura (1997) refers to the multifaceted aspect of self-efficacy when describing the manner in which one should try to measure this particular construct. A person can have a high sense of efficacy in regard to one particular situation and a low sense of self-efficacy regarding another. Since the level of self-self-efficacy is dependent on the particular aspects surrounding the topic, then it is important to delineate the specific construct being studied and the particular parameters regarding the study in order to ascertain the most reliable analysis (Bandura, 1997). This plays a significant role in the analysis of research studies pertaining to self-efficacy. Literature focusing on mathematical self-efficacy and the sources of mathematical self-efficacy is investigated for this research study with attention to the tenets of Bandura’s social cognitive theory.
Mathematical Self-Efficacy
Wadsworth, Husman, Duggan, and Pennington (2007) investigated which of the constructs (self-efficacy, attitude, motivation, time management, anxiety, concentration, information processing, selecting main ideas, use of supporting materials, testing
strategies and self-testing) impact student success when instruction is provided in an online learning environment. They found that the success of students (89 out of 511 self-selecting to participate) participating in an online developmental mathematics course was due, in part, to mathematical self-efficacy, motivation, concentration, information
10
achievement score may not speak to the actual ability of the students. Additionally, they reported that the self-efficacy of students taking online classes was not substantially different than from students who took a traditionally delivered course. However, the self-efficacy survey questions were only given to students who took a course online and the survey described was not a known, calibrated assessment of self-efficacy. Thus, this generalized statement has no merit within the confines of the research study.
Spence & Usher (2007) attempted to determine how motivation variables, mathematics self-efficacy and a particular computer courseware (MyMathLab) affected student achievement. Their study included 164 students who were enrolled in either one of the eight sections of traditionally taught courses or one of the eight sections of online courses at a particular university and who completed both surveys and took the final exam. The final exam was the assessment tool for determining mathematics achievement, because all students were required to take this 40-item multiple-choice departmental test. Even though Spence and Usher acknowledged the use of Bandura’s Guide for
Constructing Self-Efficacy Scales as their reasoning for the questions used within the surveys to assess self-efficacy, the survey was not a known, calibrated measure.
Spence and Usher (2007) found that the mathematics self-efficacy was higher in those enrolled in the traditional courses than those in the online courses. The students in the traditional courses also scored higher on their final exams. When researchers
11
the strongest predictor of achievement. However, there were some validity issues that need to be considered within the context of this study. Those students taking courses online were required to take a written mathematics test. This change in assessment style from computerized to written may account for the poorer scores on the final exam. Additionally, those students enrolled in the traditional courses were allowed to use MyMathLab courseware as a supplement, which could confound the results of the achievement assessment.
Hall and Ponton (2005) focused on the comparison of the mathematics self-efficacy of freshmen students taking developmental mathematics courses with those taking Calculus I. After hypothesizing that participation in the study would have no positive or negative effect on the students’ grade for the semester, 80 students within the four Calculus I sections and 105 students within the four developmental sections agreed to participate. The students were given two subscales (Mathematics Tasks subscale and Mathematics Courses subscale) of the revised Mathematical Self-Efficacy Scale (MSES), which produced their overall self-efficacy score. Using an independent t-test and an ANOVA, the results showed a statistically significant difference between the
12
Hailikari, Nevgi and Komulainen (2008) investigated the connection of prior knowledge and academic self-beliefs (combination of expectations of success,
mathematical self-efficacy, and self-perception of mathematical ability) on mathematics achievement with participants who were mathematics students in a required
undergraduate mathematics class where 67% were first-year students. Instead of using a known, calibrated self-efficacy scale, Hailikari et al. used nine statements to assess academic self-beliefs. Three of the statements were used to measure expectations of success, four measured self-efficacy and two items, created by them solely for this study, measured self-perceptions of mathematics ability. Prior knowledge was measured using six mathematical problem solving tasks using mathematics skills that were considered required skills of students before the beginning of the course. Student achievement was measured by the final grade in the course. They found that prior knowledge predicted a student’s academic achievement over all of the other variables.
Within the statistical analysis of the study, Hailikari et al. (2008) described the procedure they used to impute the missing values of 21 final grades using different statistical programs, because the data were considered missing at random. They determined that the different methods produced basically the same results, which were then used to supply the overall academic achievement score for those students. However, imputing 21 out of 139 (15%) of the student’s overall achievement variable does not promote confidence in the results of the final analysis.
13
mentioned the necessity of measuring self-efficacy specifically and within a close time frame of the mathematics achievement measure. The authors specifically mention this limitation but explained that this microanalysis was not suitable for their particular research study on whether self-beliefs more generally predicted student achievement. This strategy, coupled with the fact that academic self-beliefs were measured together to produce the key finding that prior knowledge predicted student achievement over all other variables, makes this result seem less reliable.
The articles mentioned in this section of the literature review indicate the necessity of analyzing the mathematical self-efficacy of students based on the tenets established by Bandura (1997) through a known and calibrated assessment scale. When attention is not given to the tenets of the social cognitive theory, conflicting results can arise. Wadsworth, et al. (2007) determined that the mathematical self-efficacy of students within a traditional or online course was basically the same, but Spence and Usher (2007) found the mathematical self-efficacy of the students in the traditional course to be higher than those in the online course. Hailikari, et al. (2008) completely disregarded Bandura’s warning of analyzing the construct within a close proximity of the assessment of the academic achievement variable, which creates a very unreliable conclusion that mathematical self-efficacy was not as influential as prior knowledge on mathematical achievement. The following section on the sources of mathematical self-efficacy continues this analysis based on the tenets of the social cognitive theory.
Sources of Mathematical Self-Efficacy
14
been examined in many academic settings by a variety of methods. When trying to analyze the research on the sources of self-efficacy, the assessment tool and the particular source play an important role in the reliability of the study. The following part of the literature review focuses on evaluating and critiquing research studies with regards to each individual source of self-efficacy.
15
Luzzo et al. (1999) conducted their study with four treatment conditions analyzed with pre- and post-test assessments of mathematics/science self-efficacy. The treatment groups consisted of participants taking a test of incomplete number series to enhance the performance or mastery experience source, the participants watching a 15-minute video of two successful graduates with similar backgrounds and stories to enhance the vicarious experience source, participants performing a combination of the two, and a control group with no intervention. The study determined that the performance accomplishment
treatment had a statistically stronger impact on the participants than the videos of adult models. However, just viewing fifteen minutes of videos of successful strangers may not constitute the idea of a genuine role model with which to enhance self-efficacy through vicarious means. In addition to the treatment modes, the assessments occurred three times (pre-, post-, and immediately after the treatment) and the final two were only four weeks apart. This posed a test/retest threat to the internal validity of the study.
16
the four theorized sources, as well as other emerging categories such as interest, effort, teacher quality, etc. Their analysis consisted of determining the percentage of comments per category. This study determined that personal performance (mastery experience) accounted for 58% of the responses. However, when focusing on the specifics of obtaining a B or better in a mathematics course, it is understandable that the responses related to confidence would fall more often within the performance category. Even though the qualitative nature of this study provides data that supports the methodological basis of the four sources of mathematical self-efficacy and retrieves the data in a manner that is underutilized within this specific field of the social cognitive theory, the types of questions in the written section may have lead to skewed responses towards performance criteria.
Not only has the mastery experience construct been analyzed within research studies by specific quantitative scales (Lent, Lopez, & Bieschke, 1991; Lent, Lopez, Brown, & Gore, 1996; Usher & Pajares, Sources of self-efficacy in mathematics: A validation study, 2009), other studies have used prior grades, successful completion of number series and a thought-listing analysis to provide evidence of the influence of the mastery experience source over the other sources. Even though the variety of methods corroborate Bandura’s belief that mastery experience is the most influential source of self-efficacy, researchers must still analyze the construct in a manner consistent with the tenets of the theory.
17
Matsui, & Ohnishi, 1990). Usher and Pajares (2009) contend that the lower coefficient alphas may be caused by research studies focusing on only peer or adult models, but not both. However, some research studies (e.g., Hodges & Murphy, 2009; Zeldin & Pajares, 2000) found the vicarious experience construct to be most influential.
Even though Zeldin & Pajares (2000) focused their research on 15 women who were already involved in careers within the STEM (Science, Technology, Engineering and Mathematics) areas, this qualitative study seemed appropriate to include within this review. The interviews of the women revealed that their vicarious experiences and their verbal and social persuasions were highly influential in their success within the STEM career paths. Since the women were interviewed after establishing careers in the STEM areas, mastery experience, which is posited by Bandura (1997) to be the most influential source of information, may not be as relevant to them in retrospect. The grades and the academic accomplishments may fade over time; whereas, the personal connections and encouragement may grow stronger.
The sample of women was purposive for this study and had to meet the requirements selected by the researchers. Each interview consisted of the same nine questions and was recorded and transcribed verbatim. The researchers explained how they tried to account for internal validity by having other colleagues with familiarity of educational issues, but not self-efficacy theory, read through the transcripts and
determine if other themes emerged from the data.
18
graduating when obstacles would try to deter them. The purposeful sample and the small sample size did not allow for generalizability. However, being able to interview these women after navigating through the academic world and emerging with a career in a STEM area provided additional insight into how self-efficacy could play a significant role in not only academic achievement but also within academic and life-long success.
Hodges & Murphy (2009) conducted a study to explore the sources of self-efficacy of students enrolled in a technology-intensive asynchronous college algebra course. The Sources of Mathematics Self-Efficacy (SMSE) scale developed by Lent et al. (1991) was used to determine the scores for the four theoretical sources, which were used as predictor variables within the study. The dependent variable was the Self-Efficacy for Learning Mathematics Asynchronously survey developed by Hodges (2008). The regression analysis showed that vicarious experiences and physiological/affective states were the only two statistically significant predictors. It seems reasonable that how a student feels throughout the duration of taking an asynchronous course would have a significant impact on how efficacious he/she is about learning in an asynchronous
environment. Additionally, learning in a non-traditional environment could be influenced by the successes of other students who have taken similar courses asynchronously. Since the dependent variable pertains to the self-efficacy of learning mathematics
19
Since the vicarious experience construct has had low to modest Cronbach’s alpha reliability coefficients in research studies , (Hodges & Murphy, 2009; Lent, Lopez, & Bieschke, 1991; Lent, Lopez, Brown, & Gore, 1996; Matsui, Matsui, & Ohnishi, 1990) it is important to determine a way of assessing this source of mathematical self-efficacy that will not only be consistent with the tenets of the theory but also will provide a more consistent measure. Zeldin and Pajares (2000) were able to obtain results of the
influential impact of the vicarious experience construct on the women in their study through an interview process. Qualitative studies may provide a more informative
measure of this construct because it does not restrict the role models to only adults, peers, or teachers. Students are influenced by other role models in society as well, but the research on the sources of self-efficacy does not usually include those options.
Verbal and social persuasion. Verbal and social persuasion has been studied by researchers focused on encouragement by teachers, parents and friends (Hodges & Murphy, 2009; Lent, Lopez, Brown, & Gore, 1996; Matsui, Matsui, & Ohnishi, 1990). Encouraging statements were extremely evident in the stories told by the women with careers in STEM areas in the qualitative study by Zeldin & Pajares (2000). The
encouragement was described with regards to not only mathematics but also a confidence that others believed they could succeed in anything. Those encouraging words
20
researchers have yet to analyze the persuasiveness of the message sent by communities, public figures, media, or society as a whole (Usher & Pajares, 2008).
Physiological and emotional states. The physiological and emotional states have been assessed in many mathematical research studies as anxiety (Hodges & Murphy, 2009; Lent, Lopez, & Bieschke, 1991; Lent, Lopez, Brown, & Gore, 1996), because all of the instruments were using variations of the Fennema-Sherman Math Anxiety Scale as revised by Betz (1978). Other researchers (Matsui et al., 1990; Zeldin & Pajares, 2000) asked students to assess this construct by thinking of how mathematics made them feel. In the thought-listing analysis by Lent, Brown, Gover, and Nijjer (1996), responses were categorized within this construct based on statements of fear, such as “math frightens me.” However, it was only responsible for 9% of the responses mentioned by the
participants. As mentioned earlier, Hodges and Murphy (2009) found physiological states and vicarious experiences were the only two sources that could statistically significantly predict the self-efficacy of learning mathematics asynchronously. Usher & Pajares (2009) contend that “[a]lthough one’s feelings of anxiety may be the most salient form of
psychological arousal in the classroom, particularly in the domain of mathematics, a measure that includes other forms such as physical arousal and mood would be more faithful to Bandura’s (1997) description of this source” (p. 91).
Conclusion
21
face of setbacks resulting from those difficult tasks (Bandura, 1997). Thus, teachers of developmental courses, and more specifically freshmen courses, may want to consider the self-efficacy of students within their courses. They should strive to create a learning environment enabling their students to not only master the mathematics concepts during this transitional year of college, but also to produce students who will become lifelong learners (Hall & Ponton, 2005).
The studies in this literature review exemplify the various ways in which self-efficacy and the sources of self-self-efficacy are measured and how probable it is that research studies could provide conflicting results. Additionally, the measures for self-efficacy need to take into consideration the specificity of the self-efficacy construct when related to specific domains, such as mathematics, and adhere to the suggestions posited by Bandura (1997) when measuring the effects of self-efficacy with the domain specific performance (Usher & Pajares, 2008). Similarly, more research needs to be done on the collegiate level utilizing consistent and calibrated measures appropriately studied in relation to the sources of mathematical self-efficacy.
non-22
traditional students on the collegiate level needs to be done, especially since research, according to Cassazza (as cited in Hall & Ponton, 2005), has shown it to be the fastest growing segment within higher education. Research in these areas will not only add to the knowledge base regarding self-efficacy and the sources of mathematical self-efficacy, but also may provide insight into the types of interventions that would be successful and the areas where those interventions can be applied.
23
Chapter III: Methodology
This chapter describes the methodology used for the descriptive, survey research study. The purpose of this study was to determine which student characteristics (race, gender, sexual orientation and hometown location) influence the sources of mathematical self-efficacy of college freshmen, if any. First, the research design section will define the type of research design, the population and sample, the instrument, and the procedures used for the study. Second, the data analysis section will define all the variables used in the study, as well as describe the statistical analysis process of the study. Finally, the validity section focuses on the reliability and validity of the instruments, as well as the research study as a whole.
Research Design
A descriptive, survey research design was chosen to investigate the four sources of mathematical self-efficacy of college freshmen. More specifically it addressed the following research question: What student characteristics influence the four sources of mathematical self-efficacy, if any?
Population and sample. The target population for this study was college freshmen attending small, private, not-for-profit, 4-year universities. The sample universities were selected using an online filtering process of the Carnegie Foundation Classifications of colleges and universities (Carnegie Foundation). The Carnegie
24
(see Appendix A for the complete list of categories and selected options). The selections were made based on the focus of the research study, which pertained to undergraduates of small, four-year institutions. The selection process resulted in 37 institutions, but seven were eliminated right away by requiring not-for-profit, four-year or above institutions. Since 30 institutions were out of the scope of this research study based on time and resources, the list was processed identically except for selecting only the Very Small institutions. Of the nine universities produced by this selection process, all but three were classified as professions plus arts and sciences with some graduate coexistence. So, those three were eliminated and the remaining six form the target sample used for this research study. (See Appendix A.)
In January 2012 an email was sent to the Dean of Academic Affairs (or comparable position) of each of the six institutions selected through the Carnegie
Foundation classifications process mentioned above. One of the institutions chose not to participate based on a policy within the Registrar’s Office. Two of the institutions made no attempt to communicate with the researcher even after several attempts. After the researcher provided the appropriate information for each of their IRB processes, three of the original six institutions agreed to participate in the study. Since each of the three institutions had some type of religious affiliation, the generalizability of the data to the population may be limited.
25
the researcher for this study. A total of 474 freshmen students were identified as the target population. Each of the 474 freshmen students were sent an email (see Appendix B) containing a brief description of the research study and its importance to the education community, a link containing written acknowledgement of their rights and assurance of privacy regarding their information, and a link to the online survey (see Appendix C) for this research study. Submitting the online survey constituted their consent to participate in the study.
Instrumentation. The sources of mathematical self-efficacy have been analyzed by various means as outlined in the review of literature chapter of this study. However, four specific scales (Lent, Lopez, & Bieschke, 1991; Matsui, Matsui, & Ohnishi, 1990; Ozyurek, 2005; Usher & Pajares, 2009) have been developed and used more consistently within the research. Since this research study focused on analyzing the influence of student characteristics on the four theorized sources of mathematical self-efficacy, it was important to select an instrument that closely aligned with theory and had been validated in other research studies.
26
it as bad, then their grades would not be an accurate indicator of their level of self-efficacy (Usher & Pajares, 2009),
Ozyurek (2005) developed a measurement for the sources of mathematics-related self-efficacy referred to as Math-inform. The Math-inform consisted of only three sources of self-efficacy, because the first factor contained items related to both mastery
experience and social persuasion. It was not apparent as to why those two constructs were combined, as they are theorized by Bandura to represent completely different constructs. Additionally, the instrument used a 4-point Likert scale, which is not sensitive enough to account for the nuances within cognitive processing (Bandura, 2006).
Lent, Lopez and Bieschke (1991) developed a scale to analyze the four sources of mathematical self-efficacy of college students. The 40-item instrument was divided into ten questions per source. All of the sets of questions were designed by them, except for the questions pertaining to the physiological and emotional states. They used the
Fennema-Sherman Math Anxiety Scale revised by Betz (1978) to analyze that particular construct. Even though their instrument is more theoretically aligned than the previous two, the 5-point Likert scale is still not sensitive enough according to Bandura (2006).
27
items to experts within the social cognitive theory field (Bandura, Zimmerman, and Schunk) for feedback. Based on the feedback from the experts more modifications were made, which resulted in an instrument containing 73 items at the beginning of the final phase. However, through revisions based on various types of analysis during the final phase, the official Sources of Middle School Mathematics Self-Efficacy Scale has 24 items consisting of six items per source. Each of the source sections had Cronbach’s alpha reliability coefficients above 0.80 indicating that over 80% of the variance in the total score for each source of mathematical self-efficacy is shared within the six specific items on the scale (Warner, 2008). More specifically, the Cronbach’s alpha coefficients for each source was 0.88 for mastery experience, 0.84 for vicarious experience, 0.88 for social persuasions, and 0.87 for physiological state (Usher & Pajares, 2009).
“Comparing the correlation between the sources measures and self-efficacy outcomes to those obtained in previous research studies of the sources reveals that the measures created in this study are not only sound, but demonstrate greater predictive utility than have past measures” (Usher & Pajares, 2009, p. 97). For this reason, as well as the desire to use a valid and calibrated instrument to help further the research on the sources of mathematics self-efficacy, the Sources of Middle School Mathematics Self-Efficacy Scale was chosen for this research study. It was adapted to be used with college-level freshmen students (see Appendix C) by making two cosmetic changes:
Question #2 – Seeing kids do better than me in math helps me do better in math. (kids was replaced by students.)
Question #10 – I got good grades on my last report card.
28
The Sources of Middle School Mathematics Self-Efficacy Scale used a six-point Likert scale designed for middle school students where the choices were
F
– Definitely False, F– Mostly False, F – A little bit False, T – A little bit True, T – Mostly True, and
T
– Definitely True. The researcher choose to use the exact same Likert scale for this research study, because the choice of false and true seemed more appropriate for the items in the scale than the standard agree and disagree. The Likert scale was converted to a number from 1 to 6, with 1 representing Definitely False and 6 representingDefinitely True.
Pilot study. A pilot study of 20 upperclassmen at a small, liberal arts institution in Virginia was conducted in January 2012 to test the instrument for the research study and to make any necessary adjustments to the instrument and/or the instructions of the instrument. Based on the results of the pilot study, it was evident that students were having trouble inputting their high school and college GPA. Changes in the demographic section of the survey were made to accommodate this situation. Instead of asking students to input their GPA specifically, they were asked to select the radio button that aligned with their GPA (see Appendix C). Even though this changed the nature of the variable from a continuous to discrete variable, the researcher believed it was more important to have those two data items available for analysis than risk losing out on the information altogether.
29
background information and IRB required information and 2) the demographic questionnaire with the 24 - item survey instrument that was adapted for this particular research study for college students from Usher and Pajares’ (2009) Sources of Middle School Mathematics Self-Efficacy Scale. The researcher chose to include the official IRB required information on a separate website rather than within the email sent directly to the students, because many students may not participate if they had to read through a lengthy document to get to the actual survey link. The researcher used www.weebly.com
to design the informational website specifically for this research study.
The survey was created by the researcher using www.snapsurveys.com. This particular survey website was chosen by the researcher for several reasons: 1) her employer had an account with this company, 2) the use of the software was of no cost to the researcher, and 3) the institutional researcher at her place of employment could provide support to questions that may arise in the process of creating the survey
document. Students had access to the survey for three weeks before it was closed and all of the data were transferred to an Excel file and then to a SPSS data file. The researcher sent follow-up emails each week to thank those who had already participated in the survey and to politely encourage others to participate.
Students were given an incentive to participate in the research study. The researcher promised to include the participants in two random drawings for a $50 e-gift card. Since students responses to the survey were not associated with their email
30
immediately separated from the other information and stored in a separate Excel file. The remaining data was used throughout this research study with no link to any of the
participants. Only 79 students provided their email addresses for the random drawing. Using a random number generator, the researcher obtained 62 and 34 as the two winners of the $50 e-gift cards. The researcher sent an email to the participants associated with those email addresses to thank them again for their participation and to inform them of their winnings. Since the researcher allowed the students to submit their responses anonymously, it was not possible to identify the participants based on their institution. Data Analysis
Measures. The following list contains the variables used for this study. Dependent Variables
Mastery Experience (ME) Vicarious Experience (VE)
Verbal and Social Persuasions (VSP) Physiological and Emotional States (PES) Vicarious Experience – Adult models (VEadult) Vicarious Experience – Peer models (VEpeer) Vicarious Experience – Self model (VEself) Independent Variables
Gender (Gender) – Two levels (Male and Female)
Race (Race) – Three levels (African American, Caucasian, and Other) Sexual Orientation (SexOr) – Three levels (Bisexual, Heterosexual, and
31
Hometown Location (Home) – Three levels (Rural, Suburban, and Urban) High School GPA (HSGPA) – Six levels based on grade intervals
College GPA (COLGPA) – Six levels based on grade intervals
Class Grade (grade) – Seven levels based on letter grade received in math class taken previous semester
Statistical analysis. The purpose of this research study was to identify the student characteristics (if any) that might causally influence a student’s score on each of the four sources of mathematical self-efficacy. In other words, the researcher wanted to determine how much variability existed in the means of the sources of mathematical self-efficacy across groups of students (i.e. African American students, Female students, cross-sections of students, etc.). Huck (2000) contends that analysis of variance (ANOVA) ranks first in popularity for applied researchers when comparing three or more means. However, the researcher had to determine which type of ANOVA (one-way, factorial, or multivariate) was appropriate based on the research question and the data collected.
A one-way ANOVA (also referred to as ANOVA) would determine whether there are mean differences in the scores of one of the sources of mathematical self-efficacy based on the groups defined by one of the independent variables (Warner, 2008). In other words, an ANOVA would determine whether the groups formed by gender (male and female) had statistically significant mean differences on the mastery experience
dependent variable. This analysis would be performed in SPSS by selecting ANALYSIS – COMPARE MEANS – ONE WAY ANOVA.
32
2008, p. 315). In other words, a factorial ANOVA would determine whether the combination of gender and race (African American females, Caucasian males, etc.) interact to create statistically significant mean differences on the mastery experience dependent variable. This analysis would be performed in SPSS by selecting ANALYSIS – GENERAL LINEAR MODELS – UNIVARIATE.
The purpose of a multivariate analysis of variance (MANOVA) would be to determine whether groups formed by two or more independent variables had statistically significant mean differences on multiple dependent variables (Warner, 2008). Warner (2008) goes on to state that the null hypothesis of a MANOVA would correspond with “the assumption that when the scores on all p of the Y outcome variables are considered jointly as a set, taking intercorrelations among the Y variables into account, the means for this set of p outcome variables do not differ across any of the populations that correspond to groups in the study” (Warner, 2008, p. 702). In other words, a MANOVA would determine whether the combination of the independent variables interact to create statistically significant mean differences on the dependent variables taking
intercorrelations into account. This analysis would be performed in SPSS by selecting ANALYSIS – GENERAL LINEAR MODELS – MULTIVARIATE.
The researcher chose to begin the analysis by performing a MANOVA using all of the independent and dependent variables to determine if there were any statistically significant differences in the four sources of mathematical self-efficacy taking their intercorrelations into account. Once the MANOVA was not found to have any
33
which can be analyzed separately, the researcher chose to perform factorial ANOVAs for each of the dependent variables. Furthermore, a Confirmatory Factor Analysis (CFA) was conducted to test whether the questions contained within the survey were still
corresponding to the source they were intending to analyze. The CFA was conducted using the AMOS 20 program. All other analyses were conducted using SPSS 20. Validity
Threats to the reliability and validity of the survey instrument are possible, but measures were taken to reduce that possibility. Only two minor changes were made to the Usher & Pajares’ (2009) survey (see Appendix C) to make it more appropriate for
college-age students. The changes were cosmetic so it was doubtful that it would have affected the validity of the survey instrument. Threats to reliability, however, are higher because of the low response rates of the participants.
34
Since the researcher works at one of the participating institutions with a larger percentage of students within those two demographic areas, it is probable that her name was known to the participants and generated more participation from that institution and specifically those demographic groups. However, all participating students were
informed that their responses would not be known to the researcher, which lessens the possibility of response bias. Additionally, the responses of the participants were analyzed as one whole group without breaking down the analysis per institution, which would also lessen the issues with reliability. However, since the researcher does not know what percentage of the students attended each of the three institutions, then the overall results may be unintentionally skewed. Even though the researcher took every opportunity to make sure the data collected did not have issues with reliability and validity, they are not completely negated. This combined with the small sample size will limit the
generalizability of the results.
35
Chapter IV: Results and Analysis
The purpose of this descriptive, survey research study was to determine which student characteristics (race, gender, sexual orientation and hometown location) influence the sources of mathematical self-efficacy of college freshmen, if any. In order to assess whether the four sources of mathematical self-efficacy were influenced by different student characteristics, several types of analyses were conducted (CFA, factorial ANOVAs, and one-way ANOVAs), based on the type of data provided, using either SPSS 20 or Amos 20. The in-depth discussion of the results will follow the description of how missing data were addressed, the discussion of the sample demographics, and how data screening was processed.
Missing Data
A total of 106 students responded to the email and submitted their responses to the Sources of Middle School Mathematics Self-Efficacy Scale revised for college freshmen. After analyzing the data more closely, four of the participants submitted a response that did not answer over half of the questions on the sources of mathematical self-efficacy scale. Even though the sample size is already small, it was appropriate to eliminate those additional four participants from the overall analysis; thus, reducing the sample size to 102 participants. Once those four participants were eliminated, the amount of data missing was minimal (1.1%) and randomly scattered throughout the data field.
36
Therefore, the missing data did not significantly impact the overall score of the source of mathematical self-efficacy per student. Additionally, during the process of performing the statistical analysis using SPSS, pairwise deletion was chosen over listwise deletion due to the small sample size and the need to include as much data as possible within each
analysis. Demographics
The 102 freshmen in the study are categorized by the following demographics: 49% female, 51% male, 22.5% African American, 62.7% Caucasian, 14.7% other race, 88.2 % heterosexual, 2.9% bisexual, 3.9% homosexual, 39.2% rural hometowns, 27.5% urban hometowns, and 33.3% suburban hometowns. Unfortunately, the data collected from the participants regarding sexual orientation (see Figure 4.1) did not provide enough difference within the sample to allow for this particular characteristic to be used within any of the analyses.
Figure 4.1 Sexual Orientation Demographics Data Screening
Once the missing data were addressed as mentioned above, each of the other variables were investigated for outliers and abnormalities. The high school and college GPA contained data that needed to be reclassified. The original GPA questions provided the students with six ranges for GPA (1: Below 2.00, 2: 2.00 – 2.49, 3: 2.50 – 2.99, 4:
2.9
88.2 3.9 4.9
37
3.00 – 3.49, 5: 3.50 – 3.99, 6: 4.00 or above) from which to select their appropriate GPA. The high school GPA (HSGPA) did not have any student in Level 1, only 5 in Level 2, and only 8 in Level 6 (see Figure 4.2). The college GPA (COLGPA) had only 6 in Level 1 and 3 in Level 6 (see Figure 4.3).
Figure 4.2 High School GPA Demographics (HSGPA)
Figure 4.3 College GPA Demographics (COLGPA)
Both the high school GPA and the college GPA were reclassified to treat the outliers and to make the different levels more equal based on the number of students within each level. For the high school GPA the old Levels 1, 2 and 3 became the new high school GPA (HSGPA2) Level 1 (Below 3.00), the old Level 4 became the new
5.9 11.8
24.5
26.5 25.5
2.9
Below 2.00 2.00 - 2.49 2.50 - 2.99 3.00 - 3.49 3.50 - 3.99 4.00 or above 4.9
20.6
34.3 32.4
7.8 Below 2.00
38
Level 2 (3.00 – 3.49), and the old Levels 5 and 6 became the new Level 3 (3.50 or above) (see Figure 4.4). For the college GPA the old Levels 1 and 2 became the new college GPA (COLGPA2) Level 1 (Below 2.50), the old Level 3 became the new Level 2 (2.50 – 2.99), the old Level 4 became the new Level 3 (3.00 – 3.49), and the old Levels 5 and 6 became the new Level 4 (3.50 or above) (see Figure 4.5).
Figure 4.4 High School GPA Demographics Reorganized (HSGPA2)
Figure 4.5 College GPA Demographics Reorganized (COLGPA2)
Out of the 73 freshmen who took a math class last semester (fall 2011), three withdrew from the course. Since some institutions use an E instead of F to signify a “not passing” grade, it was included as an option for the course grade; however, no student received a letter grade of E. Additionally, the numbers of students obtaining a D or F
25.5
34.3
40.2 Below 3.00
3.00 - 3.49 3.50 or above
17.6
24.5
26.5
28.4 Below 2.50
39
were small compared to the other letter grades. In order to make the levels of the variable more equal, to address any outliers or abnormalities, and to associate a higher letter grade with a higher number value (comparable to a standard GPA score), the variable was reclassified as classgrd with the following levels: Level 4 – A grade, Level 3 – B grade, Level 2 – C grade, Level 1 – D or F grade. The students who withdrew from the course were eliminated from the new variable, which leaves classgrd with a total of 70 students (see Figure 4.6).
Figure 4.6 Letter grade received in math course taken the previous semester (classgrd)
The sources of mathematical self-efficacy were calculated at this time by
averaging the values of the participants’ responses on the six questions pertaining to each source (see Appendix C). Seven of the questions were reversed coded (marked with an asterisk) to correspond a higher value with a higher sense of self-efficacy based on that particular source. The reverse coding matched the coding of the questions from the study by Usher and Pajares (2009). Mastery experience (ME) was calculated using questions 1, 4, 9*, 10, 13, and 19. Vicarious Experience (VE) was calculated using questions 2, 14, 17, 20, 22, and 24. Verbal and Social Persuasions (VSP) were calculated using questions 6, 8, 11, 16, 18, and 23. Physiological and Emotional States (PES) were calculated using questions 3*, 5*, 7*, 12*, 15*, and 21*. The more stressed, anxious or depressed a
28.6
31.4 18.6
21.4
40
student felt regarding mathematics, the lower the score. Students who felt good about the mathematics course would have a higher physiological and emotional states score than those who felt bad.
In order to assess whether combining the scores of the particular questions for all participants in the research study provide a stable and internally consistent measure (Warner, 2008), the Cronbach’s alpha reliability coefficient was calculated for each source of mathematical self-efficacy: 0.89 for mastery experience, 0.75 for vicarious experience, 0.94 for verbal and social persuasions, and 0.90 for physiological and emotional state. The Cronbach’s alpha coefficient was higher in this study for mastery experience, verbal and social persuasions and physiological and emotional states than Usher and Pajares’ (2009) original study (0.88, 0.88, and 0.87, respectively), but lower than their vicarious experience Cronbach’s alpha coefficient (0.84). Usher and Pajares (2009) have acknowledged that a low Cronbach’s alpha coefficient has been an issue with this particular construct in the past; however, it was still higher in this research study than other studies (Hodges & Murphy, 2009; Lent, Lopez, & Bieschke, 1991; Matsui, Matsui, & Ohnishi, 1990).
41
Cronbach’s alpha reliability coefficient was lower in this study than Usher and Pajares’ (2009), the Cronbach’s alpha reliability coefficient was analyzed on the three
subcategories as well. The Cronbach’s alpha coefficient of reliability was lower for each of the subsections of the vicarious experience construct (VEadult: α = 0.52, VEpeer: α = 0.51, and VEself: α = 0.62), which implied that all independent items within each subsection are necessary for the overall reliability of vicarious experience.
After verifying the internal consistency reliability for each of the sources (ME: α = 0.89, VE: α = 0.75, VSP: α = 0.94, and PES: α = 0.90) based on the four groups of six questions, it was important to determine whether the responses to those questions were still corresponding to their specified latent variable as established by Usher and Pajares (2009) through confirmatory factor analysis (CFA).
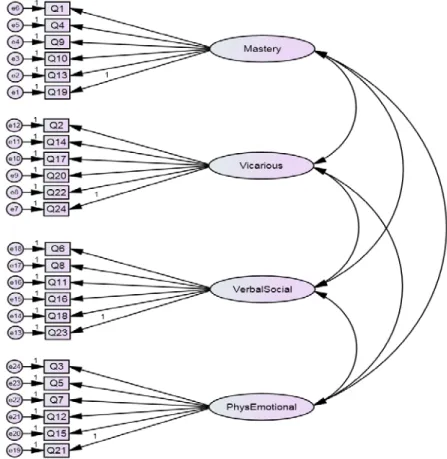
Confirmatory Factor Analysis
42
Figure 4.7 Confirmatory Factor Analysis Model for Maximum Likelihood and Bayesian estimation of the twenty four survey questions
43
for this research study because it does not require normally distributed, continuous data from large sample sizes.
Bayesian estimation has not been used widely in social-psychological research even though it has been around since the 18th century (Arbuckle, 2007; Byrne, 2009). One reason for its limited appeal to researchers outside of the statistical field may be that Bayesian analysis appears to be difficult to perform (Muthen & Asparouhov, 2010) and the computational software to perform the analysis have been unavailable (Arbuckle, 2007).
In the Bayesian approach any quantity that is unknown, such as the four sources of self-efficacy, is viewed as a random variable and assigned a joint probability
44
Using AMOS 20, the Bayesian approach was applied to this research study yielding a posterior predictive p-value of 0.50, DIC = 3159.84, and effective number of parameters = 73.37, which means it was an excellent fit. Once the model fit was
established, the research study continued with an analysis of the results of the survey items.
Data Analysis
Descriptive statistics. Before data analysis of the survey items began, the descriptive statistics of the four sources of mathematical self-efficacy and the three subcategories of vicarious experience were calculated (see Table 4.1). Since the absolute value of the skewness and kurtosis of each dependent variable was less than 1, the data was considered normally distributed and parametric tests were used for the analysis. Table 4.1
Descriptive statistics for the seven dependent variables
Mean SD Variance Skewness Kurtosis Mastery
Experience 4.110 1.185 1.405 -.516 -.398
Vicarious
Experience 3.804 .966 .934 -.014 -.554
Verbal &
Social Persuasions 3.564 1.404 1.972 -.093 -.899 Physiological
& Emotional States 4.050 1.250 1.564 -.366 -.534 Vicarious
Experience – Adult 3.971 1.128 1.271 -.427 .055 Vicarious
Experience – Peer 3.765 1.183 1.400 -.321 -.263 Vicarious
45
Effect sizes, power, and Type I error value. Several different effect size indexes (Cohen’s d, eta squared (η2), partial-eta squared, and R2) are used within research studies to estimate the proportion of the variance in the scores of the dependent variable based on the independent variables (Warner, 2008). When the researcher performed the factorial ANOVAs in SPSS, the output generated the R2 and partial-eta squared effect sizes. The R2 effect size provides the proportion of variance based on the combination of all of the independent variables and can be used as an index of the strength of a linear relationship (Warner, 2008), which would be more appropriate for regression analysis or multivariate analysis of variance. The partial-eta squared effect size provides the proportion of the remaining variance in the scores of the sources of mathematical self-efficacy when the other independent variables and their interactions have been removed (Warner, 2008). The researcher chose to include the partial-eta squared effect size in the factorial ANOVA tables in this research study, because it would provide the amount of variance within the means associated with each individual independent variable when all of the other variables were held constant.
Additionally, the researcher chose to include the η2 effect size also within the analysis of this research study, because it can be used to analyze the statistical power of the results. “Statistical power is the probability of obtaining a test statistic large enough to reject H0 when H0 is false” (Warner, 2008). Generally, researchers would like to obtain
80% statistical power. Cohen (as cited in Warner, 2008) established a table to determine the statistical power from the effect size. Cohen established three levels of effect based on the d-value (d=.20, small; d=.50, medium; and d=.80, large) and also provided the corresponding η2