DNA METHYLATION PATTERNS AS A BIOMARKER OF DISEASE RELAPSE AND REMISSION IN PATIENTS WITH ANCA-ASSOCIATED VASCULITIS
Britta Elyse Jones
A dissertation submitted to the faculty at the University of North Carolina at Chapel Hill in partial fulfillment of the requirements for the degree of Doctor in Philosophy in Pathobiology
and Translational Science in the Department of Pathology and Laboratory Medicine in the School of Medicine.
Chapel Hill 2016
iii ABSTRACT
Britta Elyse Jones: DNA Methylation Patterns as a Biomarker of Disease Relapse and Remission in Patients with ANCA-Associated Vasculitis
(Under the direction of Ronald J. Falk)
This dissertation is focused on the role of DNA methylation in anti-neutrophil cytoplasmic autoantibody (ANCA)-associated vasculitis (AAV), an autoimmune condition characterized by vascular inflammation and organ damage. Pharmacologically induced remission is complicated by relapses. Potential triggers of relapse are immunological challenges and
environmental insults, both of which are associated with changes in epigenetic silencing modifications. Alterations in histone modifications implicated in gene silencing are associated with aberrant autoantigen expression.
Kaplan-Meier estimate of relapse revealed patients who increased DNA methylation at the PRTN3 promoter had a significantly greater probability of a relapse-free period, independent of ANCA serotype. Patients with decreased DNA methylation at the PRTN3 promoter were more likely to relapse with a hazard ratio of 4.55. Changes in the DNA methylation status of the PRTN3 promoter predict likelihood of stable remission and may explain autoantigen gene regulation.
Chapter 2 focuses on gene-specific DNA methylation patterns of purified neutrophils and CD14+ monocytes isolated from patients with AAV. I measured DNA methylation at MPO and PRTN3 along with the mRNA expression of those genes and found evidence that DNA
methylation in monocytes may be contributing to the altered methylation patterns seen in
v
ACKNOWLEDGEMENTS
Ralph Waldo Emerson is quoted as saying “nothing great was ever achieved without enthusiasm”. It is an understatement to say that everything I have accomplished in graduate school came through the grace of my own enthusiasm and the enthusiasm others had in teaching, and guiding me. It took more than a village to get me to the point of writing this document; indeed, it took more than one department in the School of Medicine. I would be remiss if I didn’t acknowledge the scientists, athletes and people who have made this journey a triumph of quality over quantity.
Dr. Dominic Ciavatta, my main man mentor in the UNC Kidney Center, has taught me tenacity in trouble-shooting and the value of humor in science. Dominic and his wife Suzie continue to model the kind of scientist, coach and athlete I hope to become. I would not be here if it were not for Dr. Ronald Falk and his tendency to take in refugee graduate students. I remain in awe of Dr. Falk’s capacity to both treat patients and unravel the basic science intricacies of kidney disease. Every great scientist should have a colleague that pushes him or her to
advocates and supporters in these past seven years. The respect and appreciation I have for each of these men who positively impacted my experience at UNC is truly great. Drs. Bill Coleman and Jon Homeister have welcomed me into the Department of Pathology and Laboratory Medicine with open arms and open office doors, welcoming my questions and concerns while requesting updates on my personal life in a way that has made joining the department feel like coming home.
In the Kidney Center, I have the honor of working with a number of brilliant minds day in and day out. Dr. Meghan Free took me under her wing and has patiently guided me down a path that is both similar and completely unique to her path as a graduate student in the Kidney Center. Jacob Hess, Elizabeth McInnis, Carmen Mendoza, Katie Stember and countless others have provided much-needed laughter and help in the laboratory, particularly during those long clinic Thursdays. Candace Henderson has made consenting patients and collecting samples look easy through the empathy and sense of humor she applies to her job every day. Caroline Poulton has made the vast ‘universe’ of ANCA samples accessible by continually updating the database that is so crucial to this research. The Kidney Center functions as a team in a world that is increasingly proprietary and I can’t imagine a better environment to work, study and explore.
vii
scientist. I am a collection of diverse experiences afforded to me by my parents and their love of adventure and commitment to invest in our local community. That investment has come in the form of coaching the Carrboro Clams (high school ultimate team) and chairing the Youth Committee for Triangle Ultimate; as with most volunteer efforts, I’ve gained more from these experiences than I ever anticipated and consider myself lucky to be a Clam.
While it is entirely possible that the first year I competed in the local science fair I made my life and the lives of those around me beyond miserable, I am grateful that my parents did not abandon me in the pick-up lane of my middle school one afternoon as I often feared. Indeed, they stuck with me and my budding love of all things weather-related and fostered in me a deep appreciation for how things work and how much in the world around us is a puzzle waiting for someone to sit down and piece together. My father often speaks of the ‘wall of science’ and how each of us contributes our findings, brick by brick as we work to fill in the gaps. I hope that this dissertation is one of many bricks I have the opportunity to contribute—not only by sheer mass but also by scientific value.
So much of this writing and correct comma usage is due to my partner, Annie Reuben. Annie continues to understand far more immunology and epigenetics than I understand litigation. Annie pushes me, the envelope, and the pace on our evening runs, and for that I am truly
grateful.
TABLE OF CONTENTS
LIST OF TABLES ... x
LIST OF FIGURES ... xi
LIST OF ABBREVIATIONS ... xii
PROLOGUE: DNA METHYLATION IN AUTOIMMUNE DISEASE ... 1
Chromatin modifications ... 3
DNA methylation ... 4
DNA methylation in autoimmune diseases ... 8
Immune cell types in AAV ... 11
Central hypothesis ... 13
CHANGES IN GENE-SPECIFIC DNA METHYLATION PREDICT STABLE REMISSION IN PATIENTS WITH ANCA-ASSOCIATED VASCULITIS ... 15
Introduction ... 15
Materials and Methods ... 17
Results ... 27
Discussion ... 50
THE SEARCH FOR CELL TYPES RESPONSIBLE FOR AUTOANTIGEN GENE EXPRESSION IN AAV ... 57
Introduction ... 57
ix
Discussion ... 79
SUMMARY ... 84
EPILOGUE: DYNAMIC GENE-SPECIFIC DNA METHYLATION IN PATIENTS WITH AAV ... 86
Altered leukocyte DNA methylation profiles in AAV ... 86
Purified cell types with the potential to drive methylation changes in ANCA disease ... 87
Future directions ... 89
Conclusions ... 91
LIST OF TABLES
Table 1.1. Healthy individual demographics. ... 19 Table 1.2. Primers used for Taqman mRNA expression studies and DNA
methylation studies. ... 23 Table 1.3. Gene coordinates for each of the seven loci studied. ... 24 Table 1.4. Demographics summary for AAV patient cohort. ... 28
Table 1.5. Genome-wide DNA methylation supports differential methylation
at MPO and PRTN3. ... 30 Table 1.6. Hazard Ratios for the role of methylation change in flare-free
probability at PRTN3 and MPO. ... 48 Table 2.1. Surface markers measured by flow cytometry in CD4-enriched
xi
LIST OF FIGURES Figure 1.1. Relative DNMT1 expression and DNA methylation at
PRTN3 and MPO loci comparing active to remission states. ... 21
Figure 1.2. Amplicon locations within ELANE and LTF. ... 22
Figure 1.3. Epigenome-wide DNA methylation in patients with AAV. ... 29
Figure 1.4. DNA methylation at additional loci within PRTN3 and MPO. ... 33
Figure 1.5. DNA methylation at loci within additional granulocyte genes. ... 34
Figure 1.6. DNA methylation platform comparison. ... 35
Figure 1.7. Correlation of DNA methylation and mRNA expression at DNMT1. ... 36
Figure 1.8. Correlation of DNA methylation and mRNA expression at PRTN3 and MPO. ... 37
Figure 1.10. DNA methylation changes at individual CpGs within the PRTN3 promoter and MPO CGI/exons 5-6. ... 40
Figure 1.11. AAV patients stratified by DNA methylation increase or decrease. ... 42
Figure 1.12. DNA methylation and probability of relapse. ... 45
Figure 1.13. Role of prednisone in DNA methylation. ... 49
Figure 2.1. Relative MPO and PRTN3 expression in monocytes and neutrophils. ... 66
Figure 2.2. Neutrophil and monocyte methylation and expression at PRTN3 promoter. ... 68
Figure 2.3. Neutrophil and monocyte methylation and expression at PRTN3 CGI/exon 5. ... 69
Figure 2.4. Neutrophil and monocyte methylation and expression at MPO CGI/exon 7. ... 71
Figure 2.5. DNA methylation and expression in the CD4-enriched population. ... 72
Figure 2.6. Flow cytometry surface staining in CD4-enriched populations. ... 75
Figure 2.7. Cells from the CD3- CD4- fraction isolated from G-CSF donors. ... 76
Figure 2.8. RNA sequencing of paired CD4-enriched populations from AAV patients. ... 77
LIST OF ABBREVIATIONS
AAV anti-neutrophil cytoplasmic autoantibody associated vasculitis
AP-1 activated protein 1, transcription factor
ANA antinuclear antibodies
ANCA anti-neutrophil cytoplasmic autoantibody
BPI bactericidal/permeability-increasing protein
BVAS Birmingham vasculitis activity score
c-ANCA cytoplasmic-anti-neutrophil cytoplasmic autoantibody
CF cystic fibrosis
CGI CpG island
CS corticosteroid
DNA deoxyribonucleic acid
DNMT1 DNA methyltransferase 1
EGPA eosinophilic granulomatosis with polyangiitis
ELANE elastase
xiii EWAS epigenome-wide association studies
Foxp3 transcription factor forkhead box P3
FCR fragment, crystallizable receptor
G-CSF granulocyte colony-stimulating factor
GPA granulomatosis with polyangiitis
H3K27me3 histone 3 lysine 27 trimethylation
HC healthy control
HLA-DR human leukocyte antigen, antigen D related
HMR hypomethylated region
HSC hematopoietic stem cell
IBD inflammatory bowel disease
IL-8 interleukin 8
Lim renal limited necrotizing and crescentic glomerulonephritis
LTF lactotransferrin
MALDI-TOF matrix assisted laser desorption/ionization time of flight
MHC major histocompatibility complex
MPO myeloperoxidase
mRNA messenger ribonucleic acid
MS multiple sclerosis
NF-AT transcription factor, nuclear factor of activated T cells
p-ANCA perinuclear-anti-neutrophil cytoplasmic autoantibody
PBMC peripheral blood mononuclear cell
PMN polymorphonuclear cell
PR3 proteinase 3
RA rheumatoid arthritis
RT-PCR real time polymerase chain reaction
SLE systemic lupus erythematosus
TCR T cell receptor
TET ten-eleven translocation family enzymes
Treg regulatory T cell
USF upstream stimulatory factor
1
PROLOGUE: DNA METHYLATION IN AUTOIMMUNE DISEASE
Anti-neutrophil cytoplasmic autoantibody (ANCA)-associated vasculitis (AAV) is a systemic autoimmune condition characterized by vascular inflammation and organ damage. Observations from in vitro and experimental animal models indicate a pathogenic role for ANCA, which can activate neutrophils and monocytes, causing destructive necrotizing vascular
inflammation (1). The necrotizing vasculidities associated with ANCA include granulomatosis with polyangiitis (GPA), microscopic polyangiitis (MPA), eosinophilic granulomatosis with polyangiitis (EGPA) and renal limited necrotizing and crescentic glomerulonephritis (2). The etiology and pathogenesis of AAV are influenced by genetic factors, environmental exposures, infections and characteristics of the innate and adaptive immune system. ANCA target antigens in the cytoplasm of neutrophils and monocytes. Myeloperoxidase (MPO) and proteinase 3 (PR3) are two prominent autoantigen targets of ANCA; it is the interaction between ANCA and target autoantigens that induces AAV.
mRNA that coincided with de novo protein synthesis of MPO and PR3 in neutrophils (9). Our group previously proposed a model wherein these normally silenced genes are upregulated as a consequence of reduction in the histone modification histone H3 lysine 27 trimethylation (H3K27) (10). This modification is associated with DNA methylation, raising the possibility of combinatorial mechanisms responsible for autoantigen gene silencing. Thus, there is reason to believe that altered epigenetic modifications have the ability to impact the pathogenesis of AAV.
When Conrad Waddington first postulated that environmental signals might have the ability to modify genes and determine the fate of a single cell, he thought an additional layer of information must exist around or above the genome—the epigenome (11). Genes had yet to be visualized at this point in the early 20th century, thus this postulation and the accompanying concept of epigenetics were cast aside in favor of more testable hypotheses in a field soon to become developmental biology. It was not until 1975 that DNA methylation was explored as a potential epigenetic regulator (12, 13). By the late 20th century, epigenetics came to describe modifications of the DNA or associated proteins that carry information during cell division, exclusive of DNA sequence variation (14). Today, the methylation of the fifth position of cytosine is one of the most mechanistically understood epigenetic modifications (15). DNA methylation patterns are established and modified in response to environmental factors by three main DNA methyltransferases (DNMTs); the loss of any one of these enzymes is lethal in mice (16).
The field of epigenetics, which includes the study of DNA methylation, holds the potential to explain mechanisms involved in aging, human development, cancer, heart disease mental illness and autoimmunity. Epigenetics is now considered to be at the “epicenter of
3
in disease than genetics (17). Just as Conrad Waddington first theorized, scientists continue to study epigenetics in an effort to better explain the relationship between the genome and the environment. Inclusion of epigenetics in studies of the etiology of human diseases is thought to uncover modifications useful in disease prevention and therapy. Already, DNA
methyltransferase inhibitors are being used in the treatment of hematologic cancers;
demonstrating a combination of immune-checkpoint-inhibitor agents and epigenetic modulators (18, 19). Unlike sequence mutations, epigenetic changes are, by definition, reversible. Thus, the greatest promise of epigenetics in the field of medicine lies in the possibility of new therapies.
Chromatin modifications
In response to environmental factors, DNA methylation patterns are established and modified by a complex interplay of DNMT1, 3A and 3B that catalyze the transfer of methyl groups to DNA. DNA methyltransferases can be divided into maintenance methyltransferases (DNMT1) and de novo methyltransferases (DNMT3A and 3B). During DNA replication, DNMT1 propagates symmetrically methylated CpGs through recognition of the nascent strand opposite a previously methylated position. DNMT1 functions throughout the life of an organism to maintain the methylation pattern established by the de novo methyltransferases. DNMT1 can accumulate errors over successive rounds of cell division which can lead to aberrant expression of previously silenced genes (23).
De novo methyltransferases, DNMT3A and DNMT3B, add methyl groups to previously unmethylated CpGs and are known to be active during germ cell development and early
embryogenesis, when DNA marks are re-established after phases of genome demethylation (24). Thus, both DNMT3A and 3B are capable of mediating methylation-independent gene repression. With regard to disease etiology, the replication of DNA methylation patterns during mitosis is sensitive to the environment.
DNA methylation
Epigenetic changes have profound effects on gene expression by modifying the
accessibility of DNA to transcription factors (25). In mammals, cytosine methylation is restricted to the symmetrical CpG context (26, 27). Compared to other epigenetic modifications, CpG methylation is thought to be relatively stable; but it can be affected by environmental changes as well as genetic mutations, leading to epigenetic instability and disease. Three conserved
5
groups that are essential for normal development (28, 29). Of the 28 million CpGs in the
mammalian genome, 60-80% are methylated. Clusters of CpGs averaging 1,000 base pairs long and characterized by elevated cytosine and guanine base composition are referred to as CpG islands (CGIs). CGIs comprise fewer than 1% of total genomic DNA (30), yet these CGIs are present at transcription start sites of more than half of all human genes (31, 32). Despite growing interest in the study of changes in DNA methylation, the vast majority of genomic methylation patterns are relatively static across tissues and throughout life; exceptions include the germ line and pre-implantation development.
In contrast to the rest of the genome, where CpG dinucleotides are heavily methylated and rapidly lost through deamination, CpG sites within CGI promoters are normally free from DNA methylation and do not have an elevated mutation rate (32, 33). These genes show differences in their patterns of transcription initiation and are reported to have higher levels of activation-associated chromatin modifications. CGI promoters are not usually repressed by DNA methylation; instead they are silenced by histone (H3K27) methylation (34, 35). Genes with CGI promoters have a characteristic transcription-associated chromatin organization. Active genes with CGI promoters have a distinct step-like series of modified nucleosomes after the
transcription start site (36). The maintenance of an unmethylated state at a promoter overlapping with a CGI requires DNMTs to be excluded; a maintenance that is heavily influenced by
expression by modifying the accessibility of promoter regions to transcription machinery (39, 40).
Forty-five percent of all human gene promoters do not contain a sufficiently dense population of CpGs to constitute CGIs, yet the role of DNA methylation in the control of non-CGI promoters in normal and pathological processes is not fully understood (41). The regulation of non-CGI promoters by DNA methylation plays an important role in the establishment and maintenance of cell identity (42). Despite their low CpG density, genes with non-CGI promoters share many epigenetic features also associated with CGI promoter genes. Active non-CGI promoters display a nucleosome-depleted region immediately upstream of the transcription start site. The epigenetic signatures comprising DNA methylation, histone marks and nucleosome occupancy of non-CGI promoters are almost identical to CGI promoters. This suggests that aberrant methylation patterns of non-CGI promoters may also impact altered gene expression, contributing to disease processes such as tumorigenesis and autoimmunity (14, 23, 43).
Both of the autoantigen genes, MPO and PRTN3, are considered to have non-CGI promoters. Proteinase 3 contains enough CpGs in the promoter to allow for quantification of DNA methylation in the promoter as well as in the three CGIs across the gene body.
Myeloperoxidase contains two CGIs in the gene body and fewer than 6 CpGs in the promoter. Previous studies measuring DNA methylation at CGIs that are remote from annotated
transcription start site showed evidence of promoter function, indicating strong correlation between these CGIs and transcription initiation (44, 45). The CGIs at intragenic regions are more frequently methylated during development and may contribute more nuanced regulatory
7
Quantification of DNA methylation is crucial for understanding the roles gene expression and silencing play in the development of autoimmunity. This quantification was made more accessible with the development of a technique wherein genomic DNA is treated with sodium bisulfite, which converts unmethylated cytosines to uracil and leaves methylated cytosines unchanged (47). The bisulfite conversion method is the basis of many platforms used to measure the amount of CpG methylation from genome-wide to gene-specific interrogation (48).
Tools for measuring DNA methylation can be divided into genome-wide platforms and targeted or gene-specific platforms. Genome-wide methylation studies are increasingly being referred to as epigenome-wide association studies (EWAS) and include a number of different microarray-based methods. Following bisulfite conversion of genomic DNA, the Illumina Infinium methylation assay uses two site-specific probes for the methylated and unmethylated loci followed by single-base extension of the probes to incorporate a fluorescently-labeled ddNTP; the ratio of fluorescent signals from methylated and unmethylated sites determines the level of DNA methylation at close to 500,000 CpG sites (49). High-throughput sequencing now enables complete methylomes to be elucidated in a variety of cells and tissues (50). One of the most commonly used platforms for targeted quantification of DNA methylation is bisulfite sequencing in which primers are designed around regions of interest containing multiple CpG dinucleotides (51). EWAS techniques are not always the most cost-effective for local DNA methylation studies. In this body of work I utilized the EpiTYPER® DNA methylation analysis technology (Agena Bioscience) which allows for the design of amplicons up to 600 base pairs in length and
Cleavage products derived from a template with a methylated cytosine will differ from products derived from a template with an unmethylated cytosine by 32 Daltons. This difference in
cleavage products is detected using matrix assisted laser desorption/ionization time of flight (MALDI-TOF) mass spectrometry, and the ratio of fragments determines the percent methylation.
DNA methylation in autoimmune diseases
In essence, autoimmunity is the loss of self tolerance and is associated with a number of risk factors. It is thought to develop when genetically predisposed individuals encounter
environmental agents that trigger a disease. Despite the many years since Dr. Waddington’s initial hypothesis relating the environment to gene modifications, researchers continue to believe that interactions between the genetic elements and epigenetic changes caused by environmental agents may be responsible for inducing autoimmune disease. The list of genetic loci with the ability to predispose an individual to certain autoimmune conditions continues to grow; yet alongside that growing list is the evidence that genetic sequence mutations do not explain the entirety of autoimmune disease development. Autoimmune disease concordance in identical twins is often incomplete, indicating a requirement for additional factors, presumably from the environment (52, 53). Environmentally-induced epigenetic changes, particularly DNA
methylation, have already been shown to contribute to the environment-host interaction in some autoimmune diseases (54).
9
along with the knowledge that DNA demethylating drugs can cause a lupus-like disease. Specifically, procainamide and hydralazine inhibit DNA methylation and are known to cause antinuclear antibodies (ANAs) in most people and a lupus-like disease in a genetically pre-disposed subset (55, 56). Hydralazine can also cause systemic vasculitis and for this reason, patients treated with hydralazine have been excluded from these studies (57).
DNA demethylation has been shown to predict changes in T cell gene expression, contributing to the pathogenesis of lupus. T cells from SLE patients with active disease have hypomethylated DNA due to decreased DNMT1 (58-60). The demethylation of CD4+ T cells in SLE patients can cause increased expression of CD11a and CD70 (61, 62). CD11a expression leads to T cell autoreactivity while CD70 expression stimulates B cells to produce autoantibodies. Additionally, defects acquired in the T cell extracellular signal-regulated kinases (ERK) pathway are sufficient to cause lupus-like autoimmunity, likely through the down regulation of DNMTs in T cells (63). Together, these and other studies demonstrate that demethylation in CD4+ T cells is sufficient to cause autoimmunity (23).
There is altered DNMT1 mRNA expression in SLE, rheumatoid arthritis (RA) and multiple sclerosis (MS) (64). While significantly less is understood about the role of epigenetics in RA and MS, there is evidence that altered DNA methylation occurs in both of these
silenced by methylation (66); this demethylation may lead to the generation of auto-reactive T and B cell clones, similar to those seen in lupus (58).
Multiple sclerosis is a chronic neurodegenerative autoimmune disease caused by a combination of genetic and environmental factors. Studies of individuals with comparable genetic backgrounds but living in different geographic regions revealed significant differences in disease prevalence, suggesting a role for epigenetics in MS (67). The inflammation and
demyelination in relapsing-remitting MS may be related to the increased differentiation of T cells toward a T-helper 17 phenotype, an epigenetically regulated pathophysiological mechanism. There may also be a role for increased histone acetylation in the exacerbation of progressive MS (68).
Lupus, RA and MS are all autoimmune diseases with both a genetic and environmental component; while our understanding of the genetic mutations that impact disease prevalence is rapidly growing, our understanding of how the environment contributes to disease development is largely unknown. Added to this list of autoimmune diseases is ANCA-associated vasculitis, a systemic autoimmune disease characterized by episodes of destructive vascular and extravascular inflammation (69-73). Aberrantly elevated autoantigen expression suggests a critical factor in AAV is the dysregulation of autoantigens, possibly due to epigenetic modifications at MPO and PRTN3 (the gene that encodes PR3) (8, 74-76). Thus, both ANCAs and autoantigen expression are important for the development of AAV.
In normal mature neutrophils, the autoantigens are stored in cytoplasmic granules and their expression is dramatically reduced or completely silenced. Two well-known epigenetic modifications capable of inducing gene silencing are histone 3 lysine 27 trimethylation
11
Repressive Complex 2, the H3K27 methyltransferase, and DNA methylation is complex
including evidence in stem cells and cancer for combinatorial associations between H3K27me3 and DNA methylation (34, 80, 81). The dysregulation of MPO and PRTN3 in patients with active AAV has been linked to reduced H3K27me3 (10). Whether DNA methylation regulates MPO and PRTN3 expression has not been investigated in the context of AAV.
Immune cell types in AAV
Primed neutrophils activated by ANCA can initiate an inflammatory amplification loop and cause destructive necrotizing lesions. Acute injury then initiates a response to the injury by monocytes that transform to macrophages and recruit T cells, which are key to creating
granulomatous inflammation (88). Monocytes can also be activated by ANCA, leading to the production of proinflammatory cytokines that can further attract and activate neutrophils, amplifying tissue injury (89-91). Murine studies have found that monocytes alone are not sufficient to cause acute necrotizing lesions (92).
T cells are another major cell type involved in the pathogenesis of AAV; the
dysregulation of T cells can permit B cells and plasma cells to produce autoantibodies. T cells are critically involved in the genesis of the ANCA autoimmune response by inducing both a pathogenic autoantibody response via B cells as well as through ineffective suppression of the autoimmune ANCA response by regulatory T cells (93). Our research group has recently observed disruption of the suppressive regulatory T cell network in patients with AAV along with an increase in the frequency of a distinct proinflammatory effector T cell subset (94). Murine studies have shown neutrophils activated by ANCA can deposit MPO in glomeruli, thereby involving autoreactive anti-MPO CD4+ T cells in the induction of glomerular lesions (95).
13
There is growing interest in characterizing the role of immune cell subsets involved in the pathogenesis of autoimmune disorders such as SLE, RA, MS and AAV (100). Although, the dynamic cell heterogeneity present in this patient population suggests purified cell populations would be a more accurate basis for understanding disease pathogenesis and etiology, there is likely much to be learned from examining DNA methylation in total leukocytes, especially since a careful study has not been reported in AAV.
Central hypothesis
The role of epigenetic modifications in the pathogenesis of autoimmune diseases is poorly understood compared to genetics; however, a number of studies in the past decade have further characterized aberrations in DNA methylation and histone modifications in autoimmune diseases including SLE, RA, MS and AAV. The central hypothesis of this body of work is that altered DNA methylation profiles exist in patients with AAV and contribute to the pathogenesis of this disease. This body of work incorporates two main sub-hypotheses: at loci within MPO and PRTN3 i) changes in leukocyte DNA methylation exist between healthy controls and
patients with AAV and correlate with MPO and PRTN3 mRNA expression ii) DNA methylation patterns in purified neutrophils and CD14+ monocytes differ between healthy individuals and patients with AAV.
The central hypothesis and sub-hypotheses will be addressed in the following two
15 Chapter 1
CHANGES IN GENE-SPECIFIC DNA METHYLATION PREDICT STABLE REMISSION IN PATIENTS WITH ANCA-ASSOCIATED VASCULITIS1
Introduction
Anti-neutrophil cytoplasmic autoantibodies (ANCAs) target antigens in the cytoplasm of neutrophils and monocytes. Two prominent ANCA autoantigens are myeloperoxidase (MPO) and proteinase 3 (PR3). The interaction between ANCA and target autoantigens induces ANCA-associated vasculitis (AAV), a systemic autoimmune disease characterized by episodes of destructive vascular and extravascular inflammation (69-71). AAV is associated with aberrantly elevated expression of target autoantigens (8, 74-76). In normal mature neutrophils, the
autoantigens are stored in cytoplasmic granules and their expression is dramatically reduced or completely silenced. The elevated autoantigen expression observed specifically in patients with AAV suggests that a critical factor in the disease is the dysregulation of autoantigens. Thus, both ANCAs and autoantigen expression are important for the development of AAV.
Another prominent feature of AAV is that therapy-induced disease remission may be punctuated by periods of disease relapse (3-7). It remains to be understood what factors promote remission or permit disease relapse; however, the elevated expression of autoantigens during active disease suggests mechanisms regulating autoantigen expression may be important in
understanding disease states (8). At the transcriptional level, the dysregulation of MPO and PRTN3 (the gene that encodes PR3) has been linked to alterations in histone modifications that are associated with gene silencing (10). The role of DNA methylation, a model epigenetic modification capable of inducing stable gene silencing, has not been investigated in the context of AAV (77, 78). Hence, the role of gene-specific DNA methylation in the regulation of MPO and PRTN3 expression during the natural history of AAV is not known.
I do not presently know whether DNA methylation changes during the course of disease or remains static, yet different from healthy individuals. The presence of static hypomethylation in AAV patients would be consistent with the concept that an epigenetic state predisposes individuals to disease. Alternatively, dynamic alterations in the DNA methylation profile that occur with changes in disease status may indicate a role for epigenetic modifications in disease status. Characterization of DNA methylation in AAV patients would bolster the understanding of the molecular mechanisms involved in disease pathogenesis and inform disease prognosis.
In this study I investigated DNA methylation associated with AAV-related autoantigen genes, MPO and PRTN3, in patients with AAV. A longitudinal analysis showed that (i) MPO and PRTN3 DNA methylation was reduced in patients with active disease and associated with mRNA expression of these genes and (ii) MPO and PRTN3 DNA methylation increased during disease remission and associated with reduced transcription of these genes. The dynamics of DNA methylation at the PRTN3 promoter revealed AAV patients with increased DNA
17 Materials and Methods
Study Design
The objective of this study was to characterize the DNA methylation patterns in paired patients with AAV through states of disease activity and remission. This was an observational study of DNA methylation changes, both globally and at specific loci. AAV patients were enrolled at UNC–Chapel Hill clinics and followed in the Glomerular Disease Collaborative Network (101, 102). Patients and healthy volunteers were recruited, according to the guidelines of the Institutional Review Board (IRB study #97-0523) by the University of North Carolina Office of Human Research Ethics. Study subjects gave informed, written consent and
Patient Cohort
Patients were diagnosed according to the Chapel Hill Consensus Conference (103, 104). ANCA serotypes were determined by indirect immunofluorescence and antigen-specific PR3 and MPO enzyme-linked immune-absorbent assays (ELISA) (105). Disease activity was determined by the 2003 Birmingham Vasculitis Activity Score (BVAS) in conjunction with clinical signs of activity. In this study, patients with a BVAS of 0 and no clinical or laboratory evidence of active disease were considered to be in remission. Active disease was defined as a BVAS >0 with clinical and/or laboratory evidence of disease (106). A total of 82 patients with AAV and 32 healthy controls were chosen for this study based on the availability of paired active/remitting disease samples, clinical data and laboratory data (Table 1.1). Patients with suspected or confirmed drug-induced forms of AAV, that were ANCA negative by ELISA, or had overlapping disease were excluded. Patients taking known epigenetic modifiers were also excluded from this study. Patient demographics were similar between healthy controls and AAV patients with regard to age, gender and race.
AAV patients were selected for this study based on the availability of total leukocyte DNA and RNA collected at a point of clear disease activity or disease remission (on or off therapy). In addition to the presence of DNA and RNA samples for each patient, I also ensured there was adequate clinical information including BVAS and a list of immunosuppressant therapies the patient was taking at the time of each sample collection. For longitudinal studies I selected patients for whom samples were available at a time of disease activity and remission and were, on average, 18 months apart. These criteria were established prospectively. No outliers have been excluded from this study.
19
PRTN3 MPO DNMT1
1 47 M W NA NA NA
2 57 M W 16.05 105.72 1.22
3 52 M W NA NA NA
4 66 F A NA NA NA
5 52 F W NA NA NA
6 22 F W 2.09 33.12 1.84
7 56 F W 28.29 66.92 0.75
8 51 F W NA NA NA
9 59 F W NA NA NA
10 69 M W 19.56 66.98 0.84
11 67 M W 1.85 38.93 1.21
12 65 M W 51.72 102.3 0.81
13 51 F W 28.64 29.89 1.18
14 59 F B 9.69 33.14 0.71
15 58 F W NA NA NA
16 57 F W 5.56 38.14 0.97
17 57 F W 14.79 77.65 0.9
18 54 M W 45.4 118.73 1.49
19 22 M A NA NA NA
20 22 M W 8.07 25.14 0.79
21 58 F W 11.29 42.73 0.87
22 26 M B 2.46 25.03 1.03
23 22 M A NA NA NA
24 58 F W 26.67 24.77 0.7
25 56 F W 1.81 28.46 0.86
26 77 M W 15.06 34.61 0.84
27 69 M W 13.74 58.12 0.56
28 56 M W 10.71 35.89 NA
29 64 F W NA NA NA
30 56 M W 33.21 175.38 0.76
31 47 M W 50.53 156.82 0.92
32 57 F W NA NA 0.85
Table 1.1. Healthy individual demographics. Age, gender, race and mRNA expression of PRTN3, MPO and DNMT1 for each of 32 healthy controls.
RNA and DNA isolation from total leukocytes
including the RNeasy Mini Kit and RNase-Free DNase Set, were used to isolate RNA from total leukocytes. Sodium citrate-treated whole blood was used to isolate DNA from total leukocytes. For DNA isolation I used Cell Lysis Solution, Protein Precipitation Solution, DNA Hydration Solution (all Puregene Accessories, available through Qiagen) and RNase A from bovine pancreas (Sigma-Aldrich, St. Louis, MO).
DNA methylation studies
Total leukocyte DNA was bisulfite-converted in duplicate using the EZ DNA
Methylation Kit (Zymo Research, Orange, CA). Bisulfite-treated DNA samples were used in three separate platforms for measuring DNA methylation: EpiTyper MassARRAY (Agena, La Jolla, CA), bisulfite sequencing (Zymo Research) and Illumina Infinium HumanMethylation450 BeadChip (Illumina, Inc.).
Targeted MALDI-TOF mass spectrometry (EpiTYPER®, Agena Bioscience) was carried out at seven amplicons within MPO, PRTN3, LTF and ELANE (Figure 1.1B,C; Figure 1.2). Primer pairs were designed using EpiDesigner software (www.epidesigner.com) (Table 1.2). A cohort of 82 AAV patients and 32 healthy individuals were run on this platform, in duplicate. In accordance with the standard protocol and following amplification of 650ng of
21
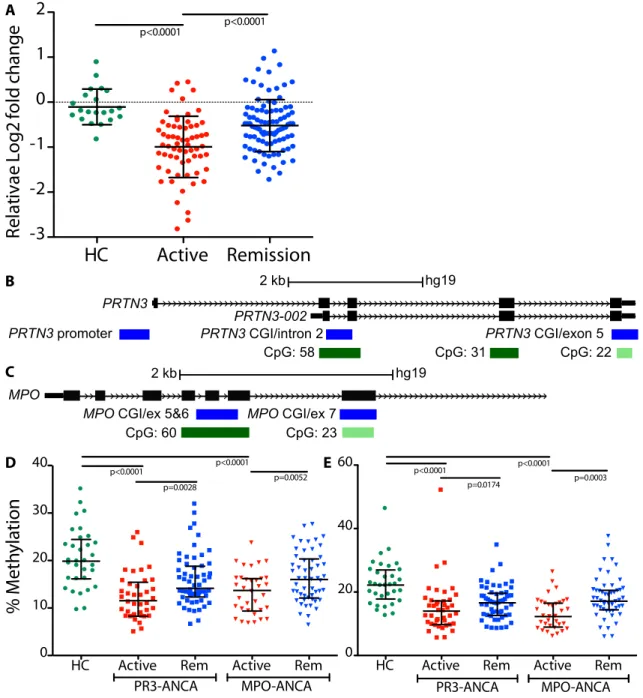
Figure 1.1. Relative DNMT1 expression and DNA methylation at PRTN3 and MPO loci comparing active to remission states. (A) Two-fold decrease in mean DNMT1 expression in active patients (red) compared to healthy controls (green); mean expression in remitting patients (blue) was 1.5-fold higher than active patients. Bars shown are mean and standard deviation; p<0.025 is considered significant after accounting for multiple testing. (B) Three PRTN3 amplicons covering: the promoter, a CGI and intron 2, a CGI and exon 5. (C) Two MPO
HC Active Remission
-3 -2 -1 0 1 2 Re la tiva e Lo g2 fo ld change % M et hy lat io n Figure 1 A p<0.0001 p<0.0001
HC Active Remission -3 -2 -1 0 1 2 Re la tiv e Lo g2 fo ld ch an ge B
C 2 kb
PRTN3
PRTN3 promoter
CpG: 58 CpG: 31 CpG: 22
PRTN3 CGI/intron 2 PRTN3 CGI/exon 5
PRTN3-002
hg19 MPO
CpG: 60 CpG: 23
MPO CGI/ex 5&6 MPO CGI/ex 7
2 kb hg19
D E
HC Active Rem Active Rem 0
10 20 30
40 p<0.0001 p<0.0001 p=0.0052 p=0.0028
PR3-ANCA MPO-ANCA
HC Active Rem Active Rem 0
20 40 60
PR3-ANCA MPO-ANCA p<0.0001 p<0.0001 p=0.0003
p=0.0174 % M et hy lat io n
Figure 1
A p<0.0001 p<0.0001 B C2 kb
PRTN3
PRTN3 promoter
CpG: 58
CpG: 31
CpG: 22
PRTN3 CGI/intron 2
PRTN3 CGI/exon 5
PRTN3-002
hg19
MPO
CpG: 60
CpG: 23
MPO CGI/ex 5&6
MPO CGI/ex 7
2 kb
hg19
D E
HC Active Rem Active Rem 0
10 20 30
40 p<0.0001 p<0.0001
p=0.0052 p=0.0028
PR3-ANCA MPO-ANCA
HC Active Rem Active Rem 0
20 40 60
PR3-ANCA MPO-ANCA
p<0.0001 p<0.0001 p=0.0003 p=0.0174 % M et hy lat io n Figure 1 A p<0.0001 p<0.0001
HC Active Remission -3 -2 -1 0 1 2 Re la tiv e Lo g2 fo ld ch an ge B
C 2 kb
PRTN3
PRTN3 promoter
CpG: 58 CpG: 31 CpG: 22
PRTN3 CGI/intron 2 PRTN3 CGI/exon 5
PRTN3-002
hg19 MPO
CpG: 60 CpG: 23
MPO CGI/ex 5&6 MPO CGI/ex 7
2 kb hg19
D E
HC Active Rem Active Rem 0
10 20 30
40 p<0.0001 p<0.0001 p=0.0052 p=0.0028
PR3-ANCA MPO-ANCA
HC Active Rem Active Rem 0
20 40 60
PR3-ANCA MPO-ANCA p<0.0001 p<0.0001
amplicons covering: a CGI and exon 7; a CGI and exon 5-6. Gene is shown in black, amplicons in blue, CGIs in green. Amplicon-wide cross-sectional DNA methylation patterns at the (D) PRTN3 promoter and (E) MPO CGI/exon 5-6. Green circles are healthy controls; squares are PR3-ANCA patients; triangles are MPO-ANCA patients; active patients are red; patients in remission are blue. Bars shown are median with interquartile range; p<0.0125 is considered significant after accounting for multiple testing.
Figure 1.2. Amplicon locations within ELANE and LTF. (A) Amplicon shown covering part of a CGI and exon 2 within the ELANE. (B) Amplicon shown covering a CGI and exon 1 within the LTF. Gene is shown in black, amplicon in blue, CGIs in green.
A
B
Supplementary Figure 7
CpG: 74 CpG: 48
ELANE CGI/exon 2 ELANE
2 kb hg19
CpG: 26
LTF CGI/exon 1 LTF
23
Gene Primer
PRTN3 (Taqman)
Forward 5'-TGT CAC CGT GGT CAC CTT CTT-3' Reverse 5'-CCC CAG ATC ACG AAG GAG TCT AT-3' Probe FAM-TTG CAC TTT CGT CCC TCG CCG-TAMRA MPO
(Taqman)
Forward 5'-CCA GGA AGC CCG GAA GAT-3' Reverse 5'-CGG AAG GCA TTG GTG AAG A-3'
Probe FAM-TGC CCA CGT ACC GTT CCT ACA ATG ACT C-TAMRA
DNMT1 (Taqman)
Thermo Fisher cat. #4331182 PRTN3 (amplicon
5, methylation)
Forward 5’-aggaagagagTTAAAGGGGGAAGAAAATTTTTAGA-3’ Reverse 5’-cagtaatacgactcactatagggagaaggct
ATTACCCAATACCCAAACTAAATCC-3’ PRTN3 (amplicon
20, methylation) Forward 5’-aggaagagagAAGTGTTGTTGGGTGGGTTTTT-3’ Reverse 5’-cagtaatacgactcactatagggagaaggct AACACCTTAATCCACCCCAACTT-3’
PRTN3 (amplicon
22, methylation) Forward 5’- aggaagagagTTGTGATGGTATTATTTAAGGAATAGATTT-3’ Reverse 5’-cagtaatacgactcactatagggagaaggct
CCTCCCCTCCCTATATAAAAAAAAC-3’ MPO (amplicon
11, methylation)
Forward 5’- aggaagagagGTTGGGGGTGGTTGTAGGAAT -3’ Reverse 5’-cagtaatacgactcactatagggagaaggct
CAACTAACCCCATTACATAAACATAAA-3’ MPO (Amplicon
12, methylation) Forward 5’-aggaagagagAAGTTGATTTGTTAGGAAGTAGGGG-3’ Reverse 5’- cagtaatacgactcactatagggagaaggct AACCTCTCTCTATACCTCAAATCCC-3’
LTF (amplicon 3,
methylation) Forward 5’-GGA GTT TTG TTT TGT TTT AGG GTT T-3’ Reverse 5’-CTC CTA TTC CTC CCC ATA TAA AAA A-3’ ELANE (amplicon
5, methylation
Forward 5’-TGG TGG GGG ATT TAG AGG TT-3’
Reverse 5’-AAC TAC AAA AAC ACC ATA AAA AAC CA-3’
Targeted bisulfite sequencing for DNA methylation analysis was done on a replication cohort of 77 patient samples and 19 samples from healthy individuals (96 samples) at six of the same loci studied interrogated using the Agena platform. Sixteen primers were designed, synthesized (Integrated DNA Technologies) and validated by Zymo Research (Table 1.3). Targeted amplification of these samples was performed according to manufacturer’s protocol (Zymo Research).
Gene_Amplicon Chromosome Browser position
PRTN3_005 19 840498 840945
PRTN3_022 19 847822 848215
PRTN3_020 19 843571 843964
MPO_11 17 56356480 56356874
MPO_12 17 56355180 56355526
LTF_003 3 46506126 46506547
ELA_005 19 852792 852954
Table 1.3. Gene coordinates for each of the seven loci studied.
Illumina Infinium HumanMethylation450 BeadChips were used to analyze DNA methylation on a genome-wide scale in ten longitudinally paired AAV patients and four age-matched healthy individuals (24 samples). This platform allows for interrogation of >485,000 methylation sites per sample, covering 99% of RefSeq genes. After bisulfite treatment, the Mammalian Genotyping Core at UNC-Chapel Hill performed the remaining assay steps following the specifications and using the reagents supplied by the manufacturer (107).
Taqman mRNA expression studies
25
curve for MPO mRNA levels was generated using HL60 cells, a cell positive for MPO mRNA, diluted with Jurkat cells, a cell line negative for MPO mRNA. The standard curve for PRTN3 mRNA levels was generated using THP-1 cells, a cell positive for PTRN3 mRNA, diluted with Jurkat cells, a cell line negative for PRTN3 mRNA. MPO and PRTN3 mRNA levels for patients and healthy donor samples were determined by 2-ΔΔCt calculations and expressed relative to standard curves. Primers and probes for MPO and PRTN3 can be found in Table 1.2.
Cytochrome c oxidase (COX5B) was used as mRNA internal control (8). Primers and probes were purchased from Applied Biosystems (Applied Biosystems, Foster City, CA) and Integrated DNA Technologies, Inc. (Coralville, IA). Quantitative RT-PCR assays were performed on an ABI PRISM 7900HT sequence detection system using the TaqMan EZ RT-PCR kit (Applied Biosystems) (Yang, et al., manuscript submitted). Elevated expression of these autoantigen genes is considered 2 standard deviations above the mean expression of healthy individuals; for PRTN3 high expression is >90, for MPO high expression is >180.
Genome-wide DNA methylation analysis
Statistical Analysis
Comparisons between two independent groups were done using Wilcoxon rank sum test. Bonferroni corrections were used in situations with multiple comparisons between groups. Mean DNA methylation was measured by averaging the CpGs in each individual amplicon.
27 Results
Decreased DNMT1 expression in AAV patients
Our investigation of DNA methylation in patients with AAV began by exploring alterations in the expression of the DNA methyltransferase 1 gene (DNMT1). Previous gene expression studies demonstrated that expression of DNMT1 was decreased in patients with AAV compared to healthy individuals (Yang, et al., manuscript submitted). I confirmed differential DNMT1 expression by quantitative real-time PCR in leukocytes collected from a cohort of AAV patients during disease activity and remission (Table 1.4). The relative mean DNMT1 expression among AAV patients during disease activity was two-fold less than the mean expression among healthy individuals (p<0.0001) (Figure 1.1A). The mean DNMT1 expression of AAV patients in disease remission was 1.5-fold higher than patients with active disease.
Genome-wide studies show differential DNA methylation is restricted to specific loci
I then carried out genome-wide DNA methylation studies to determine if reduced DNMT1 expression in AAV patients with active disease resulted in genome-wide
Table 1.4. Demographics summary for AAV patient cohort. Gender, race and diagnosis information for each patient group alongside BVAS and corticosteroid use for active and remitting samples.
PR3, proteinase 3; MPO, myeloperoxidase; MPA, microscopic polyangiitis; GPA, granulomatosis with polyangiitis; EGPA, eosinophilic granulomatosis with polyangiitis; Lim, renal limited vasculitis; BVAS; Birmingham Vasculitis Activity Score; CS, corticosteroids.
Table 1. Demographics summary for PR3-ANCA and MPO-ANCA patients as well as the healthy control cohort. Gender, race and diagnosis information for each patient group alongside BVAS and corticosteroid use for active and remitting samples.
Variables Healthy individuals
(32)
PR3-ANCA patients (42)
MPO-ANCA patients (40)
Age N 32
Mean ± SD 52.78±14.61
Median(IQR) 56.50(51.00, 59.00)
Sex Female 16(50.00%) 17(40.48%) 19(47.50%)
Male 16(50.00%) 25(59.52%) 21(52.50%)
Race Caucasian 27(84.38%) 35(83.33%) 32(80.00%)
Other 5(15.63%) 7(16.67%) 8(20.00%)
Diagnosis EGPA 0(0.00%) 2(5.00%)
GPA 27(64.29%) 8(20.00%)
LIM 0(0.00%) 12(30.00%)
MPA 15(35.71%) 18(45.00%)
Sample number 98 86
Active Samples 42 35
Active samples taking CS 18 16
Remitting samples 56 51
Active samples taking CS 14 9
Active, new onset 10(10.20%) 11(12.79%)
Long-term remission, off therapy
12(12.24%) 18(20.93%)
Age of active sample N 42 35
Mean ± SD 56.21±14.53 53.51±20.22
Median(IQR) 57.00(50.00, 67.00) 57.00(33.00,69.00)
Age of remission sample N 56 51
Mean ± SD 57.57±16.75 52.47±18.99
Median(IQR) 59(46.50, 71.00) 54.00(38.00,66.00)
Active sampleBVAS N 42 35
Mean ± SD 8.07±6.91 9.49±6.42
Median(IQR) 6.00(2.00,13.00) 8.00(6.00,12.00)
Remission sampleBVAS N 56 51
Mean ± SD 0±0 0.11±0.43
29
Figure 1.3. Epigenome-wide DNA methylation in patients with AAV. (A) Mean M value
(log(methylated signal/unmethylated signal)) at 485,512 CpGs for 4 healthy controls (left, green) 6 PR3-ANCA active patients (middle, purple) and 4 MPO-ANCA active patients (right, blue). Median methylation at all CpG dinucleotides in healthy controls (left, green) compared to AAV patients (right, red) at (B) PRTN3, (C) MPO, (D) ELANE, (E) LTF and (F) BPI. For each graph, the line represents the median, the box the first and third quartiles, and the whiskers represent the maximum and minimum (A, B, D) values or 1.5 interquartile range (C, E, F).
Supplementary Figure 1
A
D
C B
E Supplementary Figure 1 A
D
C B
HC PR3−ANCA MPO−ANCA
−
5
0
5
log(Meth/Unmeth)
HC PR3-ANCA MPO-ANCA
log(M
eth
yl/Unmeth
yl) 5
0
-5
E
Healthy Controls AAV patients
4 2 0 2 4 Log(M et hyl/Unmet hyl )
Supplementary Figure 1
A
D
C B
HC PR3−ANCA MPO−ANCA
−
5
0
5
log(Meth/Unmeth)
HC PR3-ANCA MPO-ANCA
log(M
eth
yl/Unmeth
yl) 5
0
-5
E Supplementary Figure 1 A
D
C B
HC PR3−ANCAMPO−ANCA
−
5
0
5
log(Meth/Unmeth)
HC PR3-ANCA MPO-ANCA
log(M
eth
yl/Unmeth
yl) 5 0 -5
E
Healthy Controls AAV patients
4 2 0 2 4 Log(M et hyl/Unmet hyl )
Healthy Controls AAV patients
6 4 2 0 2 4 Log(M et hyl/Unmet hyl )
HC PR3-ANCA MPO-ANCAHC PR3−ANCA MPO−ANCA
− 5 0 5 log(Meth/Unmeth) log(M eth yl/Unmeth
yl) 5 0 -5
Supplementary Figure 1
A
D
C B
E
Supplementary Figure 1 A
D
C B
HC PR3−ANCAMPO−ANCA
−
5
0
5
log(Meth/Unmeth)
HC PR3-ANCA MPO-ANCA
log(M
eth
yl/Unmeth
yl) 5 0 -5
E
Healthy Controls AAV patients
4 2 0 2 4 Log(M et hyl/Unmet hyl )
Supplementary Figure 1 A
D
C B
HC PR3−ANCAMPO−ANCA
−
5
0
5
log(Meth/Unmeth)
HC PR3-ANCA MPO-ANCA
log(M
eth
yl/Unmeth
yl) 5 0 -5
E
Supplementary Figure 1 A
D C B
HCPR3−ANCAMPO−ANCA
−
5
0
5
log(Meth/Unmeth)
HC PR3-ANCA MPO-ANCA
log(M
ethyl/Unmeth
yl) 5
0
-5
E
Healthy Controls AAV patients
4 2 0 2 4 Log(M et hyl/Unmet hyl )
Healthy Controls AAV patients
6 4 2 0 2 4 Log(M et hyl/Unmet hyl ) 4 2 0 2 Log(M et hyl/Unmet hyl )
HC PR3-ANCA MPO-ANCAHC PR3−ANCA MPO−ANCA
− 5 0 5 log(Meth/Unmeth) Log(M eth yl/Unmeth
yl) 5
0
0
A B
Figure 3
HC Active Rem Active Rem 0 10 20 30 40 % M et hy lat io n
p<0.0001 p<0.0001 p=0.0052 p=0.0028
PR3-ANCA MPO-ANCA
HC Active Rem Active Rem 0
20 40 60
PR3-ANCA MPO-ANCA p<0.0001 p<0.0001 p=0.0003 p=0.0174 4 2 0 2 B C D E F
HC AAV Patients HC AAV Patients
Log(M eth yl/Unmeth yl) Log(M eth yl/Unmeth yl)
HC PR3-ANCA MPO-ANCAHC PR3−ANCA MPO−ANCA
− 5 0 5 log(Meth/Unmeth) log(M eth yl/Unmeth
yl) 5
0
-5
Supplementary Figure 1
A
D
C B
E
Supplementary Figure 1 A
D
C B
HC PR3−ANCAMPO−ANCA
−5
0
5
log(Meth/Unmeth)
HC PR3-ANCA MPO-ANCA
log(M
eth
yl/Unmeth
yl) 5 0 -5
E
Healthy Controls AAV patients
4 2 0 2 4 Log(M et hyl/Unmet hyl )
Supplementary Figure 1
A
D
C B
HC PR3−ANCAMPO−ANCA
−
5
0
5
log(Meth/Unmeth)
HC PR3-ANCA MPO-ANCA
log(M
eth
yl/Unmeth
yl) 5 0 -5
E
Supplementary Figure 1 A
D C B
HCPR3−ANCAMPO−ANCA
−
5
0
5
log(Meth/Unmeth)
HC PR3-ANCA MPO-ANCA
log(M
ethyl/Unmeth
yl) 5
0
-5
E
Healthy ControlsAAV patients
4 2 0 2 4 Log(M et hyl/Unmet hyl )
Healthy Controls AAV patients
6 4 2 0 2 4 Log(M et hyl/Unmet hyl )
HC PR3-ANCA MPO-ANCAHC PR3−ANCAMPO−ANCA
−5 0 5 log(Meth/Unmeth) log(M eth yl/Unmeth
yl) 5 0 -5 Supplementary Figure 1
A
D C B
E
Supplementary Figure 1
A
D C B
HCPR3−ANCAMPO−ANCA
−5
0
5
log(Meth/Unmeth)
HC PR3-ANCA MPO-ANCA
log(M
ethyl/Unmeth
yl) 5 0 -5
E
Healthy ControlsAAV patients
4 2 0 2 4 Log(M ethyl/Unmet hyl )
Supplementary Figure 1 A D C B HCPR3−ANCAMPO−ANCA −5 0 5 log(Meth/Unmeth)
HC PR3-ANCA MPO-ANCA
log(M
ethyl/Unmeth
yl) 5
0 -5
E
Supplementary Figure 1
A
D
C
BHCPR3−ANCAMPO−ANCA
−
50
5
log(Meth/Unmeth)
HC PR3-ANCA MPO-ANCA
log(Methyl/Unmethyl) 5 0 -5
E
Healthy ControlsAAV patients
4 2 0 2 4 Log(Methyl/Unmet hyl)
Healthy ControlsAAV patients
Differential DNA methylation at autoantigen genes
DNA methylation at most loci, genome-wide, was unchanged between patients and healthy controls; however, gene-specific differences in DNA methylation status were detected at MPO and PRTN3. The median DNA methylation at all CpG dinucleotides in MPO and PRTN3 was less in AAV patients with active disease than healthy controls (Figure 1.3B,C). I then determined how many other genes contained differential DNA methylation comparable to MPO and PRTN3. To do this, I identified the CpGs with the largest decrease in mean M value in active patients compared to healthy controls within MPO and PRTN3. The mean M values at these CpGs were compared to the decrease in M value between active patients and healthy controls at CpGs of all other genes. Of 19,654 unique genes, a greater decrease in DNA methylation in active samples was found for only 849 genes and 1,050 genes compared to MPO and PRTN3, respectively (Table 1.5). Approximately 96% of genes exhibited a smaller decrease in DNA methylation in active patients compared to healthy controls. These results strongly suggest that DNA methylation changes in AAV patients are restricted to specific loci, including MPO and PRTN3.
Table 1.5. Genome-wide DNA methylation supports differential methylation at MPO and PRTN3.
Largest mean M-value difference (Active v HC)
Genes with larger mean M value difference
Unique genes
% Genes hypomethyl v autoantigen genes
MPO -1.67 849
19654 3.8%
PRTN3 -1.42 1050 4.1%
31
To test if the changes in DNA methylation at MPO and PRTN3 were a feature of other neutrophil granule genes, methylation was measured locally at CpG islands (CGIs) in neutrophil elastase (ELANE), lactotransferrin (LTF) and bactericidal/permeability-increasing protein (BPI), three neutrophil granulocyte genes with altered mRNA expression in patients with AAV and are known target antigens of ANCA in patients with inflammatory bowel disease (IBD) and
rheumatoid arthritis (RA) (8, 112, 113). I found smaller differences in DNA methylation between AAV patients and healthy controls in the neutrophil granulocyte gene ELANE than those found at MPO and PRTN3 (Figure 1.3D). The genome-wide DNA methylation studies found no difference between patients and healthy controls at BPI or LTF (Figure 1.3E,F).
AAV patient-derived leukocytes exhibit hypomethylation of loci within MPO and PRTN3
region (10). The second region screened in MPO contains a CGI that spans exon 7. Data from ENCODE indicates both regions are DNase I sensitive and enriched in transcription factor binding sites, suggesting transcriptional regulatory properties. These amplicons cover CpGs that were also interrogated using the genome-wide DNA methylation platform (Illumina Infinium HumanMethylation450 BeadChip). The MPO promoter was not probed because the promoter is CpG-poor with only seven CpGs within 500 base pairs of the transcription start site; of those CpGs, six are in a repetitive sequence that prevented designing a reliable amplicon for the MassARRAY platform.
Consistent with the genome-wide DNA methylation study, I found that MPO- and PR3-ANCA patients with active disease were hypomethylated compared to healthy individuals at four loci within MPO and PRTN3 (p<0.0001) (Figure 1.1D,E; Figure 1.4A,B). However, DNA
methylation at these sites rebounded when patients were sampled during disease remission. I then looked at DNA methylation at ELANE, LTF and a CGI overlapping the alternative promoter of PRTN3. Overall, I found low DNA methylation, which remained static with no discernable differences between patient serotype, healthy controls or disease status (Figure 1.5). To
33
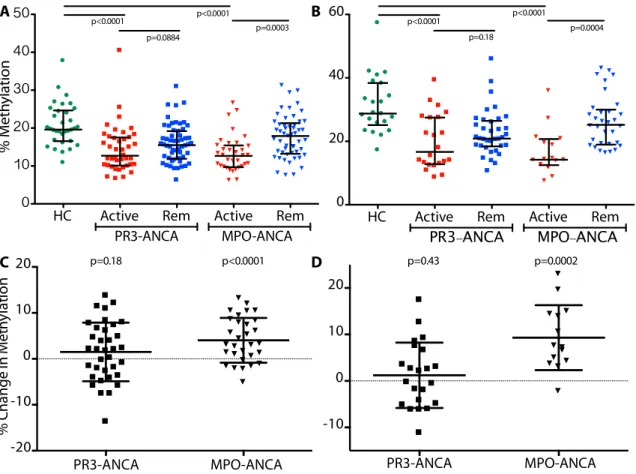
Figure 1.4. DNA methylation at additional loci within PRTN3 and MPO. Cross-sectional methylation at (A) PRTN3 CGI/exon 5 and (B) MPO CGI/exon 7. Healthy controls (green circles); PR3-ANCA patients (squares); MPO-ANCA patients (triangles); active patients are red and patients in remission are blue; bars shown are median with interquartile range; p<0.0125 is considered significant after accounting for multiple testing. Mean longitudinal methylation
change from disease activity to remission at (C) PRTN3 CGI/exon 5: PR3-ANCA patients 1.49%, ANCA patients 4.36%; and (D) MPO CGI/exon 7: PR3-ANCA patients 1.22%, MPO-ANCA patients 9.31%. Error bars are standard deviation; p-values shown are as different from zero, where p<0.025 is significant after accounting for multiple testing.
Supplementary Figure 2
A B
C D
HC Active Rem Active Rem
0 10 20 30 40 50
PR3-ANCA MPO-ANCA
p<0.0001 p<0.0001 p=0.0003
p=0.0884
HC Active Rem Active Rem
0 20 40 60
PR3-ANCA MPO-ANCA
p<0.0001 p<0.0001 p=0.0004
p=0.18 PR3-ANCA MPO-ANCA -10 0 10 20 p=0.0002 p=0.43 PR3-ANCA MPO-ANCA -20 -10 0 10 20 % C ha ng e in M et hy la tio n p<0.0001 p=0.18 % M et hy lat io n
Supplementary Figure 3
A
0.6 0.8 1.0 1.2 1.4 1.6
-1.0 -0.5 0.0 0.5 Lo g ( D N M T1 m RN A E xp re ss io
n) p < 0.0001
0.6 0.8 1.0 1.2 1.4 1.6 1.8 -1.0
-0.5 0.0
0.5 p < 0.0001 B
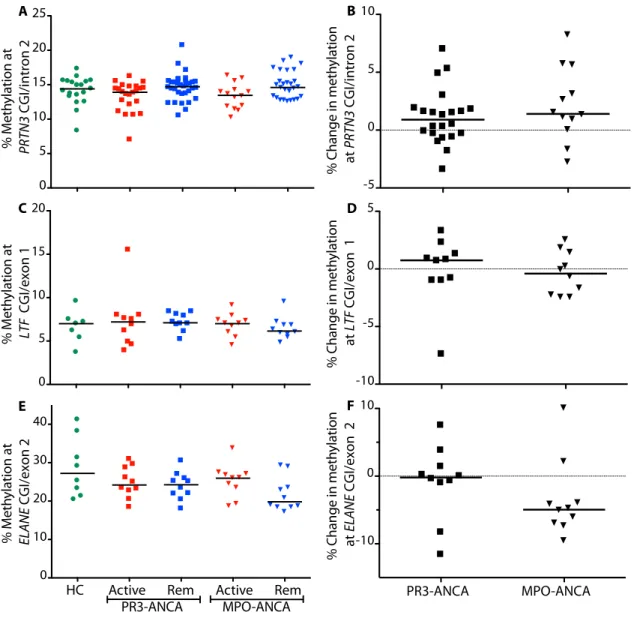
Figure 1.5. DNA methylation at loci within additional granulocyte genes. Green circles are healthy controls; squares are PR3-ANCA patients; triangles are MPO-ANCA patients; active patients are red and patients in remission are blue. (A) Cross-sectional and (B) longitudinal methylation at CGI/intron 2 in PRTN3. (C) Cross-sectional and (D) longitudinal methylation at a CGI/exon 1 in lactotransferrin (LTF). (E) Cross-sectional and (F) longitudinal methylation at a CGI and exon 2 in elastase (ELANE). Bars are median methylation (A,C,E) or median
longitudinal methylation change from disease activity to remission (B,D,F).
% M et hy lat io n at PRTN3 CGI/intron 2
Supplementary Figure 3
E F PR3-ANCA MPO-ANCA -10 0 10 0 5 10 15 20 C D -10 -5 0 5 A B -5 0 5 10
HC Active Rem Active Rem 0
10 20 30 40
PR3-ANCA MPO-ANCA
% M et hy lat io n at LTF CGI/exon 1 % M et hy lat io n at ELANE CGI/exon 2 %
Change in m
et hy lat io n at PRTN3 CGI/intron 2 %
Change in m
et hy lat io n at LTF
CGI/exon 1
%
Change in m
et hy lat io n at ELANE
CGI/exon 2
35
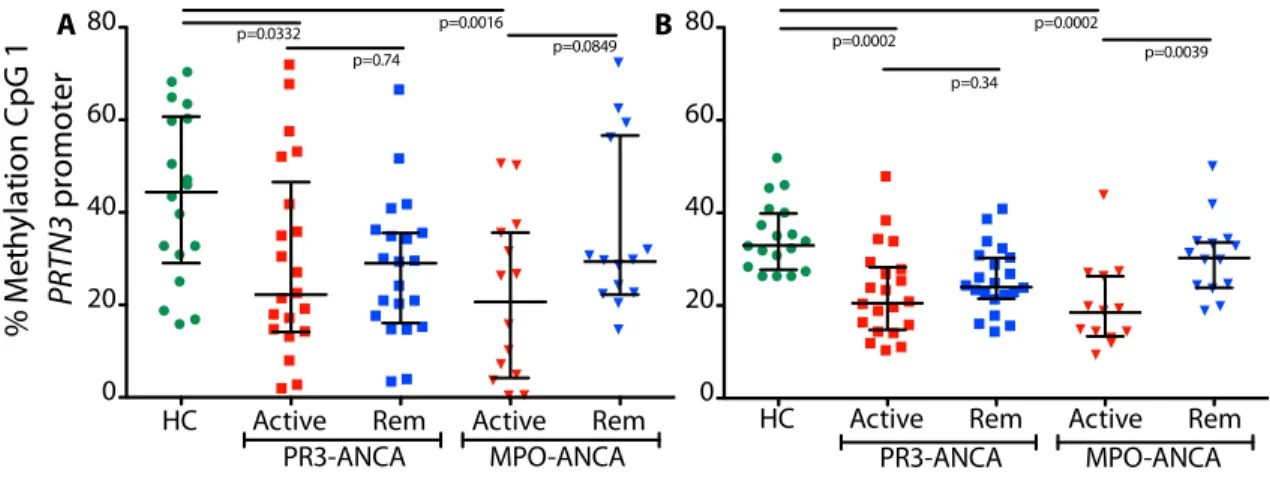
Figure 1.6. DNA methylation platform comparison. Bisulfite sequencing compared to MassARRAY. (A) Cross-sectional methylation at CpG 1 PRTN3 promoter for (A) bisulfite sequencing and (B) MassARRAY. Green circles are healthy controls; squares are PR3-ANCA patients; triangles are MPO-ANCA patients; active patients are red and patients in remission are blue. Bars are median and interquartile range for all three graphs; p<0.0125 is considered significant, accounting for multiple testing.
Correlation of mRNA expression with DNA methylation
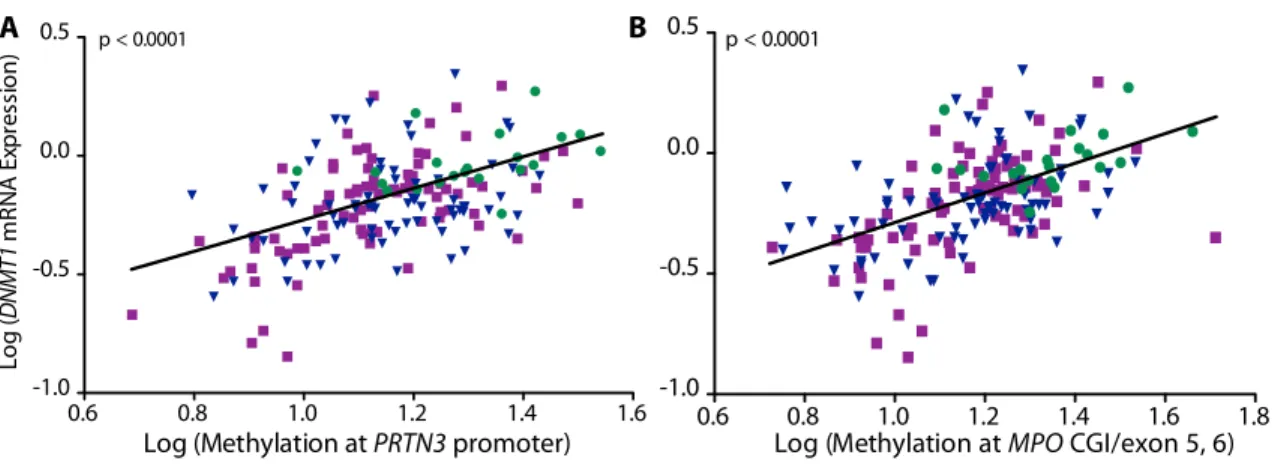
I compared the level of DNMT1 expression to DNA methylation measured at MPO and PRTN3 to confirm the association found in the genome-wide DNA methylation data. DNMT1 mRNA expression correlated positively with DNA methylation at all four loci (r= 0.4858 at PRTN3 promoter; r= 0.5464 at MPO CGI/exon 5-6; p<0.0001) (Figure 1.7). MPO and PRTN3 mRNA expression were measured to determine if expression of autoantigen genes were regulated by DNA methylation. There is a significant correlation between DNA methylation within MPO and PRTN3 and mRNA expression of these respective genes (PRTN3 promoter r= -0.2828; MPO CGI/exon 5-6 r= -0.3155; p<0.0001) (Figure 1.8). The correlation of
cross-% M et hy la tio
n CpG 1
PRTN3
promoter
Supplementary Figure 4
B A
Bisulte Sequencing MassArray
0 20 40 60 80
HC Active Rem Active Rem 0
20 40 60 80
p=0.0002 p=0.0002 p=0.0039 p=0.34
PR3-ANCA MPO-ANCA HC Active Rem Active Rem
0 20 40 60
80 p=0.0332 p=0.0016
p=0.0849 p=0.74
36
sectional measurements suggests that DNA methylation in total leukocytes has a minor influence on expression of these autoantigen genes; however, following patients longitudinally may be more valuable than measuring expression and methylation at a single point in time.
Figure 1.7. Correlation of DNA methylation and mRNA expression at DNMT1. Healthy controls (green circles); MPO-ANCA patients (blue triangles) and PR3-ANCA patients (purple squares). Log transformed correlation between methylation at the (A) PRTN3 promoter and DNMT1 expression (n=179; r= 0.4858) and (B) correlation between methylation at MPO CGI/exon 5-6 and DNMT1 expression (n=177; r= 0.5464).
Supplementary Figure 2
A B
C D
HC Active Rem Active Rem
0 10 20 30 40 50
PR3-ANCA MPO-ANCA
p<0.0001 p<0.0001 p=0.0003
p=0.0884
HC Active Rem Active Rem 0
20 40 60
PR3-ANCA MPO-ANCA
p<0.0001 p<0.0001 p=0.0004
p=0.1782 0 10 20 p=0.0002 p=0.4260 0 10 20 ng e in M et hy la tio
n p=0.1754 p<0.0001
% M et hy lat io n
Supplementary Figure 3
A
0.6 0.8 1.0 1.2 1.4 1.6
-1.0 -0.5 0.0 0.5 Lo g ( D N M T1 m RN A E xp re ss io
n) p < 0.0001
0.6 0.8 1.0 1.2 1.4 1.6 1.8 -1.0
-0.5 0.0
0.5 p < 0.0001 B
37
Figure 1.8. Correlation of DNA methylation and mRNA expression at PRTN3 and MPO. Total leukocytes from healthy controls (green circles); MPO-ANCA patients (blue triangles) and PR3-ANCA patients (purple squares). Log transformed correlation between DNA methylation at the (A) PRTN3 promoter and PRTN3 expression (n=187; r= -0.2828) and (B) DNA methylation at MPO CGI/exon 5-6 and MPO expression (n=186; r= -0.3155).
Longitudinal DNA methylation studies uncover two distinct patterns in AAV patients
I hypothesized that methylation changes relate to disease status in patients with AAV; to this end, I measured DNA methylation in paired patient samples collected an average of 18 months apart and quantified the difference in methylation (remission minus active methylation) at loci within MPO and PRTN3. At the PRTN3 promoter, the mean change in DNA methylation is comparable between PR3-ANCA patients (3.62%) and MPO-ANCA patients (3.99%) and significantly different from zero (p=0.0003 and 0.0007, respectively) (Figure 1.9A). These data indicate that most patients exhibit increased DNA methylation at the PRTN3 promoter upon disease remission, regardless of serotype. At other loci, changes in DNA methylation status depended on serotype. At the MPO CGI/exon 5-6, the mean DNA methylation change in
MPO-A
Figure 4
0.6 0.8 1.0 1.2 1.4 1.6
-1.0 -0.5 0.0 0.5 Lo g (D N M T1 m RN A E xp re ss io
n) p < 0.0001
0.6 0.8 1.0 1.2 1.4 1.6 -2 -1 0 1 2 3 4
Log (Methylation at PRTN3 promoter)
Lo g ( PRT N 3 m RN A E xp re ss io n)
p < 0.0001
0.6 0.8 1.0 1.2 1.4 1.6 1.8
-1.0 -0.5 0.0
0.5 p < 0.0001
0.6 0.8 1.0 1.2 1.4 1.6 1.8 0
1 2 3 4
Log (Methylation at MPO CGI/exon 5, 6)
L og ( M PO m RN A Ex pr essi on
) p < 0.0001
B
A
ANCA patients is similar to that at the PRTN3 promoter (4.36%) but not in PR3-ANCA patients (1.85%) (p=0.0008 and 0.12, respectively) (Figure 1.9B). Similarly, changes in DNA
methylation at both PRTN3 CGI/exon 5 and MPO CGI/exon 7 were significantly different from zero in MPO-ANCA patients, but not different from PR3-ANCA patients (Figure 1.4C,D).
39
Figure 1.9. Longitudinal change in DNA methylation from disease activity to remission. Mean and standard deviation shown; p-values are as different from zero, where p<0.025 is significant after accounting for multiple testing. PR3-ANCA patients are squares and MPO-ANCA patients are triangles. Mean DNA methylation change at the (A) PRTN3 promoter: PR3-ANCA patients 4.03%, MPO-ANCA patients 3.69% and the (B) MPO CGI/exon 5-6: PR3-ANCA patients 3.06%, MPO-ANCA patients 4.93%.
Figure 5
A B
PR3-ANCA MPO-ANCA
-10 0 10 20
%
C
ha
ng
e
in
M
et
hy
la
tio
n
p=0.0007 p=0.0003
PR3-ANCA MPO-ANCA
-20 -10 0 10
Figure 1.10. DNA methylation changes at individual CpGs within the PRTN3 promoter and MPO CGI/exons 5-6. Green circles are healthy controls; squares are PR3-ANCA patients; triangles are MPO-ANCA patients; active patients are red and patients in remission are blue. Bars shown are median with interquartile range; p<0.0125 is significant after accounting for multiple testing. Cross-sectional methylation at (A) CpG 7, 8 PRTN3 promoter and (B) CpG 38 MPO CGI/exons 5-6. Mean longitudinal methylation change from disease activity to remission at (C) CpG 7, 8 PRTN3 promoter: PR3-ANCA patients 3.85%, MPO-ANCA patients 5.57% and (D) CpG 38 MPO CGI/exons 5-6: PR3-ANCA patients 2.11%, MPO-ANCA patients 5.95%. For longitudinal graphs, p-values shown are as different from zero where p<0.025 is significant after accounting for multiple testing, bars are mean and standard deviation.
A
Supplementary Figure 6
B
C D
HC Active Rem Active Rem 0 20 40 60 % M et hy lat io n p<0.0001 p<0.0001 p=0.0181 p=0.0005
PR3-ANCA MPO-ANCA HC Active Rem Active Rem 0
20 40 60
p<0.0001 p<0.0001 p=0.0866 p=0.0009
PR3-ANCA MPO-ANCA
PR3-ANCA MPO-ANCA -40
-20 0 20
40 p=0.0799 p=0.0057