Australian Journal of Basic and Applied Sciences
Journal home page: www.ajbasweb.com
Corresponding Author: Siti Zubaidah Mohd Tumari, Universiti Teknologi Malaysia, Department of Computer and Electrical Engineering, Faculty of Electrical Engineering, Skudai, Johor Bahru, Malaysia.
Children’s Behavioural and Visual Stimulation for Working Memory Impairments
Analysis
1Siti Zubaidah Mohd Tumari and 2Rubita Sudirman
1,2Universiti Teknologi Malaysia, Department of Computer and Electrical Engineering, Faculty of Electrical Engineering, Skudai, Johor Bahru, Malaysia.
A R T I C L E I N F O A B S T R A C T
Article history:
Received 10 October 2015 Accepted 30 November 2015 Available online 31 December 2015
Keywords:
Working Memory; Visual Stimulation; SPSS; Behavioural; Cognitive
Background: This study mainly focused on the children’s behavioural and visual stimulation to detect the ability of children’s working memory if there were any impairment occurs. 97 children between 7 to 12 years old are subjected into two-phases of visual stimulation (Phase 1 and Phase 2). The children need to remember the sequence of the picture for a short period of time given. While, their performance scores in working memory were recorded using SPSS software. Objective: The significance of this study is to understand the causes of working memory impairments in normal children by investigating cognitive processes and brain activity towards visual stimulation. Results: Result indicated that the performance score for each group on Phase 2 have an impaired working memory when their age decreases: 7 years old (93.3%), 8 (92.3%), 9 (92.3%), 10 (100%), 11 (100%), and 12 (100%). Conclusion: These findings supported the assumption that younger children (7 to 9 years old) have working memory impairment.
© 2015 AENSI Publisher All rights reserved. To Cite This Article: Siti Zubaidah Mohd Tumari and Rubita Sudirman., Children’s Behavioural and Visual Stimulation for Working Memory Impairments Analysis. Aust. J. Basic & Appl. Sci., 9(37): 191-197, 2015
INTRODUCTION
Nowadays, there are an increasing number of children facing short term memory impairments. This is a kind of mental disorder that refers to the condition where the working brain is able to retain information consciously for a short period of time (in a few seconds) (Potagas et al., 2011). Working memory impairments among normal children can be evaluated through physician observation and based on their performance in the classroom. Hence, this assessment sometime can lead to human error which the teacher cannot identify accurately because of child’s society. Thus, the difficulties of normal children who impair with working memory development may have faulty.
Human are able to store about 1 to 10 items for a short period of time in active state for about 0 to 60 seconds, depending on the individual cognitive memory capacity (Potagas et al., 2011). In addition, working memory capacities can increase with age. For example, younger children (4 to 7 years old) have smaller working memory capacity than children age 8 to 12 years old (Bull et al., 2009). It is because some children have difficulties in memorizing and manipulating a given problem for a short time period. Various aspects of children’s working memory impairments have created in special attention in
child’s development. Still there is no common standard for working memory impairment evaluation among normal children. This study will introduce some of the related research that using different assessment as an experimental paradigm and the proposed visual stimulation occurs of this study.
One of the crucial issues in memory is tantamount to classify the relevant frequency bands, at which frequency bands the memory performance give more information. The working memory ability might be different based on specific factors such as age, arousal and the type of cognitive demands during stimuli performances. Working memory performance states have been studied for almost 19 years, but the result focus on the abnormal children such as (Attention Deficit Hyperactivity Disorder (ADHD), autism, epilepsy, obesity and dementia) rather than normal children development. Until now, researchers only take normal subject as control group, and make a comparison to a diagnosed disease for working memory performance. But they do not realize that among the control group (normal children), there also have been problems between children, i.e. not all normal children have a good working memory.
subjected the children aged 6 to 11 years old with reading disabilities as a subject to record the working memory performance. Otero et al. (2008) selected the children between 8 to 10 years old, subjects diagnose have iron deficit. The selection of these subjects is hypothesized that have an impairment exist in working memory and diagnose of iron deficient still occur after taking the supplementation. In 2009, Alloway et al. (2009) explored the cognitive processes of children with low working memory scores (5 to 11 years old). The criteria of children were judged to have low working memory consists of their skills on IQ, vocabulary, reading, mathematics, and classroom behaviour.
Contrast in 2010, Van der Molen (2010) selected children aged 9 to 12 years old with mild to borderline intellectual disabilities (MID) attending special schools as a subject. Subjects will be diagnosed by psychiatrists to specify their attention disorder to acknowledge their specific working memory strengths and weaknesses. Currently in 2014, Vugs et al. (2014) used young children (4 and 5 years old) with specific language impairment (SLI) to compare their performances with typically developing (TD) children on cognitive measures of working memory. Any children with a diagnosed hearing impairment, ADHD, autism spectrum disorder and neurological disorder were excluded.
It is questionable why children are rearranged at various classrooms, even though they had no previous record on working memory disabilities. For example, teachers organized the children who have a good result in academic and curriculum will be included in the first classroom. Meanwhile the children who have moderate result in academic will be included in the next classroom. In psychological records, the children who are in the last classroom do not have a problem with working memory, might be they slow in their academic education because of their environment. The motivation for the present research is to obtain a normative database for pictorial material that will be helpful in future studies with normal children as a main subject.
In order to distinguish this problem, the sensory responsiveness focuses on the visual responsiveness were given to the normal children. The stimulus is a tool to investigate the responses of abnormal levels of brain activity while remembering sequence of pictures. Visual stimulation towards working memory involves processes of manipulating familiar objects and new objects. Those sensory modulations of visual stimuli are given toward normal children population to explore the significant difference of working memory performance. The children’s responsiveness to visual stimuli concerns their ability to interpret the surrounding environment after processing the information that is reflected in visible light. By using visual stimuli, the behavioral and neuronal consequences of reflexive orienting were investigated (Bell et al., 2004). Present research in
2011, Alloway et al. (2011) investigated the contribution of working memory and verbal ability to mathematical skills in children (7 and 8 years old). The results showed that there have been slight different of pattern regression and no age difference between tasks. Besides, this research was not being able to relate the contributions of working memory and mathematics.
Clearly, the characterization of working memory impairment among normal children is still requiring many aspects of improvement. Regarding on previous research, the assessment that already used is hand by hand assessment, i.e. the task was distributed to the subjects literally. Even-though, there are several using visual stimuli, but the disadvantages of their research are, they cannot relate the relationship between working memory performance and visual stimuli. Thus, this study proposed an alternative to investigate if there is significant difference between working memory based on visual responsiveness. Besides, this study focused on more children developmental background which is between 7 to 12 years old inclusive. Thus, this study is to explore the potential of sensory responsiveness through visual stimulation techniques to train children cognitive on remembering thing.
MATERIALS AND METHODS
A. Children Behavioural:
97 children aged 7 to 12 years old volunteers from primary schools are designated in this study which comprised of 57 boys and 40 girls. They had no previous history of neurological and mental abnormalities. Interviews were held with their teachers in the pre-study stage to understand the ability and performance of children in the classroom. The outcome of the pre-study concluded that, 60 subjects have good result, and 37 subjects have moderate result in their academics. Then, a few questions were asked to the subjects regarding their impression on their performance at school. Questionnaires were also taken to support the pre-stimulus results.
B. Research Design and Procedure:
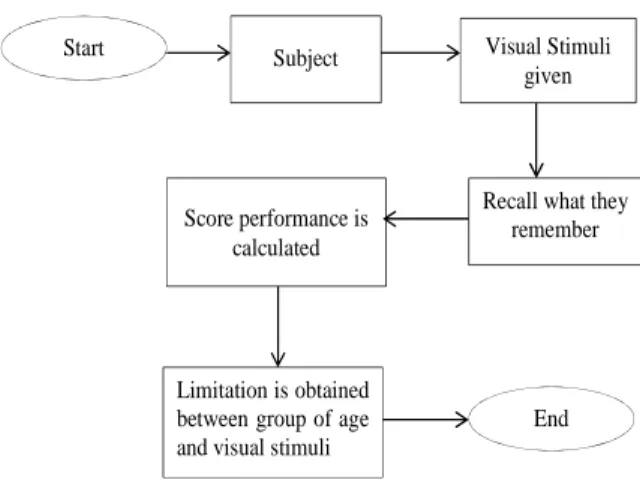
developmental trending is obtained between age and visual stimulation. The aim of this stage is to investigate if there are any significant difference or
not between a group of age with visual stimuli phases (Phase 1 and Phase 2).
Subject Visual Stimuli given
Recall what they remember
Limitation is obtained between group of age and visual stimuli
Score performance is calculated Start
End
Fig. 1: Workflow of the Study
C. Visual Stimulation Model:
The proposed visual stimulus is used to avoid the parallax error of time during the visual assessment that was given in term of screening tools. Screening tools are used to represent several pictures to display the task. The simulation of screening tools which are visual stimuli was implemented by using MATLAB software. Graphic User Interface (GUI) is implemented to visualize and control the display in order to synchronize the operation and to record the response times. This screening tool is designed for two-phases that will help the children to easily understand contain of assessments and user friendly. Phase 1 namely as the study phase which contains of 4 pictures, while Phase 2 namely as the working
memory test phase contains of 7 pictures.
Fig. 2 shows the flow chart structure for the proposed screening tools to visualize on the screen monitor in the simplest illustration. Firstly, Graphics User Interface (GUI) is used to design the pushbutton to allow the user start at the beginning of the visualization and exposed the picture sequence. After that, the imshow function was expected to show the object on the screen. By using imread function, the image will be displayed on the screen by clicking the pushbutton either Phase 1 or Phase 2 provided on the GUI and illustrate the picture one by one at a fixed period. Finally, the study phase will stop after repeated twice.
Fig. 2: Flow chart structure for the screening tools
D. Behavioural Assessment: Visual Stimuli and Procedure:
The subject was given two-phases of assessment
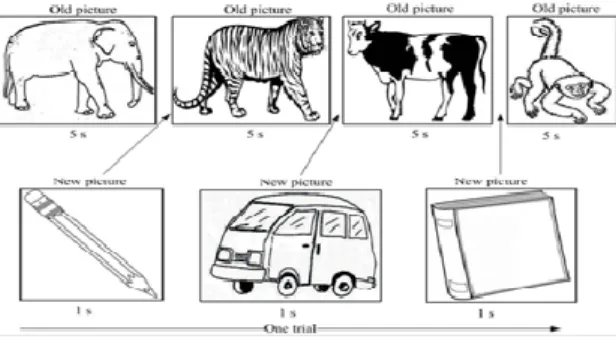
were given four black and white equally sized pictures (elephant, tiger, cow, and monkey) in a sequence is illustrated in Fig. 3. They were asked to focus their eyes on the computer monitor and follow the instructions given by the examiner as well as the stimulus program. The stimulus program will ensure that the periods of the displays during the test are uniform for all subjects. The task started with the white block on the screen as a fixation for 1 second, followed by the sequential presentation of four
different animal pictures. Each picture was shown about 5 seconds and repeated twice. Each picture has a same grid position 4 × 4 block pictures with the width and height of an picture in centimetre, 13 cm (width) × 10 cm (height) from the fixation screen. The screen will be automatically back into the fixation block (white colour) after all pictures were presented. After that, their ability to remember all the pictures, either in sequence or not, was tested and recorded.
Fig. 3: Phase 1: The study phase shows 4 different pictures (old pictures) in black and white model
Then, they were given next assessment which is Phase 2 (the working memory phase) as shown in Fig 4. In this phase, the subject needs to remember 7 pictures of old and new pictures. A fixation picture (new picture) will be presented for a maximum of 1 s between any two old pictures. The purpose of new
picture is to interrupt the subject to remember the sequence of pictures. Each subject must be mandated to response as quickly and accurately as possible. The subjects were given time to memorize the sequence pictures.
Fig. 4: Phase 2: The Working Memory Test Phase shows 4 sample target (old pictures) and 3 new sample targets (new pictures)
RESULTS AND DISCUSSION The mean performance percentages were applied to the correct responses through the two-phase stimuli for a group of age (7, 8, 9, 10, 11, and 12 years old). Mean performance was analyzed based on the total score for each assessment. This score was collected when the children recalled the sequence of the pictures. The score of performance was divided into two variables (1: if the subject can answer correctly the name of pictures in array; 2: if the subject cannot answer correctly). Analysis of scoring performances was done using Microsoft Excel to compute the percentage of each picture in an array. The mathematical equation has been formulated to analyze the scoring of mean performance per picture as in (1):
number of correct pictures
100
Total bumber of subject for each group
Total
×
(1)(elephant) in array that can answer correctly is ((14 ÷ 15) × 100) = 93.3 %, second picture (pencil) is ((11 ÷ 15) × 100) = 73.3 %.
Another alternative statistical analysis was used to prove that the mean performance scores were calculated correctly using Microsoft Excel. Statistical Product and Service Solutions (SPSS) software is used to analyze the scoring according to the picture in an array for each group. The SPSS is software that is familiar with statistical agreement which can perform highly complex data manipulation and analysis with simple instruction (Pallant, 2005).
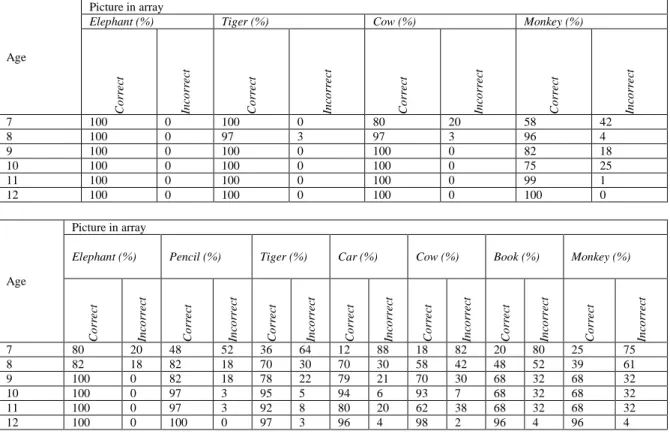
Table I and Table II show the score of mean performance of the subject towards the all stimulus: SPSS output for Phase 1 and Phase 2. The SPSS computed score for mean performance visual stimulus representation for Phase 2; 7 years old (93.3 %), 8 (92.3 %), 9 (92.3 %), 10 (100 %), 11 (100 %), and 12 (100 %).
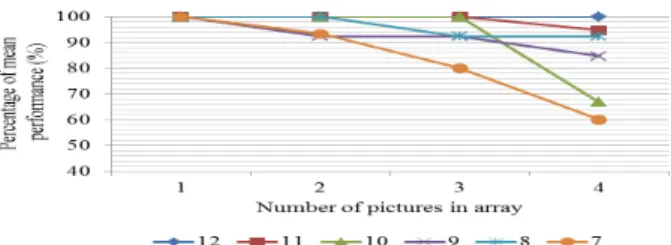
Regarding on the analysis, the mean percentages of correct responses on change trials for each age group and array picture are presented in Fig. 5 for Phase 1, Fig. 6 for Phase 2, and Fig. 7 shows the average mean for both phases. Fig. 5 shows the Phase 1 output, there was no significant difference for the first three pictures, all subjects in each group can remember accurately, but for the fourth array picture, the mean performances diverged
significantly for the 7 years old. Meanwhile, for children of 12 years old, their working memory performances maintained until the end of the session. The result contrasted with the second phase is shown in Fig. 6. The children tend to working memory impaired in the second array pictures and 7 years old shows drastic divergence for the fourth array picture. Within the age groups, the performance of 12 years old showed maintains result with the seven array pictures. Even though there have several subject cannot complete the task appropriately, but between groups, 12 years old subject give a good performance. It can be seen that the mean performance of the task improved with age and for all age groups, the mean performance decreased as array size increased. This decrease was most marked in the youngest children and the least for the oldest children.
Fig. 7 shows that percentage of mean performance changes is detected by group of age at a combination of visual stimulus. By comparing the results between Phase 1 and Phase 2 stimuli, the 7 years old children were indicated to have working memory impairment when the number of stimuli increased. While 12 years old children performed well even though the occurrence of visual stimuli in the assessment was increasing.
Age
Picture in array
Elephant (%) Tiger (%) Cow (%) Monkey (%)
C o rr ec t In co rr ec t C o rr ec t In co rr ec t C o rr ec t In co rr ec t C o rr ec t In co rr ec t
7 100 0 100 0 80 20 58 42
8 100 0 97 3 97 3 96 4
9 100 0 100 0 100 0 82 18
10 100 0 100 0 100 0 75 25
11 100 0 100 0 100 0 99 1
12 100 0 100 0 100 0 100 0
Age
Picture in array
Elephant (%) Pencil (%) Tiger (%) Car (%) Cow (%) Book (%) Monkey (%)
C o rr ec t In co rr ec t C o rr ec t In co rr ec t C o rr ec t In co rr ec t C o rr ec t In co rr ec t C o rr ec t In co rr ec t C o rr ec t In co rr ec t C o rr ec t In co rr ec t
7 80 20 48 52 36 64 12 88 18 82 20 80 25 75
8 82 18 82 18 70 30 70 30 58 42 48 52 39 61
9 100 0 82 18 78 22 79 21 70 30 68 32 68 32
10 100 0 97 3 95 5 94 6 93 7 68 32 68 32
11 100 0 97 3 92 8 80 20 62 38 68 32 68 32
Fig. 5: Percentage of mean performance changes is detected by group of age for each picture in an array for Phase 1
Fig. 6: Percentage of mean performance changes is detected by group of age for each picture in an array for Phase 2
0 20 40 60 80 100
12 11 10 9 8 7
P
er
ce
nt
ag
e
of
m
ea
n
pe
rf
o
rm
an
ce
(%
)
Group of age (Years old)
Phase 2 Phase 1
Fig. 7: Percentage of mean performance changes is detected by group of age at a combination of visual stimulus; Phase 1 and Phase 2
Conclusions:
In conclusion, working memory is only a part of cognitive development but there is promising future approaching this field. For this proposed behavioural and visual stimulation, scope of the study has been scaled down in selecting normal children that is between 7 to 12 years old. Furthermore, the proposed visual stimulus using numerous old and new pictures is designed before commencing the experiment, This study also discussed the developmental trends by age difference, whether normal children with no working memory difficulties have a working memory deficit or not. By using standardized proposed visual stimuli model for all groups, their scores for mean performances were recorded after the stimulus responses. 97 children were compared among a group of children of various ages, with 7 years old children performed worse on Phase 2 with a score of 37 %.
More importantly, 7 years old children performed worse than the older children (12 years old: 95 %), whereas all groups had the worst score on the inter-stimulus task (representing for 1 second). Compared to the age-differentiate controls, both phases (Phase 1 and Phase 2) performed significantly worse on a second picture in an array. Both phases
obtained significantly lower scores on the second picture in an array, with average for all ages (Phase 1: 99.5 %, Phase 2: 84.33 %) than first picture in array (Phase 1: 100 %, Phase 2: 93.7 %).
These findings supported the assumption that younger children (7 to 9 years old) have working memory impairment. Thus, working memory performance and behavioural rating correlate significantly by age for normal children deficit in visual stimuli assessment. Overall, this study has provided empirical evidence in support for the assumption that normal children have working memory impaired in young children through visual stimuli assessment. For future study, the analysis of development trend will be compared with the Event-Related Potential (ERP) signal while remembering the sequence of the pictures.
ACKNOWLEDGMENT
Teknologi Malaysia for its facilities and funding this study under research grant with vote no. 4S094.
REFERENCES
Alloway, T.P., and M.C. Passolunghi, 2011. The Relationship Between Working Memory, IQ, and Mathematical Skills in Children, Learning and Individual Differences, 21(1): 133-137.
Alloway, T., and S. Gathercole., 2009. The Cognitive and Behavioral Characteristics of Children with Low Working Memory. Child Development, 80(2): 606-621.
Bell, A.H., J.H. Fecteau and D.P. Munoz, 2004. Using Auditory and Visual Stimuli to Investigate the Behavioral and Neuronal Consequences of Reflexive Covert Orienting, Journal of Neurophysiology, 9(15): 2172-2182.
Bull, R., K.A. Espy and S.A. Wiebe, 2009. Short-Term Memory, Working Memory and Executive Functioning in Pre-schoolers: Longitudinal Predictors of Mathematical Achievement at Age 7 Years. Developmental Neuropsychology, 33(3): 205-228.
Gathercole, S.E., T.P. Alloway, C. Willis and A.-M. Adams, 2006. Working Memory in Children
with Reading Disabilities. Journal of Experimental Child Psychology, 93(3): 265-281.
Otero, G.A., F.B. Pliego-Rivero, R. Porcayo-Mercado and G. Mendieta-Alcántara, 2008. Working Memory Impairment and Recovery in Iron Deficient Children. Clinical Neurophysiology : Official Journal of the International Federation of Clinical Neurophysiology, 119(8): 1739-1746.
Pallant, J., 2005. SPSS Survival Manual: A Step by Step Guide to Data Analysis using SPSS for Windows, 1st Ed., McGraw-Hill: England.
Potagas, C., D. Kasselimis and I. Evdokimidis, 2011. Short-term and Working Memory Impairments in Aphasia. Neuropsychological, 49(10): 2874-2878.
Swanson, H.L. and V. Berninger, 1995.The Role of Working Memory in Skilled and Less Skilled Readers’ Comprehension. Intelligence, 21(21): 83-108.
Van der Molen, M.J., 2010. Working Memory Structure in 10- and 15-year Old Children with Mild to Borderline Intellectual, Disabilities, Research in Developmental Disabilities, 31(6): 1258-1263.