FATTY ACIDS AND EXECUTIVE FUNCTIONS: BEHAVIORAL PERFORMANCE AND CORTICAL ACTIVATION ACROSS THE LIFESPAN
Kelly Will Sheppard
A dissertation submitted to the faculty at the University of North Carolina at Chapel Hill in partial fulfillment of the requirements for the degree of Doctor of Philosophy in the Department of Psychology
and Neuroscience (Developmental Psychology).
Chapel Hill 2016
iii ABSTRACT
Kelly Will Sheppard: Fatty Acids and Executive Functions: Behavioral Performance and Cortical Activation Across the Lifespan
(Under the direction of Carol L. Cheatham)
An imbalance in the omega-6 to omega-3 fatty acid ratio may be a preventable contributor to cognitive deficits across the lifespan. Omega-6 and omega-3 fatty acids are integral to neuronal growth and communication in the hippocampus and frontal cortex, brain areas that subserve executive functions (EF). EF are higher order cognitive functions that control thoughts, behaviors, and emotions. The present study focused on how the balance of omega-6 and omega-3 fatty acids contributes to EF in children 7 to 12 years old and older adults 65 to 79 years old. One hundred fifty-two children were screened for their omega-6 and omega-3 fatty acid intake using three 24-hour diet recalls, and 78 children representing equal recruitment of nine fatty acid intake patterns completed standardized measures of memory, working memory, and planning and one novel planning task, the Electric Maze Task (EMT). Near-infrared spectroscopy (NIRS) data were also collected. Eighty-eight older adults recruited for a study of cognitive decline also completed standardized measures of memory, working memory, and visual processing.
iv
ACKNOWLEDGEMENTS
I would like to acknowledge my advisor Dr. Carol L. Cheatham. Thank you for your advice and support through every project, every paper, and every existential “why am I here” moment from my first days in graduate school. Thank you for providing the push I needed to move forward with my writing and research, and for being there to talk me through each obstacle. Thank you for believing in me, and thank you for helping me through every step of this dissertation. Thank you to my dissertation committee: Dr. J. Steven Reznick, Dr. Peter A. Ornstein, Dr. Barbara Goldman, and Dr. Joe Hopfinger. Thank you for all of the wonderful advice and help throughout this process. Thank you to the members of the Cheatham Lab over the years, and in particular to Andrea Armer, Julie Stegall, Grant Canipe, Grace Millsap, Kim Adams, Christa Turski, and Fran Bullard. Thank you for helping me create the mazes and letting me practice NIRS data collection with you. Thank you for grouping my participants for me to keep me blind to their diets and for helping me recruit all over Kannapolis. Thank you, most of all, for the many laughs through all the successes and setbacks. I certainly wouldn’t have had this much fun without you. Thank you to the faculty, students, and staff at the Nutrition Research Institute and the Department of
v
TABLE OF CONTENTS
LIST OF TABLES……….. vi
LIST OF FIGURES………... viii
LIST OF ABBREVIATIONS………... ix
CHAPTER 1: INTRODUCTION………. 1
The omega-6 to omega-3 fatty acid ratio………. 3
Competition for resources………... 4
Omega-6 and omega-3 fatty acids in the brain…….……….. 5
Fatty acids and cognitive function……….. 7
The omega-6 to omega-3 fatty acid ratio and executive functions……… 12
What is the executive……… 14
Inhibitory control and fatty acids……….. 18
Working memory and fatty acids……….. 21
Planning and fatty acids……… 24
CHAPTER 2: METHODS……….. 30
Procedures……….. 31
7- to 12-year-olds……….. 31
65- to 79-year-olds……… 36
CHAPTER 3: RESULTS……… 39
Validating the Electric Maze Task .………...…… 40
The ratio and lifespan cognitive function ……….… 43
The ratio, cortical activation, and behavioral performance………...… 48
CHAPTER 4: DISCUSSION……….…. 58
TABLES……….……. 67
FIGURES……….. 102
APPENDIX 1: VALIDATING THE ELECTRIC MAZE TASK...……….………. 116
vi
LIST OF TABLES
Table 1. Descriptive statistics for a) 7- to 12-year-olds and b) 65- to 79-year-olds………... 67
Table 2. 7- to 12-year-old participant recruitment strategy and final sample diet characteristics……….. 69
Table 3. 65- to 79-year-old final sample diet characteristics……….. 70
Table 4. Cronbach’s alphas for maze variables for the entire sample and by age group……… 71
Table 5. Maze performance and independent samples t-test age group comparisons……… 72
Table 6. Performance after manipulations for the entire sample and by age group……… 74
Table 7. Correlations between maze performance and standardized measures of executive functions……… 75
Table 8. Age group comparisons for CANTAB tasks for a) children and b) older adults……….………. 76
Table 9. Relation between the ratio, omega-6 intake, and omega-3 intake predicting total errors made on the PAL task in 75- to 79-year-olds……….. 77
Table 10. Relation between the ratio, omega-6 intake, and omega-3 intake predicting mean time to first response on 4-box SWM problems in 75- to 79-year-olds………... 78
Table 11. Interaction between the ratio and omega-3 intake predicting mean time to first response on SWM 4-box problems in 75- to 79-year-olds………. 79
Table 12. Relation between the ratio, omega-6 intake, and omega-3 intake predicting mean time to first response on the 4-box SWM problems in 65- to 69-year-olds………. 80
Table 13. Interaction between the ratio and omega-6 intake and the ratio and omega-3 intake predicting A’ on the RVP task and total between errors on the SWM task in 65- to 69-year-olds………. 81
Table 14. Relation between the ratio, omega-3 intake, and omega-6 intake predicting mean moves on the 5-move SOC problems………... 82
Table 15. Relation between the ratio and omega-3 intake predicting the mean moves on the 5-move SOC problems in 7- to 9-year-olds……….… 83
Table 16. Relation between the ratio and omega-3 intake predicting mean moves on the 5-move SOC problems in 10- to 12-year-olds………... 84
Table 17. Relation between the ratio and omega-3 intake predicting the latency to last error and errors made on 8-step mazes in 7- to 9-year-olds……… 85
Table 18. Summary of findings for the role of the ratio in EF……….………... 86
vii
Table 20. Correlations between SOC brain activity contrasts and SOC performance………….……..…. 88
Table 21. Correlations between 6-step and 8-step maze brain activity contrasts and
6-step and 8-step maze performance………..……… 89 Table 22. Correlations between SWM brain activity contrasts and SWM task performance……….….... 90 Table 23. Age group differences in brain activity across tasks………... 91 Table 24. The ratio and omega-3 predicting 3-move SOC brain activity in the
right prefrontal cortex in 7- to 9-year-olds……….… 92 Table 25. The ratio and omega-6 predicting 3-move SOC brain activity in the
left prefrontal cortex in 10- to 12-year-olds……….….. 93 Table 26. The ratio and omega-3 predicting 5-move compared to 3-move SOC
brain activity in the right prefrontal cortex in 10- to 12-year-olds………... 94 Table 27. The ratio and omega-6 predicting 5-move compared to 3-move
SOC brain activity in the left and right prefrontal cortex in 10- to 12-year-olds………... 95 Table 28. The ratio and omega-6 predicting 6-step EMT brain activity in the left
prefrontal cortex in 7- to 9-year-olds……….… 96 Table 29. The ratio and omega-6 predicting 8-step compared to 6-step EMT
brain activity in the central prefrontal cortex in 10- to 12-year-olds………... 97 Table 30. The ratio and omega-3 predicting rule switch EMT brain activity in the
left, central, and right prefrontal cortex in 7- to 9-year-olds………..… 98 Table 31. The ratio and omega-3 predicting rule switch EMT brain activity in the
left, central, and right prefrontal cortex in 10- to 12-year-olds………..… 99 Table 32. The ratio and omega-6 predicting rule switch EMT brain activity in the
left, central, and right prefrontal cortex in 10- to 12-year-olds………...… 100 Table 33. Summary of findings for the ratio, cortical activation, and behavioral
viii
LIST OF FIGURES
Figure 1. The omega-6 and omega-3 fatty acid metabolic pathway……….……….... 102
Figure 2. The electric maze……….…….. 103
Figure 3. The dimensional change card sort manipulation of the electric maze……….….. 104
Figure 4. a) Standard prefrontal cortex array for near-infrared spectroscopy (NIRS) data collection; b) Graphical depiction of the basic premise of NIRS data collection……….……. 105
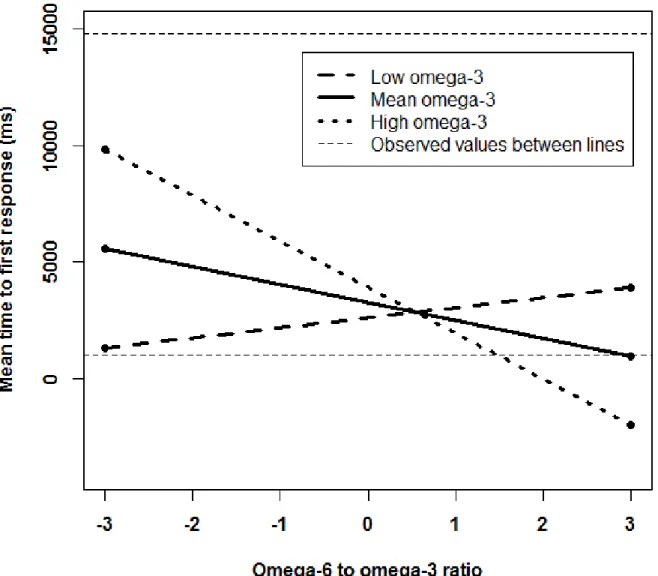
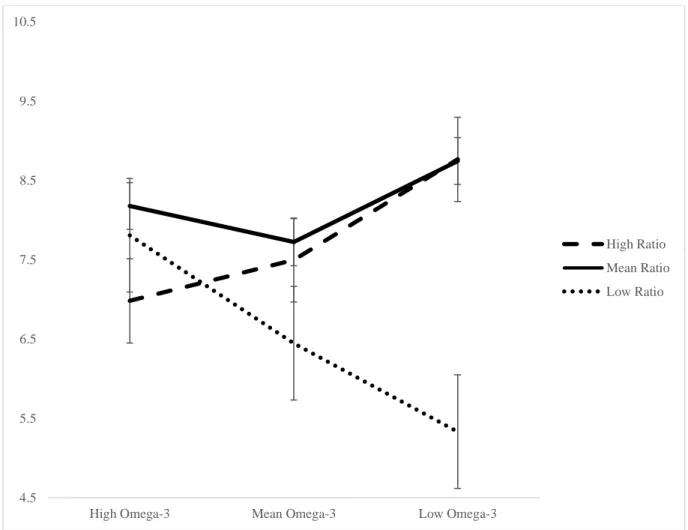
Figure 5. Simple slopes graph of significant interaction between the omega-6 to omega-3 ratio and omega-3 intake predicting mean time to first response on the 4-box SWM problems in 75- to 79-year-olds. The high omega-3 intake (n=6) slope is significant, the mean omega-3 intake (n=15) slope is a trend, and the low omega-3 intake (n=4) slope is not significant……….………. 106
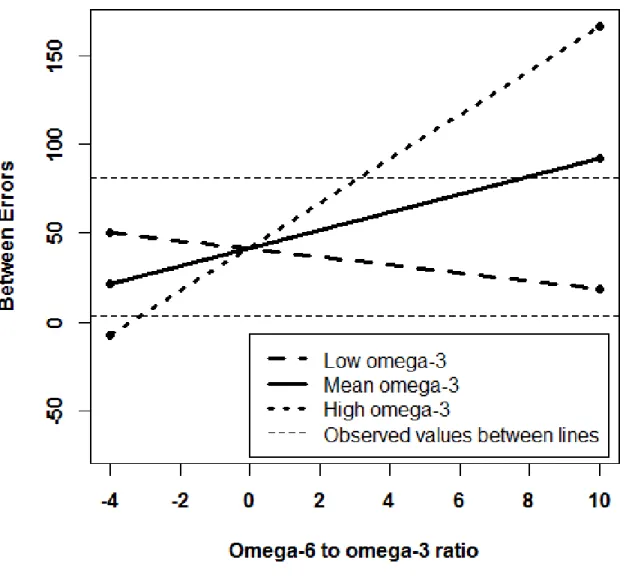
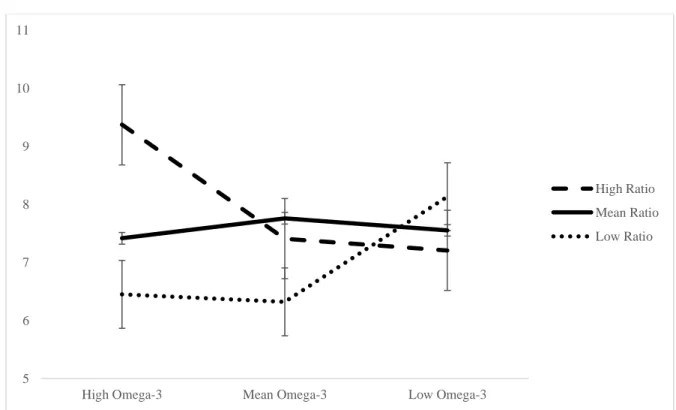
Figure 6. Simple slopes graph of the significant interaction between the ratio and omega-3 intake predicting total between errors on the SWM task in 65- to 69-year-olds. The high omega-3 intake (n=4) slope and the mean omega-3 intake (n=26) slope are significant. The low omega-3 intake (n=2) slope is not significant………..…….…. 107
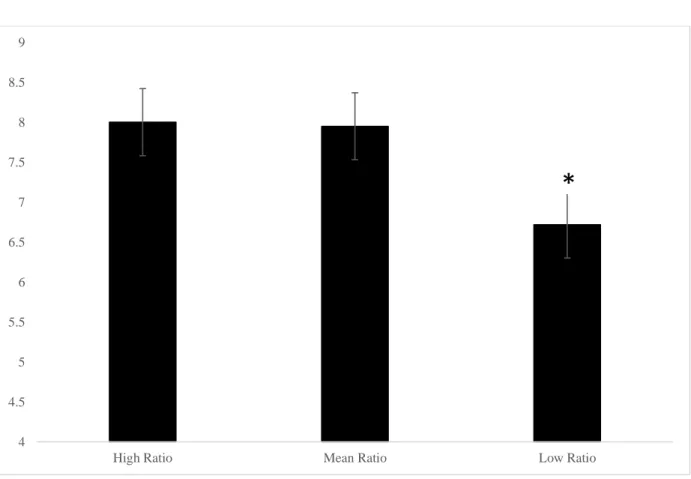
Figure 7. The omega-6 to omega-3 ratio predicting mean moves on the 5-move SOC problems in 7- to 12-year-olds. * p < 0.05, the low ratio group made fewer moves than the high and mean ratio groups……….… 108
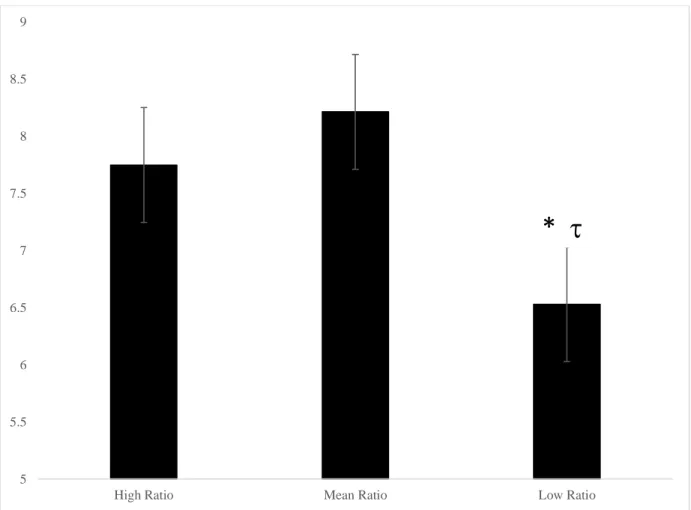
Figure 8. The omega-6 to omeag-3 ratio predicting mean moves on the 5-move SOC problems in 7- to 9-year-olds, * p < 0.05, p < 0.1, the low ratio group made significantly fewer moves than the mean ratio group and tended to make fewer moves than the high ratio group……….….. 109
Figure 9. Interaction between the ratio and omega-3 intake predicting mean moves on the 5-move SOC problems in 7- to 9-year-olds..……….… 110
Figure 10. Interaction between the ratio and omega-3 intake predicting mean moves on the 5-move SOC problems in 10- to 12-year-olds………... 111
Figure 11. Ratio group predicting latency to last error 8-step mazes in 7- to 9-year-olds……….... 112
Figure 12. Ratio group predicting errors made on 8-step mazes in 7- to 9-year-olds………... 113
Figure 13. Omega-3 group predicting errors made on 8-step mazes in 7- to 9-year-olds……… 114
ix
LIST OF ABBREVIATIONS ARA Arachidonic acid
CANTAB Cambridge Neuropsychological Test Assessment Battery DCCS Dimensional change card sort
dGLA di-Hommo-gamma linoleic acid DHA Docosahexanoic acid
EF Executive functions EPA Eicospentaenoic acid
LA Linoleic acid
LCPUFA Long-chain polyunsaturated fatty acids LNA Alpha-linolenic acid
LTP Long-term potentiation MWM Morris Water Maze
1
CHAPTER 1: INTRODUCTION
Fatty acids are important building blocks for neuronal membranes (Martinez & Mougan, 1998). The fatty acids incorporated into the membrane affect the neuron’s structure and function (Schairer & Overath, 1969). Omega-6 and omega-3 fatty acids are the most abundant fatty acids in the brain (Fraser, Tayler, & Love, 2010; Patel & Clark, 1980), and are found particularly in the frontal cortex and
hippocampus (Martinez, 1992). In these brain areas, the omega-6 and omega-3 fatty acids have been shown to affect neurotransmitter levels (Chalon, Vancassel, Zimmer, Guilloteau, & Durand, 2001; De La Presa Owens & Innis, 2000; Delion et al., 1997), receptor density and function (Davis et al., 2010; du Bois, Deng, Bell, & Huang, 2006; Zimmer et al., 2000), and neuronal growth (Auestad & Innis, 2000; Calderon & Kim, 2004). Despite a large literature on the role of fatty acids in neuronal structure and function, particularly in the frontal cortex and hippocampus, there hasn’t been a consensus as to the importance of fatty acids in brain function or cognitive development. In fact, the Cochrane review on fatty acid supplementation of infants born at term concluded there wasn’t enough evidence to state that fatty acids were beneficial to cognitive development (Simmer, Patole, & Rao, 2011).
The challenges of studying fatty acid supplementation are well-documented (for review: Cheatham & Colombo, 2006; Willatts & Forsyth, 2000). In particular, there is the need to use
2
Pennington, 1996). EF reliably activate the frontal cortex (Casey et al., 1995; Casey et al., 1997), giving the frontal cortex status as the ‘executive’. It coordinates input from many brain areas to formulate coherent responses in the face of complex cognitive, emotional, and behavioral needs. EF develop from early childhood into adulthood (Conklin, Luciana, Hooper, & Yarger, 2007; Pelphrey & Reznick, 2003), and EF such as working memory, inhibitory control, and planning are linked to theory of mind (S. M. Carlson & Moses, 2003; S. M. Carlson, Moses, & Breton, 2002; S. M. Carlson, Moses, & Claxton, 2004) and math and reading abilities (Bull, Espy, & Senn, 2004; Bull et al., 2008). There are many specific tests of EF across development, and the role of fatty acids in the frontal cortex indicate that the omega-6 to omega-3 fatty acid ratio may support EF development.
The balance of omega-6 and omega-3 fatty acids is one challenge that is not as widely discussed in the literature. The omega-3 fatty acids have been the main focus of investigations, and yet omega-6 fatty acids are not only also prevalent in the brain, they also play integral and complementary roles to omega-3 fatty acids (S. E. Carlson, 2001; S. E. Carlson, Werkman, Peeples, Cooke, & Tolley, 1993; Connor, Tenorio, Clandinin, & Sauve, 2012; Richards, Bliss, & Richards, 2003). Supplementation with fatty acids should support the brain’s need for both omega-6 and omega-3 fatty acids. Moreover, an imbalance of these two families of fatty acids may prevent the beneficial effects of supplementation. The omega-6 to omega-3 fatty acid ratio provides a measure of the balance of fatty acids.
The present investigation is focused on the role of the balance of omega-6 and omega-3 fatty acids, as measured by the omega-6 to omega-3 fatty acid ratio, in EF in children and older adults. EF may be particularly susceptible to imbalances in omega-6 and omega-3 fatty acids. In children, EF are
developing, and fatty acids are important for the changes occurring in the frontal cortex and with connections between brain areas. In older adults, EF are declining, and fatty acids are important for maintaining brain functions that tend to decline with age. First, I will review the evidence of the
importance of both omega-6 and omega-3 fatty acids, their competition for biochemical resources, and the gaps in the literature that inform the current investigation of the omega-6 to omega-3 ratio and EF.
3
balance of fatty acids may be important for EF and how future research can approach the study of fatty acids and EF.
The Omega-6 to Omega-3 Fatty Acid Ratio
The omega-6 to omega-3 fatty acid ratio is a measure of the balance of fatty acids. Fatty acids can be consumed in the diet and are found mostly in oils, pork, grains, nuts, and fish (Blasbalg, Hibbeln, Ramsden, Majchrzak, & Rawlings, 2011). Linoleic (LA, omega-6) and alpha-linolenic (LNA, omega-3) acids are the only fatty acids that must be consumed in the diet (Lee, East, & Froud, 1986). Long-chain polyunsaturated fatty acids (LCPUFA), such as docosahexaenoic acid (DHA, omega-3) and arachidonic acid (ARA, omega-6), can be synthesized from LA and LNA in the pathway shown in Figure 1. The omega-6 and omega-3 families utilize the same desaturase and elongase resources for production of fatty acids further down the pathway. The hypothesis in the field is that overconsumption of one family of fatty acids will deplete desaturase and elongase resources for metabolizing the other family of fatty acids. If this occurs, one fatty acid family would be overwhelmingly available for incorporation into neuronal membranes, whereas the other fatty acid family would be relatively scarce. The resulting imbalance could impede neuronal function, and therefore cognitive function, because both omega-6 and omega-3 fatty acids are needed for communication between neurons (Calderon & Kim, 2004; Chalon et al., 2001; De La Presa Owens & Innis, 2000; Richards et al., 2003; Zimmer et al., 2002).
Researchers have clearly demonstrated the negative effects of omega-3 fatty acid deficiency on cognitive function in rodents. Significant omega-3 fatty acid deficiency impairs Morris Water Maze (MWM) performance (T. Moriguchi, Greiner, & Salem, 2000; Salem et al., 2001), olfactory
4
(Carrie, Clement, de Javel, Frances, & Bourre, 2000; T. Moriguchi & Salem, 2003), and the ability to improve performance on cognitive tasks depends on the balance of fatty acids used in the diets. In general, these studies suffer from a confound in that by attempting to maintain similar amounts of total fatty acids in the diets, most deficient diets have an unbalanced omega-6 to omega-3 fatty acid ratio, and most supplemented or control diets have a more balanced omega-6 to omega-3 fatty acid ratio.
Competition for resources.
The competition for desaturase and elongase resources has produced the hypothesis that
consuming more of one family of fatty acids will deplete these resources such that there won’t be enough desaturases and elongases to metabolize the other family of fatty acids. In both animals (Gibson,
Neumann, Lien, Boyd, & Tu, 2013) and cells (Harnack, Andersen, & Somoza, 2009), the most DHA (an omega-3) is produced in the presence of omega-6 fatty acids, and the most ARA (an omega-6) is
5
mixed findings in human work may be because supplementation studies have largely focused on omega-3 fatty acids instead of the omega-6 to omega-3 fatty acid ratio.
The omega-6 and omega-3 fatty acids don’t just use the same resources; each family is optimally metabolized in the presence of the other family. In rodents, Gibson et al (2013) found that the amount of DHA in plasma was related to both dietary LNA intake and the omega-6 to omega-3 ratio. The level of DHA in plasma peaked when LNA was 1% of fats in the diet by weight for rats fed low omega-6 to omega-3 ratios (0.5-0.8). At high ratios (7.4-11.3), the level of DHA in plasma peaked when LNA was 0.3% of the diet. Regardless of ratio, once LNA made up 2% or more of the diet, the relationship between LNA in the diet and DHA in plasma became negative, indicating that high levels of consumption of LNA actually decreased the amount of DHA produced (Gibson et al., 2013). The fatty acid metabolic pathway responds to the overall concentrations of both families of fatty acids, which is evidence that living organisms attempt to produce an optimal balance of fatty acids for daily function and do not simply require a set amount of either family of fatty acids.
The competition for resources and balance of omega-6 and omega-3 fatty acids matters because there is evidence that the consumption of omega-6 and omega-3 fatty acids is becoming increasingly unbalanced (Blasbalg et al., 2011). Kris-Etherton and Hill (2008) indicated that the Institute of Medicine recommends that LNA make up 0.6%-1.2% of fat intake. However, they have found that consumption of omega-3 fatty acids is subject to an “all-or-none” phenomenon. Some people consume fish, and tend to have adequate omega-3, while others consume no fish at all, and are likely well below recommended intakes. Blasbalg et al. (2011) found similar imbalances using economic disappearance data of food commodities. They concluded that Americans have been increasing their LA intake (i.e., pork and soybeans) while largely keeping LNA intake steady (i.e., fish and flaxseed), leading to an overall imbalance in fatty acid concentrations.
Omega-6 and omega-3 fatty acids in the brain.
6
size in the hippocampus (Ahmad, Moriguchi, & Salem, 2002; Ahmad, Murthy, Moriguchi, Salem, & Greiner, 2002) and neurite growth and amount of dendritic branching in the hippocampus (Ahmad, Murthy, et al., 2002; Calderon & Kim, 2004; Darios & Davletov, 2006; Ikemoto, Kobayashi, Watanabe, & Okuyama, 1997). Omega-6 and omega-3 fatty acids also affect ion currents (Fang, Zhou, Gao, Gu, & Mei, 2011; Kovalchuk, Miller, Sarantis, & Attwell, 1994; Lynch & Voss, 1994; Schweitzer, Madamba, & Siggins, 1990), complex protein kinase C signaling (Katsuki & Okuda, 1995; Schaechter & Benowitz, 1993; Schweitzer, Madamba, Champagnat, & Siggins, 1993; Seung Kim, Weeber, Sweatt, Stoli, & Marangell, 2001; Shinomura, Asaoka, Oka, Yoshida, & Nishizuka, 1991), and neurotransmitter activity (Chalon et al., 1998; De La Presa Owens & Innis, 2000; Delion et al., 1997; Delion et al., 1994; Zimmer et al., 2000; Zimmer et al., 2002). Both omega-6 and omega-3 fatty acids are integral to neuronal communication, and as such neither should be ignored in studies of fatty acids and brain or cognitive function.
The overall picture of the relationship between omega-3 and omega-6 fatty acids in the brain has yet to be fully understood. In an interesting investigation, Innis and de la Presa Owens (2001) found that supplementing rats with fish oil (high in omega-3 fatty acids) was negatively correlated with dopamine and serotonin levels in the rat brain. Dopamine and serotonin are two highly prevalent monoamine neurotransmitters in the frontal cortex, and alterations in these monoamines has been shown to affect EF (Maiti, Gregg, & McDonald, 2016; Puig & Miller, 2015; for review: Robbins & Roberts, 2007).
Interestingly, serotonin levels were highest in the brains of rats in high omega-6 group, followed by the brains of rats in the high omega-3, and the lowest serotonin levels were found in the brains of rats in the medium omega-6 group. The groups who consumed the two unbalanced ratios (371.5 and 0.12) had the highest levels of serotonin despite one being very high in omega-6 and one being very high in omega-3. This indicates that the balance of fatty acids is playing an important role in the ultimate outcome in the brain, and simply the amounts of omega-6 or omega-3 can’t be the sole focus of research.
7
years. There is also a clear role for fatty acids in monoamine neurotransmitter regulation and function (see also for cholinergic pathways important to the hippocampus: Aid et al., 2003; Jones, Arai, & Rapoport, 1997), which can in turn affect cognitive functions related to monoamine function. It is therefore not surprising that some have found that omega-3 deficiency is linked to depression (McNamara, Jandacek, et al., 2010), schizophrenia (Liu, Jandacek, Rider, Tso, & McNamara, 2009), and affective disorders
(McNamara, 2010). The omega-6 and omega-3 fatty acids play different but complementary roles in these processes by promoting growth and inhibiting growth (omega-6 and omega-3), altering LTP (omega-6 and omega-3), and affecting monoamine function (omega-6 and omega-3). In the quest to understand how fatty acids can affect cognitive function and brain health, the focus must include a consideration of the balance of omega-6 and omega-3 fatty acids in the brain.
Omega-6 and omega-3 fatty acids and cognitive functions.
The jump from evidence of the importance of fatty acids in the brain to the importance of fatty acids to behavior and cognitive function has not been straightforward. Animal work has produced important results by focusing on specific measures of cognitive functions, like working memory, but the animal work largely uses severe deficiency models that can’t be replicated with human populations. The animal work also varies widely in the underlying balance of fatty acids, making it difficult to conclude that differences in cognitive performance are solely due to omega-3 fatty acid deficiency. Work with humans has produced mixed results in part because of the use of many global measures of cognitive function and the focus on omega-3 fatty acids to the exclusion of understanding the importance of the ratio. Instead of summarizing the findings that describe the negative elements of omega-3 deficiency, I am going to highlight findings from researchers who have focused on the ratio and examine studies from the lens of how the ratio may be affecting results.
Animal work.
8
DHA after periods of deficiency and other studies can’t. It may also explain why some researchers find effects and others do not find any effects. Catalan et al (2002) did not find that rats fed an omega-3 deficient diet performed worse on an olfactory discrimination task as others have (Greiner et al., 2001; Salem et al., 2001). The ratio used in the deficient diet in Catalan et al (2002) was lower than in many other studies, and this lower dietary ratio resulted in lower ratios in the brain (ratio of 7 vs 9-10). Catalan et al (2002) did find that the omega-3 deficient group performed worse on a difficult 20-item olfactory learning task, indicating that the lower ratio was still not optimal for difficult tasks requiring higher-level cognitive abilities but was low enough to allow similar performance on simpler tasks.
When attempting to replete levels of omega-3 fatty acids in the brain, Ikemoto et al (2001) found that a group supplemented with a combination of monounsaturated fatty acids, omega-3 fatty acids, and omega-6 fatty acids was able to replete levels of DHA faster than the group supplemented with just omega-3 fatty acids. The group provided with the mixture of fatty acids also improved in their
performance on a learning task whereas the DHA-only supplemented group did not. Carrie et al (2000) also found they were able to replete DHA levels in the brain using supplementation that included omega-6 fatty acids. Unfortunately, the balance of fatty acids used in studies varies so widely, as do the specific fatty acids used to reach the desired balance, that it is difficult to directly compare many results. Investigations designed to examine differences in the ratio and balance of fatty acids are necessary to untangle the many possible explanations for cognitive performance.
9
development. There is an optimal balance of fatty acids that needs to be struck, and more research of this nature is needed to fully understand optimal fatty acid levels.
Human work.
Research on fatty acids and cognitive function in humans have used a supplementation model in which participants are provided either with a control supplement (such as corn oil) or a supplement rich in omega-3 fatty acids (such as fish oil). The problems of assessing human LCPUFA supplementation studies are well documented (for review: Cheatham & Colombo, 2006; Willatts & Forsyth, 2000). Here, I will focus on the issue of the omega-6 to omega-3 ratio and the developing human brain. Currently, it is not clear how much DHA or ARA is optimal for developing infants, children, or adults. As a result, it is not clear what the correct balance or ratio of omega-6 to omega-3 fatty acids is for the developing brain.
The majority of randomized clinical trials (RCT) of fatty acid supplementation have focused on the prenatal period and the first two years of life. The studies vary widely in treatment diets, timing, and assessment. In general, the treatment diets consist of some combination of an LA and LNA group without any ARA or DHA, a DHA and/or a DHA+ARA group, and a breast-fed reference group. The start of supplementation ranged from a few days after birth to a full month after birth for infant supplementation, and from 17 weeks gestation to 28 weeks gestation for maternal supplementation. Cessation of
supplementation was commonly 3-4 months after the baby’s birth, but sometimes extended a full year, in both infant and maternal supplementation studies. One study ended maternal supplementation when the baby was born (Dunstan, Simmer, Dixon, & Prescott, 2008). Studies assessed infants as early as the second day of life (Helland et al., 2001) and followed children up to 7 or 8 years old (Bakker et al., 2003; Cheatham, Nerhammer, Asserhoj, Michaelsen, & Lauritzen, 2011; Helland et al., 2008).
10
subscales of the MacArthur Communicative Development Index (CDI) at 14 months. Willatts and Forsyth (2000) reviewed 12 RCTs of PUFA supplementation that reveal a pattern of better results for infants supplemented with DHA + ARA. Eight of the studies in Willatts and Forsyth (2000) include a group supplemented with DHA + ARA, and 6 of those include results in which the DHA + ARA group did better than a DHA only group (e.g., Birch et al., 2002; Scott et al., 1998) or a control group (e.g., Agostoni, Trojan, Bellu, Riva, & Giovannini, 1995; Willatts, Forsyth, DiModugno, Varma, & Colvin, 1998).
Both the commencement of supplementation and the length of supplementation are relevant for whether or not any significant effects are found between diets. It is better to start earlier and supplement longer. Birch et al. (2002) did not start supplementation until infants were 6 weeks old. Despite
supplementing through the first year, and including DHA and ARA in similar quantities to other studies, they did not find any differences between groups on measures of stereoacuity or forced choice
preferential looking. The same researchers found differences in visual acuity (Birch, Hoffman, Uauy, Birch, & Prestidge, 1998) and Bayley Scales of Infant Development (BSID) scores (Birch, Garfield, Hoffman, Uauy, & Birch, 2000) when supplementation began within the first week after birth, even though supplementation only lasted for 4 months.
Only a handful of studies have investigated fatty acid levels and cognitive performance in
11
additional supplementation, they found a significant effect using a global development scale. By this age, it is important that researchers take advantage of the extensive number of tests of specific functions available. The limited findings with global development scales in infancy provide an indication of what could be teased apart with studies of specific functions that are developing during the preschool years.
By middle childhood, most neural substrates of the brain are in place and fine-tuning occurs for many years. There are even more tests of EF available by this age. However, most still follow the infant literature and use global development scales. Bakker et al. (2003) followed-up with 327 children from the older cohort that was followed in Ghys et al. (2002). Seven-year-old children were tested using the K-ABC, and again, neither plasma at age 7 nor umbilical cord DHA or ARA predicted the Mental
Processing Composite or any subscale scores of the K-ABC. Helland et al. (2008) continued their follow-up of children who participated in their RCT to seven years old. This time, however, they did not find any differences in any K-ABC scores between the cod liver oil and corn oil group. However, maternal DHA and total omega-3 at birth were significantly, positively correlated with sequential processing scores on the K-ABC at seven years old, and the omega-6 to omega-3 ratio was significantly, negatively correlated with sequential processing scores on the K-ABC.
In one investigation that used a specific measure of EF after supplementation in infancy,
Cheatham et al. (2011) reported that children supplemented from birth to 4 months old had blood levels of DHA that were correlated with performance on a test of inhibitory control, the day-night Stroop task. McNamara et al. (2010b) supplemented typically-developing boys 8 to 10 years old with DHA and found that the groups given DHA had increases in activation in the right dorsolateral prefrontal cortex (DLPFC), an area of the brain reliably activated during EF tasks, during a sustained attention task. Sheppard and Cheatham (2013) specifically examined the dietary ratio of 7- to 9-year-olds and performance on a battery of tests of EF. They found an interaction such that children who consumed low levels of omega-3 fatty acids performed best when consuming a low ratio, but children consuming high levels of omega-3 fatty acids performed best when consuming a high ratio. This finding is preliminary, but is in line with
12
et al., 1992), and would help explain why there aren’t always significant findings in human omega-3 fatty acid supplementation work. Imbalanced omega-6 and omega-3 fatty acid intake could perturb the balance of fatty acids needed for optimal cognitive function.
Research on fatty acids and cognitive function to date highlights a distinct need for a focus on the balance of omega-6 and omega-3 fatty acids. In animals, the imbalanced diets created by deficiency models in rodents may explain the observed deficits in cognitive functions. In humans, the lack of focus on the balance of fatty acids may mask important findings about the role of omega-6 and omega-3 fatty acids in cognitive function. Additionally, human work needs to use specific tests of cognitive functions subserved by the brain areas of interest. In this case, EF are likely affected by imbalances in omega-6 and omega-3 fatty acid consumption because they are subserved by the hippocampus and frontal cortex and require flexible use of many cortical resources. Understanding the unique nature of EF will help in understanding how fatty acids can support optimal EF development. The present study will focus on these gaps by focusing on the balance of omega-6 and omega-3 fatty acids, by focusing on specific EF tasks, and by focusing on age ranges during which EF are developing and declining.
Executive Functions and the Omega-6 to Omega-3 Fatty Acid Ratio
13
The frontal cortex is one of the main areas to accrete large amounts of omega-6 and omega-3 fatty acids (Martinez & Mougan, 1998), and the frontal cortex is sensitive to alterations in the balance of omega-6 and omega-3 fatty acids (Jumpsen, Lien, Goh, & Clandinin, 1997a, 1997b) with researchers finding that it is difficult to replete the frontal cortex after deficiency (Carrie et al., 2000). The omega-6 and omega-3 fatty acids are integral to neuronal growth and communication in the frontal cortex (Chalon et al., 2001; De La Presa Owens & Innis, 2000; Delion et al., 1997; Delion et al., 1994; Zimmer et al., 2000). Investigations with animals have demonstrated clear effects of omega-3 deficiency on MWM performance, a test of working memory (T. Moriguchi et al., 2000; T. Moriguchi & Salem, 2003; Salem et al., 2001). The limited work done in humans with omega-6 and omega-3 fatty acids and EF has shown promising early results (Cheatham et al., 2011; McNamara, Able, et al., 2010b; Sheppard & Cheatham, 2013).
14
inhibitory control, working memory, and planning, will be discussed in terms of the role the balance of fatty acids could play in their development.
What is the executive?
In models of executive functions in adults, an executive component is seen as the seat of control of other functions (Baddeley, 1992, 1996). The executive parses input from multiple areas and develops a coherent response. The requirements of producing a coherent response include things like representing rules and rule structures (Crone, Donohue, Honomichl, Wendelken, & Bunge, 2006; Zelazo & Frye, 1998), inhibiting distracting or incorrect information (Kirkham, Cruess, & Diamond, 1997; Schroeter, Zysset, Wahl, & von Cramon, 2004), updating information while completing a task (Tsujii, Yamamoto, Masuda, & Watanabe, 2009), and finally, providing a correct response or series of responses to the situation.
The picture of EF in children is less clear. In some models, EF are considered to consist of three factors in children (Garon et al., 2008; Miyake et al., 2000) generally comprising working memory, inhibitory control, and set-shifting, whereas other models have still found EF to be a single factor in young children (Wiebe et al., 2011). Developmentally, EF are seen as becoming increasingly
differentiated both in terms of behavioral function and cortical activation. The question remains as to how we develop from infants who perseverate in searching in the wrong location even while watching the object being hidden (the classic A-not-B error) to adults who can develop complex plans for long-term goals and reliably carry out those plans, and even update and alter those plans as needed. Interestingly, older adults exhibit declines in EF capacity commensurate with declines in differentiation in behavioral function and cortical activation (Baltes & Lindenberger, 1997; Carp, Park, Polk, & Park, 2011; S.-C. Li, Lindenberger, & Sikstrom, 2001).
15
Zelazo, Frye, & Rapus, 1996). As Smith et al. (1999) explain, the errors made in these tasks can be seen as a problem with action, a problem with inhibition, or a problem with working memory. The A-not-B task and DCCS task differ most in terms of complexity. They require similar functions and produce similar errors, and investigations of these errors across development have produced similar explanations.
The first consideration is the coordination of knowledge and action. Children and infants can correctly indicate where an object belongs in a sorting task through words or eye gaze (Zelazo, 2004; Zelazo, Reznick, & Pinon, 1995), and only fail at search tasks when asked to execute that search (Zelazo, Reznick, & Spinazzola, 1998). Even 8-month-old infants will often look at location B, but subsequently search at location A (Diamond, 1985; Diamond & Doar, 1989; L. B. Smith et al., 1999) (Diamond, 1985; Diamond & Doar, 1989; L. B. Smith et al., 1999). In the brain, the prefrontal cortex and cerebellum are developing connections throughout the first two years of life, and those connections are thought to support knowledge of the correct sorting or reaching behavior to guide actual actions (Diamond, 2000).
Another explanation for the A-not-B and DCCS task errors relates to inhibition. Young children struggle to inhibit a prepotent response because of an underdeveloped executive that could help them ignore rules and places that are no longer relevant. There is evidence that the influence of many aspects of the A-not-B set-up produce less perseveration to search in the incorrect location (such as different colors for A and B, Butterworth, Jarrett, & Hicks, 1982) or more perseveration (such as longer delays before a search is allowed, Diamond, 1985). Kirkham et al. (1997) demonstrated that several manipulations of the DCCS task could allow children as young as 2 to successfully switch rules, an age group previously thought to reliably fail, and make it difficult for 4-year-olds to successfully switch rules, an age group previously thought to reliably succeed. These manipulations include turning over the most recently sorted card so that incorrect sorting by the previous rule is not reinforced by seeing the card (easier), and placing the card in an envelope before sorting it so the card’s picture has to be held in mind throughout the action of sorting (more difficult).
A third explanation for these errors relates to task representation and rule hierarchies. The
16
the DCCS, but it brings up an important issue with the A-not-B task as well. In the DCCS, the rules for success are hierarchical in nature. First, there are two games, and the correct rule must be followed. Then, there are the rules of the game being played that involve physically placing the card in one box or another. An inability to represent rules hierarchically would result in failure on the DCCS. Zelazo and colleagues have demonstrated that children as young as 2 can represent four separate rules quite easily such that the number of rules involved is not the issue (Zelazo & Frye, 1998; Zelazo et al., 1996). The issue can be discussed more broadly as an inability to represent the entirety of the task. This inability to represent the whole task has been described as not having enough “psychological distance” from the problem to fully represent the rule structure (Zelazo & Frye, 1998). The same issue could be applied to the A-not-B task in that infants are not able to fully represent the task. They perseverate because previous action sequences that involved only half the task (i.e., just one location) overwhelm an underdeveloped executive and prevent switching search locations.
17
Children have also been shown to have reduced cognitive capacity and speed of processing compared to adults. These issues are largely discussed in the working memory literature, and are often studied using span tasks (Conway, 1996; Just & Carpenter, 1992; Luciana & Nelson, 1998) and search tasks (Luciana, Conklin, Hooper, & Yarger, 2005). Researchers have noted the importance of capacity in performance on span and search tasks (Conway, 1996; Just & Carpenter, 1992), and others have
demonstrated the importance of the structure of the task, such as differences between backward and forward span tasks and the nature of the stimuli (boxes in space compared to words) (Conklin et al., 2007; Gathercole, Pickering, Ambridge, & Wearing, 2004).
In the case of capacity and speed of processing, older children show alterations in both functional connectivity and the ability to use neural resources. Tsujii, Yamamoto, Masuda, and Watanabe (2009) demonstrated that there is increased lateralization of the frontal cortex during a spatial working memory task from 5 to 7 years of age. Younger children had no lateralization whereas older children exhibited greater activity in the right frontal cortex during the task. The increase in lateralization from 5 to 7 years was accompanied by a decrease in reaction time. The more lateralization that occurred within an
individual child, the faster they were able to respond. Older children who have lateralization similar to adults still have capacity problems. On verbal and spatial working memory tasks, children 7 to 12 years old did not evidence an increase in activation of working memory with increasing problem difficulty, whereas adults did call upon more working memory resources (Thomason et al., 2009). Therefore, whereas brain development across early childhood is marked by alterations in connectivity and functional activation (Barnea-Goraly et al., 2005; Paus et al., 1999; Perone, Simmering, & Spencer, 2011; Sowell, Trauner, Gamst, & Jernigan, 2002; Toga, Thompson, & Sowell, 2006), later childhood and adolescence is also a period of developing the ability to utilize those neural circuits and resources in the pursuit of goals (Hwang, Velanova, & Luna, 2010; for review: Tsujimoto, 2008).
18
function are directly related to the availability of nutrients needed to produce neurons, neurotransmitters, and receptors. Broad changes across development include increases in gray matter until age 4 when it begins to decline and increases in white matter steadily into adulthood (Barkovich, Kjos, Jackson, & Norman, 1988; Pfefferbaum et al., 1994; Sowell et al., 2002; Toga et al., 2006). Later, changes in gray matter development differ between brain areas. Peaks in gray matter occur around adolescence and differ between the frontal, parietal, temporal, and occipital lobes (Giedd et al., 1999). Finally, older adults experience consistent declines in gray matter in the prefrontal cortex and hippocampus connected to declines in cognitive capacities (Sander, Lindenberger, & Werkle-Bergner, 2012; Zimmerman et al., 2006) The changes in white and gray matter are related to changes in the composition of the lipid bilayer and increased myelination that changes the overall balance of cholesterol, proteins, and fats in the brain (Barkovich et al., 1988). When studying fatty acids, it is important to understand how the brain is developing during a given period and what the optimal balance of nutrients may be to support structure and function (for review: Wainwright, 2007). The present study will focus on EF and the fatty acids that support the frontal cortex and hippocampus that subserve EF. Though there isn’t much direct evidence of the role of fatty acids in EF, there are indications of what could be expected from the literature on inhibitory control, working memory, and planning.
Inhibitory control and fatty acids.
19
The tasks used to assess inhibitory control, such as Go/No-go, Stroop, and the DCCS, share in common the need to distinguish between stimuli and apply task rules to determine the correct response. In the case of the simpler Go/No-go tasks, there is a single dimension on which two stimuli differ (such as a red and blue fish). The participant must remember to which dimension they must respond (Go stimulus) and inhibit that response when the other stimulus (No-Go stimulus) appears. Stroop tasks tend to test naturally prepotent responses, such as saying the color words presented (e.g., red, blue) instead of saying the color of the text in which the words appear. Hierarchical rule tasks, like the DCCS, add other
dimensions to the stimuli and nested rules that have to be inhibited.
Inhibitory control tasks reliably activate the frontal cortex, and the development of inhibitory control is related to changes in the use of neural resources as the complexity of the inhibitory control requirements increases. Children will become proficient at simpler inhibitory control tasks, like Go/No-Go, before more complex tasks, like the DCCS. Hierarchical rules represent a more complex stimulus to inhibit. Rubia et al. (2006) found that adults performed better than adolescents and had different cortical activation than adolescents on three different inhibitory control tasks. Adults had greater anterior
cingulate gyrus activation across all tasks (area of the brain involved in attentional control), but they only had different dorsolateral PFC activation (area of the brain reliably activated during working memory tasks) during the more complex inhibitory control tasks compared to adolescents. Brain activation clearly distinguishes between children who have developed the ability to control inhibition and those who have not. Even 3-year-olds who do not perseverate on a DCCS task show adult-like brain activation (Y. Moriguchi & Hiraki, 2009). Older adults experience declines in performance on more difficult tasks first, and typically recruit more executive resources for increasingly simpler tasks as they age (Cappell, Gmeindl, & Reuter-Lorenz, 2010; Mattay et al., 2006; Schneider-Garces et al., 2010).
20
adolescents exhibited decreases in the coupling of bilateral frontopolar prefrontal, parietal, and caudate activation during a Go/No-go response inhibition task while also exhibiting increasing white matter connections with temporal and anterior cingulate areas into adulthood. This activation pattern was coupled with improved performance and reduced reaction time, which indicates that these patterns are more mature cortical network patterns. Rule-switching, such as that required by the DCCS, in adults involves coordination of the ventrolateral prefrontal cortex (VLPFC) and the pre-supplementary motor areas (pre-SMA). The VLPFC is postulated to be responsible for representing the rules involved in the task, and the pre-SMA area is responsible for inhibiting the irrelevant rules. Children reach adult levels of activation of the pre-SMA by adolescence, but even adolescents show different activation of the VLPFC compared to adults (Crone et al., 2006). The present study will investigate brain activity using near-infrared spectroscopy (NIRS) to investigate the use of prefrontal resources in children 7 to 12 years old.
Thus far, there haven’t been any investigations of how fatty acids may support the development of inhibitory control, but some initial hypotheses can be gleaned from the literature. The frontostriatal network frequently discussed with inhibitory control is generally considered to include the prefrontal cortex, anterior cingulate cortex, striatum, and cerebellar areas. All of these areas are affected by omega-3 fatty acid deficiency and changes in the omega-6 to omega-3 fatty acid ratio (Delion et al., 1994; Jumpsen et al., 1997a, 1997b; Levant, Ozias, & Carlson, 2007). However, each brain area tends to respond
21
Disruption to dopamine and serotonin receptors have been shown to disrupt EF task performance in animals (Maiti et al., 2016; Puig & Miller, 2015). The full picture of neurotransmitter function that supports EF is of course complex, but these monoamines have been consistently implicated (Robbins & Roberts, 2007) such that the role of fatty acids in monoamine receptors and neurotransmission is likely an important element of their role in EF.
The present study will use a novel task, the Electric Maze Task (EMT) to investigate the contribution of the balance of fatty acids to inhibitory control. Specifically, the inhibitory control requirements of the EMT will be manipulated to determine if a specific balance of fatty acids best
supports inhibitory control performance. The collection of behavioral performance data and brain activity data will hopefully begin to piece together a picture of how fatty acids best support brain function and inhibitory control performance in middle childhood. Based on the limited evidence, an interaction between the ratio and omega-3 intake will likely best support inhibitory control performance. The brain areas subserving mature inhibitory control respond very differently to changes in the balance of omega-6 and omega-3 fatty acids. Maintaining a balance that does not promote one family over another (low consumption of both omega-3 and omega-6 or high consumption of both omega-3 and omega-6) will likely best support the frontal, striatal, and cerebellar resources involved in inhibitory control. In older adults, there haven’t been any investigations of the omega-6 to omega-3 ratio and cognitive function. Based on the evidence from changes in older adult brain function, the ratio is likely to support
performance of more complex EF tasks in young older adults (65- to 69-year-olds) and simpler EF tasks in the oldest older adults (75- to 79-year-olds).
Working memory and fatty acids.
22
subsystems, the phonological loop and visuospatial sketchpad, which are directly responsible for the information being stored and processed (for review: Baddeley, 1992). Similar to inhibitory control, mature working memory can’t be achieved until the frontal areas are connected to response elements (visual, motor, or verbal). Researchers have described working memory in terms of both capacity and flexibility (Baddeley, 1996; Conway, 1996).
Investigations into the development of working memory highlight increases in the roles of distinct brain areas and increased connectivity between frontal, parietal, temporal, and occipital areas. In infancy, working memory is often studied using a delayed response (DR) task. Success on this task varies with the type of stimulus, delay, and response modality (for review: Pelphrey & Reznick, 2003). Infants who are successful at this task across longer delays show increased activity in frontal regions (Bell & Fox, 1992). Success on this task across development involves increasing specificity in the brain areas involved. Successful infants had greater electroencephalography (EEG) coherence across the whole brain, whereas children 4.5 years old who were successful had increased coherence only between medial frontal and posterior temporal areas and medial frontal and occipital areas (Bell & Wolfe, 207). EEG coherence is thought to be indicative of the connections between brain areas, and greater coherence likely indicates more connectivity and organization between brain areas (Thatcher, Krause, & Hrybyk, 1986).
23
that correspond to increases in accuracy and speed of processing (Blain-Briere, Bouchard, Bigras, & Cadoret, 2013; Klingberg, Forssberg, & Westerberg, 2002; Nelson et al., 2000). There is also evidence of a lateralization across development that is related to improved performance (Tsujii et al., 2009) and that it reflects the type of stimulus being held in memory and manipulated (spatial vs object number) (E. E. Smith et al., 1995). The development of working memory involves a process of differentiation (behaviorally and in use of cortical resources) and increased involvement of the frontal cortex.
In older adults, researchers have found support for decreased differentiation with age that is linked to worse working memory performance (Mattay et al., 2006; Schneider-Garces et al., 2010). Additionally, executive resources are recruited for simpler tasks as we age (Nagel et al., 2011; Nagel et al., 2009). Both “overactivation”, or increased activity in older adults compared to younger adults, and “underactivation”, or decreased activity in older adults compared to younger adults, is seen in working memory tasks. Generally, the prefrontal cortex is found to be overactive, and posterior areas of the brain are found to be underactive (Reuter-Lorenz & Park, 2010; Sander et al., 2012). These changes in the use of cortical resources to complete working memory tasks implies changes in the nutritional support the brain may need.
Similar to inhibitory control, there hasn’t been significant research on fatty acids and working memory in humans. However, evidence still points to the important role of omega-6 and omega-3 fatty acids. First, the hippocampus, a brain area recruited during memory and spatial processing tasks, is another area of the brain to accumulate considerable omega-3 and omega-6 fatty acids (Martinez, 1992). The hippocampus is also sensitive to deficiency and imbalance of fatty acids (Jumpsen et al., 1997a, 1997b). Working memory tasks, particularly spatial tasks, recruit both the frontal cortex and
24
deficiency. All these alterations relate to the ability of the hippocampus to communicate with other brain areas. Interestingly, Ikemoto et al. (2001) found that simply adding DHA at levels similar to other studies did not replete omega-3 fatty acid levels in the brain or improve MWM performance in previously deficient rats. Instead, increasing the level of DHA and lowering omega-6 fatty acids to lower the ratio repleted brain levels of omega-3 fatty acids and improved performance on the MWM.
The working memory literature also highlights the role of differentiation in the development of mature EF. Over time, brain function becomes more distinct in response to specific stimuli and specific processing requirements, and with aging, brain structure and function reduce in differentiation. This process of integration and differentiation through the growth of neurons, synapses, and dendritic
branching combined with synaptic pruning supports the growth of necessary connections and decrease in unused or excess connections. Typically, researchers have demonstrated that omega-3 fatty acids increase neuronal growth and dendritic branching, and omega-6 fatty acids decrease neuronal growth and dendritic branching in both the hippocampus and frontal cortex (Ahmad et al., 2004; Ahmad, Murthy, et al., 2002; Ikemoto et al., 1997). A balance between omega-6 and omega-3 fatty acids could therefore support a system that is changing neuronal connections and structure in support of newly developing functions. In children, it would be expected that balanced fatty acid ratios would support the process of differentiation associated with mature working memory. In older adults, it would be reasonable to hypothesize that balanced fatty acid ratios could support the maintenance of activation across the working memory network. Activation more similar to young adults (i.e., no overactivation of the prefrontal cortex or underactivation of posterior resources) could then support better working memory performance in older adults.
Planning and fatty acids.
Planning is an executive function characterized by assessing a goal, determining how to reach the goal, executing the steps, and then evaluating errors and goal attainment (Lezak, 1982; Welsh &
25
Currently, the Tower tasks are some of the most widely used tasks to assess planning. These tasks consist of two sets of discs arranged on 3 to 5 dowels. The goal is to make one set of discs match the other set of discs. To successfully match the sets of discs, participants must first work out a general plan for how to make them match, and then move the discs accordingly without deviating from the plan or forgetting the final goal. Mature planning is thought to be represented by the ability to solve the problems in the
minimum number of moves required, which indicates creating an initial plan, not deviating from that plan despite potentially distracting stimuli, and being able to update the plan if needed.
Planning develops well into the adult years, and even studies with adults demonstrate considerable variability in performance (Luciana et al., 2009; Luciana & Nelson, 1998). Welsh and Pennington (1988) discuss research demonstrating that, in early childhood, children’s plans are usually focused on one dimension of a problem. They are not able to step “outside” the problem and reflect on all the information pertinent to the problem (Kaller, Rahm, Spreer, Mader, & Unterrainer, 2008; Lezak, 1982; Welsh et al., 1991), which is an idea analogous to Zelazo’s psychological distance (Zelazo & Frye, 1998). In particular, success on tasks that require moving away from the goal develops later. Welsh, Pennington, and Groisser (1991) investigated EF in children 3 to 12 years old and a group of adults. The researchers used 3-disk and 4-disk versions of a Tower of Hanoi task. Children reached adult performance on the 3-disk version by age 6, but did not reach adult performance by age 12 on the 4-disk version. They propose that the added complexity likely taxed the working memory necessary for efficient planning. Bull et al. (2004) also described the difference between tasks that can be solved using a perceptual strategy, one that does not require stepping outside the problem, and tasks that require stepping back to see all the requirements of the task. The 3-disk versions of Tower of Hanoi tasks typically provide perceptual support for each step, whereas the 4-disk problems frequently require the ability to create psychological distance.
26
be functional (Lezak, 1982; Welsh et al., 1991; Welsh et al., 1999). In young children, planning tasks do not show high correlations with other tasks (Welsh et al., 1991), and performance tends to lag behind other EF measures. By adolescence, however, performance on planning tasks tends to be predicted by performance on working memory and inhibitory control tasks, and planning improves with improving working memory and inhibitory control (Luciana et al., 2009; Welsh et al., 1999; Zook et al., 2004). Across development, the ability to step outside the problem is related to improvements in planning and to the development of underlying functions. Improved working memory and inhibitory control would allow someone to succeed at increasingly complex planning tasks and allow simpler planning tasks to become more automated.
The issue of psychological distance is important in discussions of the development of EF. Zelazo says that psychological distance is required for preschoolers to be successful on the DCCS. The DCCS can be seen as a simple planning problem, and young children who can’t create the psychological distance necessary to order the two steps involved in the task (apply higher level rule followed by the lower level rule) fail at the task. Children as young as four can easily create plans for perceptually supported two-step planning problems (Luciana & Nelson, 1998) and reliably solve most DCCS tasks (Kirkham et al., 1997). However, there is still improvement through age 6 on 3-step planning problems that are perceptually supported but require holding more information in mind (Luciana & Nelson, 1998). It isn’t until adolescence that general success can be seen on 4-step and 5-step planning problems requiring
27
Test Assessment Battery (CANTAB) Stockings of Cambridge (SOC, a Tower task analogue) task and the novel EMT task in order to distinguish between planning problems that require counterintuitive moves and those that do not.
Planning recruits similar cortical resources to working memory and inhibitory control. The dorsolateral and rostrolateral PFC (Baker et al., 1996), inferior frontal gyrus (Fincham, Carter, van Veen, Stenger, & Anderson, 2002) and superior frontal areas (Morris, Ahmed, Syed, & Toone, 1993) are found to be activated during planning tasks. Two versions of the Tower tasks – one in which people complete the moves and another where they simply indicate the minimum number of moves required – are typically used in cortical imaging studies. These different methods for eliciting planning have different results. The inferior frontal gyrus (Fincham et al., 2002) and the right dorsolateral PFC (Newman, Carpenter, Varma, & Just, 2003) are often activated during completion of a move, and the bilateral dorsolateral PFC, anterior cingulate cortex, and rostrolateral PFC are often activated when indicating the minimum number of moves required (Baker et al., 1996; Schall et al., 2003). Just like working memory and inhibitory control, response modality is relevant when assessing planning performance.
Many studies also find that planning activates different frontal areas based on the difficulty of the task (Baker et al., 1996; Fincham et al., 2002; Newman et al., 2003), which is interesting because the more difficult problems are also those most likely to require stepping “outside” the problem and making moves contrary to the goal in order to ultimately attain the goal. Unfortunately, researchers who have compared easy and difficult planning tasks have used subtle differences in the structure of their tasks. Knowing that differences in planning tasks lead to differences in performance (Bull et al., 2004), it is important that investigations using brain imaging use the same task design – or systematically alter the task design – in order to understand the brain areas that underlie planning and those that are related to task differences.
The contribution of fatty acids to planning development will be similar to the role of fatty acids in the development of inhibitory control and working memory, which set the groundwork for the
28
control and working memory will likely set the stage for optimal planning development. Our investigation of EF and fatty acids found a relationship between the omega-6 to omega-3 ratio and planning
performance (Sheppard & Cheatham, 2013). Using the SOC task, we found that the omega-6 to omega-3 fatty acid ratio predicted mean subsequent thinking time on the 5-step planning problems above and beyond omega-3 and omega-6 intake in children 7 to 9 years old. The mean subsequent thinking time measure is an indication of the amount of time needed to think through the problem after beginning to move pieces to solve the problem. This measure has the movement time removed through a yolked follow condition such that the “thinking time” is not confounded by differences in reaction time or movement time between children. Children who required more time either did not develop a plan, were unable to hold it in mind to complete it, or became distracted by perceptually supported but actually incorrect moves. Children with lower ratios required less time to solve the problems. Lower mean subsequent thinking times were correlated with performance, such as making fewer errors.
29 The Present Study
The present study was designed to investigate the role of the omega-6 to omega-3 ratio in the support of EF. Very few researchers interested in cognitive function in humans have ever focused on the balance of omega-6 and omega-3 fatty acids even though there have been calls to use the omega-6 to omega-3 ratio (Kirby, Woodward, Jackson, Wang, & Crawford, 2010; McNamara, Able, et al., 2010a). The present study was designed to address several questions that follow from previous research. First, the role of the ratio as planning abilities are developing and declining was investigated using a cross-sectional design. Second, the role of the ratio in EF that underlie planning was investigated through a novel task that allows systematic control of inhibitory control and working memory demands. Finally, the link between the ratio, brain function, and cognitive function was investigated through the use of near-infrared spectroscopy (NIRS) data collected during task completion. The specific aims of the present study were: Specific Aim 1: to determine the relation between the omega-6 to omega-3 fatty acid ratio and planning performance across the lifespan. The purpose of this aim is to replicate the previous study with 7- to 9-year-olds and to expand upon those findings by investigating the optimal ratio at different ages. It might be that balanced ratios are important across development or that optimal performance will be seen at different ratios across development.
Specific Aim 2: to validate a novel electric maze task as an assessment of EF. The purpose of this aim was to ensure that the novel EMT task assessed planning and that the working memory and inhibitory control manipulations were successful.
Specific Aim 3: to determine the relation between the omega-6 to omega-3 ratio, cortical activation in the prefrontal cortex, and planning abilities. The purpose of this aim was to examine the prefrontal resources used to complete standardized measures and the novel EMT task. Then, the goal is to examine the role of the ratio in prefrontal activation during EF tasks. The expectation is that lower ratios will support more efficient processing and better performance on EF tasks.
30
CHAPTER 2: METHODS Participants
Seventy-eight children 7 to 12 years old and 88 adults 65 to 79 years old were recruited from the Charlotte, NC area. Children were excluded if they had any developmental delays, such as diagnoses of attention-deficit hyperactivity disorder (ADHD), autism spectrum disorder (ASD), or fetal alcohol spectrum disorder (FASD). Fifty-one percent of participants were female, and 92% identified as
Caucasian, 4% identified as African-American, 1% identified as Asian, and 3% identified as mixed race. Nine percent of the sample identified themselves as Hispanic or Latino. Participants came from
households with a diverse range of incomes (42% below $90,000), and most mothers, 67%, had at least a college degree. Table 1a shows the descriptive statistics for the sample of children.
31 Procedure
7- to 12-year-olds.
Screening. All children were screened for omega-6 and omega-3 fatty acid intake. We
demonstrated in a previous study (Sheppard & Cheatham, 2013) that there were significant differences between children with low and high ratios relative to low and high intakes of omega-3 fatty acids. In order to recruit the best sample for our specific aims, participants were chosen who had low ratios and low, mean, or high omega-3 intake, mean ratios and low, mean, or high omega-3 intake, and high ratios and low, mean, or high omega-3 intake. Cutoffs were determined by calculating tertile splits from the previous sample and checked with the current sample once enough participants had been screened. The present sample consumed more omega-3 fatty acids on average while maintaining similar omega-6 fatty acids to the previous sample. This consumption pattern lowered ratios among screened participants, but low ratios were still the most difficult ratios to find. Using the current sample’s cutoffs would only have lowered the low ratio tertile cutoff and made recruitment difficulties worse. This process ensured that we sampled as equally as possible across types of diets instead of basing results on a sample largely made up of one or two types of diets. Table 2 outlines the grouping strategy for participants and the final cell sizes for each diet type.
32
be included. One hundred and fifty two children were screened in order to obtain the 78 in the final sample.
Twenty-four hour diet recalls are considered the most valid mechanism for determining a person’s diet (Thompson et al., 2002). Diet recalls were conducted using the 4-pass methodology described below and originally published in the Journal of the American Dietetic Association (Baxter et al., 2009). This 24-hour technique was chosen because it is considered the best way to collect diet data from children. Additionally, all 7- to 12-year-olds had a parent present to help answer questions about the quantity of food consumed and how the food was cooked. Data collection was guided by and entered into the Nutrition Data System for Research (NDSR).
First pass - Quick list: “We’ll be talking about what you ate or drank yesterday. After you got up yesterday morning, what was the first time you had something to eat or drink? What did you eat or drink at that time? Did you eat or drink anything else at that time? What was the next time yesterday that you had something to eat or drink? What did you eat or drink. . .?” The interviewer repeated this process to cover yesterday’s intake in chronological order. Then, the child was asked “Can you remember any other times yesterday that you had something to eat or drink?”
Second pass - Review: The interviewer repeated back everything the child reported at each time, and asked “Can you think of anything else you ate at that time?” and “Can you think of anything else you drank at that time?” (The interviewer repeated this process for yesterday’s intake in chronological order.)
Third pass - Details: The interviewer asked the child to name each eating occasion (response options: school breakfast, breakfast, school lunch, lunch, dinner, supper, snack), identify the location of each meal (response options: home, school, somewhere else), provide details about each item, indicate additions to items, and indicate amounts consumed for each item. The interviewer began with the earliest time yesterday morning and continued in
chronological order to cover yesterday’s intake.
Fourth pass - Final review: Each eating occasion was reviewed with the child for
correctness. The interviewer began with the earliest time yesterday morning and repeated this process in chronological order to cover yesterday’s intake. Then, the child was asked one final time “Can you remember any other times yesterday that you had something to eat or drink?”
Behavioral testing. Participants who fit into a diet group were called to be invited into the in-person part of the study, which consisted of one visit to the Cheatham Nutrition & Cognition Lab at the Nutrition Research Institute.