MULTILEVEL PREDICTORS OF CANCER CLINICAL TRIAL ENROLLMENT AMONG CCOP PHYSICIANS
Sara R. Jacobs
A dissertation submitted to the faculty at the University of North Carolina at Chapel Hill in partial fulfillment of the requirements for the degree of Doctor of Philosophy in the Department of Health Policy and Management in the Gillings School of Global Public
Health.
Chapel Hill 2014
iii ABSTRACT
SARA R. JACOBS: Multilevel Predictors of Cancer Clinical Trial Enrollment among CCOP Physicians
(Under the direction of Bryan J. Weiner)
Despite the potential benefits, only 3-5% of American adults with cancer
participate in cancer clinical trials. One intervention aimed at increasing participation in clinical trials is the Community Clinical Oncology Program (CCOP), a cancer focused provider-based research network administered by the National Cancer Institute (NCI). Although drivers of enrollment at the CCOP level are well understood, no research has exclusively examined enrollment among CCOP physicians.
The objective of this dissertation was to understand the factors that predict enrollment of patients in NCI-sponsored cancer clinical trials among CCOP physicians. Data were obtained from the 2011 Annual CCOP Progress Reports, two surveys conducted in 2011 among CCOP administrators and physicians, and the 2012 American Medical Association Physician Masterfile. The sample consisted of 485 CCOP physicians. We used structural equation modeling to analyze three models that predicted physician enrollment.
iv
directly predicting enrollment, although neither physician characteristics nor CCOP factors were indirectly associated with enrollment operating through physician attitudes. In the second analysis, we included physicians’ perceptions of CCOP, and tested whether fit between CCOP and physicians’ values moderated the effect of physicians’ perceptions of implementation climate (i.e., a climate that supports, rewards, and expects implementation) on enrollment. Our results demonstrated that both constructs were significantly associated with enrollment and including the moderator improved overall fit of the model. Lastly, we included both CCOP factors and perceptions of context in a single model. Our results confirmed that implementation climate mediated the relationship between organizational policies and practices and enrollment
Overall, the results have both theoretical and practice implications. This
v
vi
ACKNOWLEDGEMENTS
First, I would like to thank my advisor, Committee Chair, and mentor, Dr. Bryan Weiner. He was an integral part of my experience at Carolina and I really appreciate his guidance and support throughout my entire tenure. I know we will continue to work together in the future. I would also like to thank Dr. Morris Weinberger for not only serving on my committee, but also for creating a supportive environment in which
students can excel. In addition, I would like to thank the rest of my committee, Dr. Bryce Reeve, Dr. David Hofmann, and Dr. Michael Christian for their help in completing my dissertation. I really appreciate your insight and guidance throughout the entire process.
I also would like to thank my classmates and friends for their support.
vii
TABLE OF CONTENTS
LIST OF TABLES ... x
LIST OF FIGURES ... xi
LIST OF ABBREVIATIONS ... xii
CHAPTER 1: INTRODUCTION ... 1
CHAPTER 2: LITERATURE REVIEW ... 7
Overview of Barriers to Clinical Trial Enrollment ... 7
Success of the CCOP Network ... 9
Physician Predictors of Clinical Trial Enrollment ... 11
Incorporating Organizational Context in Research ... 13
Innovation Implementation Frameworks ... 16
CHAPTER 3: STUDY DESIGN AND METHODS ... 18
Overview and Rationale ... 18
Research Questions and Hypotheses ... 19
Data ... 19
Study Sample ... 21
Overview of Statistical Analyses ... 23
Study Size and Power ... 26
viii
CHAPTER 4: ORGANIZATIONAL AND PHYSICIAN FACTORS ASSOCIATED WITH PATIENT ENROLLMENT IN
CANCER CLINICAL TRIALS ... 31
Overview ... 31
Background ... 32
Methods ... 34
Results ... 40
Discussion ... 42
Conclusion ... 46
Tables and Figures ... 48
CHAPTER 5: THE MISSING LINK: A TEST OF KLEIN AND SORRA’S PROPOSED RELATIONSHIP BETWEEN IMPLEMENTATION CLIMATE, INNOVATION-VALUES FIT, AND IMPLEMENTATION EFFECTIVENESS ... 53
Overview ... 53
Background ... 54
Methods ... 57
Results ... 67
Discussion ... 68
Conclusion ... 73
Tables and Figures ... 75
CHAPTER 6: THE IMPORTANCE OF IMPLEMENTATION CLIMATE IN HEALTHCARE IMPLEMENTATION EFFECTIVENESS ... 80
Overview ... 80
Background ... 80
New Contribution ... 83
ix
Results ... 93
Discussion ... 97
Conclusion ... 102
Tables and Figures ... 104
CHAPTER 7: SUMMARY OF FINDINGS AND IMPLICATIONS FOR POLICY, PRACTICE, AND RESEARCH ... 111
Summary of Findings ... 111
Policy and Practice Implications ... 113
Research and Theory Implications ... 115
Limitations ... 118
Future Directions ... 119
Conclusion ... 121
APPENDIX: INTERACTION BETWEEN IMPLEMENTATION CLIMATE AND INNOVATION-VALUES FIT USING LINEAR REGRESSION ... 122
x
LIST OF TABLES
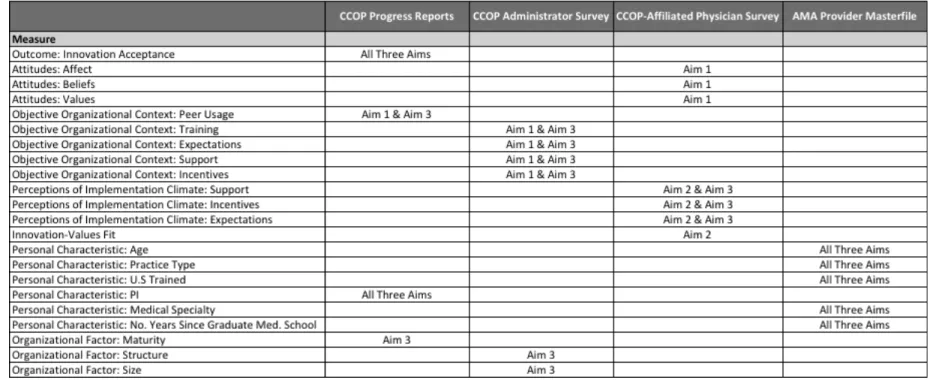
Table 1: Variables, Measures, and Data Sources for All Aims ... 28
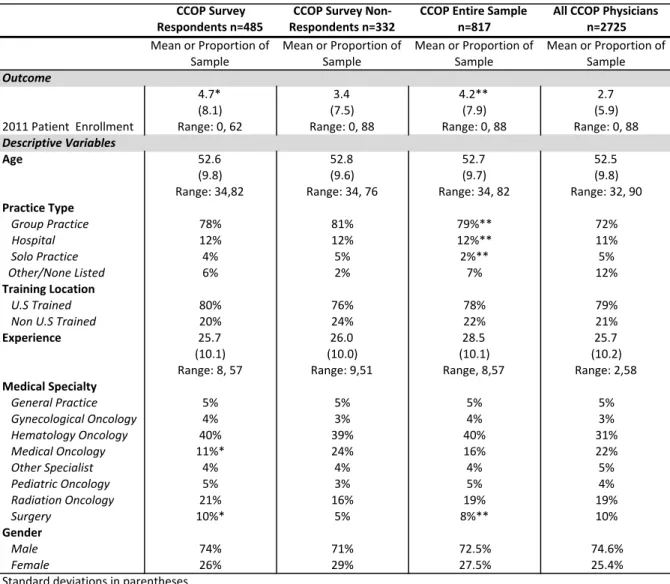
Table 2: Descriptive Statistics, All Three Aims ... 29
Table 3: Intraclass Correlations and Interrater Agreement Statistics for Physician Survey Questions ... 30
Table 4: Overview of Variables and Measures for Aim 1 ... 48
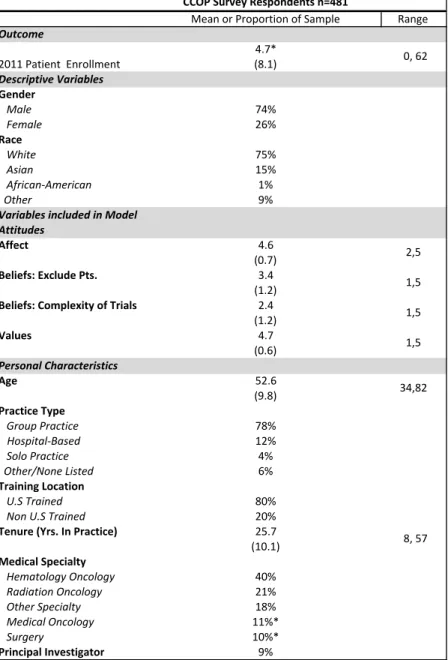
Table 5: Descriptive Statistics Aim 1 Physician Level Variables ... 49
Table 6: Descriptive Statistics, Aim 2 ... 75
Table 7: SEM Results, Aim 2 ... 76
Table 8: Descriptive Statistics CCOP Physicians ... 104
Table 9: Descriptive Statistics CCOP Organizations ... 105
xi
LIST OF FIGURES
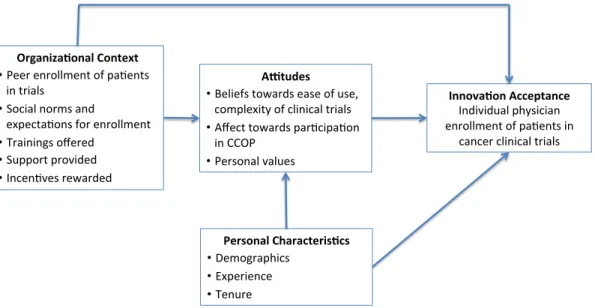
Figure 1: Individual Innovation Acceptance in Organizations ... 50
Figure 2: Tested Model of Individual Innovation Acceptance in Organizations ... 51
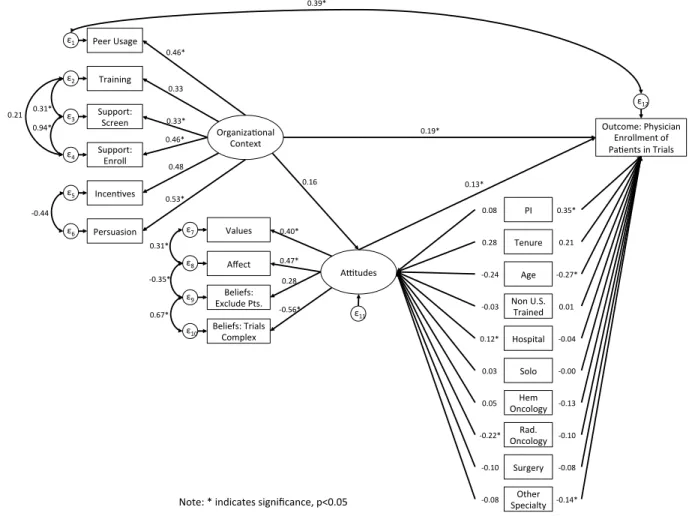
Figure 3: Standardized SEM Results Aim 1 ... 52
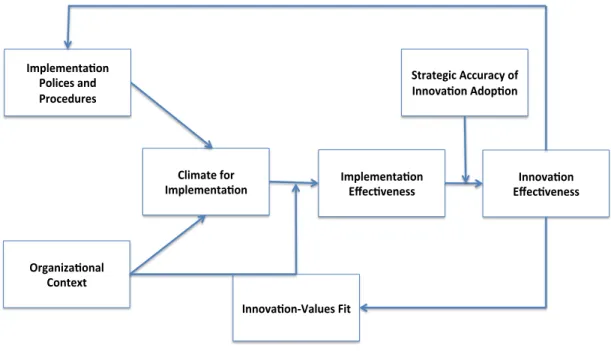
Figure 4: Determinants, Consequences, and Modifiers of Implementation Effectiveness, as Articulated in Klein & Sorra, 1996; Weiner, 2011 ... 77
Figure 5: Determinants and Consequences of Implementation Effectiveness, as Illustrated in Klein & Sorra, 1996 ... 77
Figure 6: Determinants and Modifiers of Implementation Effectiveness Model, as Tested ... 78
Figure 7: Standardized SEM Results, Aim 2 ... 79
Figure 8: The Impact of Implementation Climate on Physician Enrollment ... 107
Figure 9: Original Proposed SEM Model, Aim 3 ... 108
Figure 10: Final SEM Model with Standardized Estimate, Aim 3 ... 109
xii
LIST OF ABBREVIATIONS ACA Patient Protection and Affordable Care Act AMA American Medical Association
CCOP Community Clinical Oncology Program CFI Comparative Fit Index
ICC Intraclass Correlations LR Likelihood-Ratio
MB-CCOP Minority-Based Community Clinical Oncology Program NCI National Cancer Institute
NCI/DCP National Cancer Institute Division of Cancer Prevention
NCORP National Cancer Institute Community Oncology Research Program IPP Implementation Policies and Practices
PI Principal Investigator
RMSEA Root mean square error of approximation SEM Structural Equation Modeling
1
CHAPTER 1: INTRODUCTION
Cancer clinical trials are instrumental in the development of innovative cancer treatments as well as in the expansion of current diagnostic, control, and prevention techniques. Evidence demonstrates that cancer clinical trials have the potential to not only improve health outcomes for participating patients, but may also increase the quality of cancer care more generally by facilitating translation of research discoveries into clinical practice (Sorbye et al., 2009) (Grunfeld et al., 2002). Despite the potential for positive health outcomes, only 3-5% of adults with cancer in the United States actually participate in a cancer clinical trial (NCI Cancer Bulletin, 2010).In an effort to improve enrollment among all cancer patients, there has been an increasing interest in developing specific interventions to enhance patient participation in cancer clinical trials.
Patients can typically enroll in four types of cancer clinical trials. Cancer treatment
trials test the efficacy and safety of new therapies. Cancer prevention trials test new
interventions aimed at lowering the risk of developing cancer. Cancer prevention trials may include people who have a higher than average risk of developing cancer or are cancer survivors. Cancer screening and diagnostic clinical trials test new ways of detecting and/or diagnosing cancer earlier and more accurately. Screening trials often include patients with no signs of cancer while diagnostic trials often include people who have some signs or symptoms of cancer. Lastly, cancer quality of life or symptom
2
cancer patients and/or cancer survivors. Clinical trials can be sponsored by government agencies such as the National Cancer Institute (NCI) or the Veterans Health
Administration, but they can also be sponsored by other organizations such as foundations, biotechnology and pharmaceutical companies, or academic medical centers (NCI, 2010).
One intervention aimed at increasing patient participation in NCI-sponsored clinical trials is the Community Clinical Oncology Program (CCOP), a cancer-focused provider-based research network administered by NCI. The goal of the CCOP network is to engage community physicians in NCI-sponsored clinical trials in order to enhance the incorporation of research results into practice (NCI, 2010). The CCOP network is a joint venture between NCI, clinical cooperative groups or research bases (which design and develop specific clinical trial protocols), and community-based physicians and hospitals (Kaluzny et al., 1994). The CCOP network is administered by NCI’s Division of Cancer Prevention, which provides overall direction and funding for community hospitals and physicians to participate in clinical trials. The CCOP clinical cooperative groups support the design and execution of clinical trials, and the individual community-based
physicians and hospitals assist with patient enrollment, data collection, and dissemination of study findings (Kaluzny et al., 1994) (Minasian et al., 2010).
3
in cancer clinical trials. It is well known that context is an important determinant of both organizational and individual behavior or performance (Kozlowski & Klein, 2000). Research to date has sought to identify the organizational and environmental contextual factors that drive patient clinical trial enrollment at the CCOP level (Kaluzny et al., 1995) (Carpenter et al., 2012) (Weiner et al., 2012) (Jacobs et al., 2013). However, no
research has examined the individual physician characteristics and organizational contextual factors that predict CCOP physician success in enrolling patients in trials. Thus, there is a critical need to determine the context within which we can increase physician enrollment of cancer patients in cancer clinical trials. Context can be included in a study in three different ways. First, by including objective measures of context in a model that predicts individual performance. Second, by examining the role of
4 hospital or clinic.
The overall research question was to understand the role of physician characteristics and organizational context in predicting the enrollment of patients in NCI-sponsored cancer clinical trials among CCOP-affiliated physicians. The central hypothesis was that organizational contextual factors and physician
characteristics would directly and indirectly determine physician performance. This central hypothesis was tested in three separate aims.
• Aim 1: To determine the physician characteristics and objective assessments of organizational context associated with higher enrollment of patients in NCI-sponsored cancer clinical trials.
• Aim 2: To examine the physician characteristics and physicians’ perceptions of organizational context associated with higher enrollment of patients in NCI-sponsored cancer clinical trials.
• Aim 3: To evaluate the objective assessments of organizational context and physicians’ perceptions of organizational context associated with higher enrollment of patients in NCI-sponsored cancer clinical trials.
This dissertation utilized data from four sources: 1) 2011 Annual CCOP Progress Reports; 2) 2011 CCOP Administrator Survey; 3) 2011 CCOP-Affiliated Physician Survey; and 4) 2012 AMA Physician Masterfile. The CCOP Progress Reports provide information on each CCOP’s research and enrollment activities for the previous nine months and were primarily used to determine the dependent variable, patient
5
as well as to better understand physician participation in the CCOP network. The CCOP Administrator Survey was primarily used for the objective assessments of organizational context in Aims 1 and 3 while the Physician Survey was used to determine physicians’ attitudes (Aim 1) and perceptions of organizational context for Aims 2 and 3. The
physicians who responded to the physician survey (n=485) comprised the sample for all three aims. Lastly, AMA data were used to determine the physician characteristics included in all three aims.
The analytical approach for all three aims was structural equation modeling (SEM). SEM is advantageous as it allows researchers to test latent constructs that are not directly assessed, but rather are composed of observed data (e.g., organizational context, implementation climate, innovation-values fit). Second, SEM also takes into account measurement error by including error variables in the error portions of the observed variables; therefore conclusions about relationships are not biased by any measurement error. Lastly, SEM allows researchers to test complex frameworks that include mediation and moderation in a single model (Werner & Schermelleh-Engel, 2009).
Determining the multilevel predictors of CCOP-affiliated physician success in enrolling patients in cancer clinical trials has significant policy and scientific implications. This dissertation contributes to the current knowledge base by identifying both individual physician characteristics and organizational contextual factors that predict
CCOP-affiliated physician enrollment of patients in cancer clinical trials. This contribution is both innovative and significant for its potential to be used as the foundation for
6
as physician adoption of innovations more generally. These findings are particularly important as NCI builds upon the success of the CCOP program and replaces both CCOP and the NCI Community Cancer Centers Program (NCCCP) with the NCI Community Oncology Research Program (NCORP). In addition, this dissertation also examined all three ways organizational context can be incorporated into models that predict individual behavior. By using models traditionally examined in management and information systems, we extended the settings in which innovation implementation theories may be applicable. In addition, we provided evidence for adapting these theories to examine individual level innovation implementation.
The dissertation is organized as follows: Chapter 2 discusses the current
7
CHAPTER 2: LITERATURE REVIEW
Overview of Barriers to Clinical Trial Enrollment
As discussed, studies estimate that only 3-5% of adults with cancer participate in cancer-related clinical trials (NCI Cancer Bulletin, 2010). Specific enrollment in NCI-sponsored breast, colorectal, lung, and prostate cancer clinical trials has been shown to be as a little as 1.8% among adults with these types of cancer. Enrollment tends to be lowest among racial and ethnic minorities, women, and the elderly (Murthy et al., 2004). Research demonstrates that barriers to successful patient enrollment occur at the patient, physician, and organizational levels (Winn, 1994). Despite evidence that cancer survivors are receptive to participating in a cancer clinical trial if their physician asked them to do so, some patients are still reluctant to enroll (Comis et al., 2003) (Comis et al., 2009). Patients may have concerns over the cost and/or coverage of the trial or lack transportation to the trial site (Mills et al., 2006). In addition, some patients report
8
2000). For example, 40% of patients of who were aware of a clinical trial, but declined to participate, noted they were concerned that the new treatment might not be as effective as the standard treatment (Comis et al., 2009).
Physician-level barriers include concerns over the potential effect on the
physician-patient relationship, as well as attitude towards and knowledge of the clinical trials themselves (Winn, 1994). For example, some physicians may be concerned that they may lose contact with and control over the care of their patients once they enroll in clinical trials (Mansour et al., 1994). In addition, some physicians may not be aware of all the available trials and trial eligibility requirements for patients; they may also lack the time it takes to understand the nuances of the trial and follow-up with patients regarding the details of the specific protocol (Mansour et al., 1994). For example, in one study physicians immediately did not even consider a clinical trial for 38% of patients with cancer. The primary reason stated was no available protocol. Although the authors did confirm that for a small portion of patients no protocol was available, physicians were excluding patients even before reviewing what trials were available and the associated eligibility criteria. The authors believed that these physicians lacked the appropriate knowledge of open trials and were not even considering clinical trials for patients based on misconceptions of ideal eligible patients (Lara et al., 2001). Another important barrier to clinical trial enrollment are physician biases that the trial therapy is not as good as the standard therapy. Although rarely if ever is the trial therapy not as good as the standard therapy, some physicians may be biased to think so (Mansour et al., 1994).
9
to supporting cancer clinical trials, including the lack of support staff to help consent and enroll eligible patients (Shea et al., 1992). Other organizational barriers include having a limited number of trials available for physicians to enroll patients (Jacobs et al., 2013) (Weiner et al., 2012). Physicians also note that their organization could help facilitate patient enrollment by providing a synopsis of all open trials available at the point of care, simplifying enrollment forms, individualizing forms for each trial with specific information regarding specific tests, chemotherapy dose, and hiring additional trained staff to not only assist physicians with consenting and enrolling patients, but in the decision making process as well to help determine the appropriateness of a clinical trial for a patient (Fisher et al., 1991). Thus, successful interventions should try to alleviate barriers at the patient, physician, and organizational levels in order to increase the number of adults with cancer that enroll in a clinical trial.
Success of the CCOP Network
The CCOP started in 1983 with the goal of engaging community physicians in NCI-sponsored clinical trials to improve the incorporation of clinical research results into practice. The program is complemented by the Minority-Based CCOP network (MB-CCOP), which began in 1990 as a means to provide the infrastructure for clinical trials in those institutions, which serve communities with large minority and underserved populations (NCI, 2011). The CCOP and MB-CCOP network are administered by NCI’s Division of Cancer Prevention, which provides overall direction and funding for
10
practices. A MB-CCOP site must meet the same requirements as the CCOPs, but must also have a population that is at least 40% minority or underserved. In addition,
academic institutions are permitted to be MB-CCOPs, whereas they may not serve as the lead organization for a CCOP. The CCOP and MB-CCOP sites also affiliate with Research Bases, which design and develop the specific clinical trial protocols. Each site may affiliate with multiple Research Bases (NCI, 2011). When the data were collected in 2011, there were 47 CCOPs across 28 states. The CCOPs included over 450 hospitals and physician practices, with the average CCOP comprised of about 10 hospitals and/or practice sites. CCOPs also included over 3,500 physicians, with the average CCOP composed of 48 physicians. Patient accrual to clinical trials is counted at the CCOP organizational level and at the individual physician level. CCOPs overall are required to enroll at least 100 patients per year across all types NCI-sponsored clinical trials (NCI, 2011). There is no current formal NCI requirement for individual physicians to enroll a minimum number of patients per year, although some CCOPs have instituted their own expectations for enrollment.
Physicians practicing at MB-COOPs were not analyzed in this dissertation as MB-CCOP affiliated physicians were included in the 2011 Physician Survey due to organizational differences between MB-CCOPs and CCOPs. As mentioned, academic medical centers are often the main site for MB-CCOPs. In addition, MB-CCOPs tend to be located in more urban areas as they are focused on enrolling minority and
underserved patients. As expected the patient population seen at MB-CCOPs differ than those seen at CCOPs.
11
enrollment in sponsored cancer treatment trials and 50% of the enrollment in NCI-sponsored cancer prevention and symptom management trials (Minasian et al., 2010). The program was been successful due to its ability to address barriers among patients, providers, and practices. The CCOP network not only provides organizational resources and support for physicians to enroll patients, it also allows patients to enroll in clinical trials in their community, at their local hospital or physician’s office, or where they most often seek care.
To date, research has focused on identifying the organizational and
environmental contextual factors that explain why programs are successful at the CCOP organizational level. Significant organizational contextual factors include the number and type of locations where patients can enroll, the number of research base affiliations, the number of hours per week worked by data managers, the number of active CCOP physicians, the number of open trials, the number of support staff, policies that
recognize high accruing physicians, and the volume of new cancer patients (Kaluzny et al., 1995) (Carpenter et al., 2012) (Weiner et al., 2012) (Jacobs et al., 2013). Key environmental contextual factors that predict CCOP level enrollment includes managed care penetration, hospital competition, and number of medical school affiliated hospitals in regions where CCOPs operate (Carpenter et al., 2006) (Carpenter et al., 2012). No current efforts, however, have examined the drivers of individual physicians’ enrollment of patients in cancer clinical trials among CCOP physicians.
Physician Predictors of Clinical Trial Enrollment
12
however, examined physician characteristics that are generally associated with clinical trial participation. Physician characteristics associated with increased cancer clinical trial participation include medical specialty (i.e., medical oncologists compared to radiation oncologists), practice type (i.e., office-based practice compared to hospital based practice), prior participation in clinical trials, number of newly diagnosed patients seen, time spent with newly diagnosed cancer patients, training medical students or residents, and weekly tumor board participation (Klabunde et al., 2011). Research also demonstrates that foreign-trained oncologists and oncologists who had participated in
either pharmaceutical company sponsored trials or cooperative group sponsored trials,
compared to those that participated in both types of trials tend to refer less patients to cancer clinical trials. In addition, physician age, race, and gender were generally not associated with cancer clinical trial participation (Klabunde et al., 2011) (Meropol et al., 2007).
Physician knowledge and attitudes also influence patient enrollment. For example, oncologists’ attitudes towards the value and importance of clinical trials directly influences whether a patient enrolls in a trial (Mansour et al., 1994). One study found that when physicians offered a cancer clinical trial to their patients and their patients understood that they were being offered a trial, 75% of patients agreed to enroll (Albrecht et al., 2008). Therefore, physicians are instrumental in the enrollment process as they are the conduit between the healthcare organization and the patient. Ultimately if a physician does not recommend a clinical trial to a cancer patient, it is extremely unlikely that that patient will enroll in a cancer clinical trial.
13
characteristics may drive patient enrollment in cancer clinical trials, notably, none of these studies were conducted exclusively among CCOP-affiliated physicians nor do they include organizational contextual factors in their analyses. Physician
characteristics that influence patient enrollment in cancer clinical trials may also differ among CCOP-affiliated physicians because they elect to participate in CCOP and therefore receive resource support from NCI to assist with screening and enrolling of eligible patients. Given that the mission of the CCOP network is to facilitate cancer clinical trial participation in local communities, CCOP-affiliated physicians may have a greater level of support and interest in encouraging their patients to enroll. Although, they may be different from other oncologists, there is still considerable variation among CCOP-affiliated physicians in their enrollment of patients. For example, in 2011,
approximately 40% of CCOP physicians enrolled no patients (mean: 3; range: 0-88). Variation in physician enrollment has been observed in the program since its inception, yet no studies have systematically examined the reasons why this variation may occur. Therefore this research fills a necessary gap in the current knowledge base by
evaluating the predictors of CCOP physicians’ enrollment of patients in NCI-sponsored cancer clinical trials.
Incorporating Organizational Context in Research
14
incentivize enrollment, minimum accrual expectations). To comprehensively assess the determinants of physician enrollment, this dissertation incorporated factors at both levels. Including individual characteristics in an analysis is relatively straightforward, organizational context, however, can be incorporated in multiple ways.
The first approach examines either objective measures of organizational context or study subjects’ perceptions of organizational context. Often specific frameworks do not specify whether the organizational context should be assessed objectively or from a subject’s point of view, rather the researcher decides in operationalizing the model and collecting the data. For example, in Choi’s work on innovation-use behavior, the model includes both individual characteristics and organizational context (2004).
An innovation is defined as an idea, practice, or object that is perceived as new by an individual or organization (Rogers, 1983). The decision to adopt an innovation often may occur at the organizational level, but individuals within the organization also have to decide whether they are going to use (i.e., accept) the innovation. Therefore, innovation-use behavior is often defined as either the intended or continued use of an innovation by an individual. It can be measured as frequency and/or intensity of
15
of trainings provided, he asked employees if they felt that had received enough training. In the second approach, researchers incorporate context through a model of climate, where individual perceptions mediate the relationship between objective measures of context and personal characteristics in predicting an outcome. James and Jones suggest that objective characteristics of the organizational context are
antecedents of climate, while individuals’ interpretive perceptions provide meaning to the context (1974). This view proposes that individual climate perceptions are a result of both organizational objective contextual factors and personal characteristics (Kozlowski & Klein, 2000). For example, the integrative model for continually “updating” an
individual’s knowledge and skills as to stay current with the latest innovations (i.e., an individual-level behavior) includes both personal characteristics and contextual factors (Kozlowski & Farr, 1988). The framework suggests that individual perceptions of the climate mediate the relationship between personal characteristics (e.g., age,
experience, tenure), organizational context (e.g., technology use, structure) and individual performance, including the ability to “update.”
In this research, we have the unique ability to be able to test all of these approaches of incorporating context, as the data were collected from CCOP
16 Innovation Implementation Frameworks
Given the objective to include organizational context in multiple ways, we
required three separate conceptual frameworks to guide the research, one for each aim. Interestingly, although there are a number of models for innovation implementation or implementation effectiveness at the organizational level, overall there are very few models that examine implementation at the individual level. The majority of past research has either focused on the individual acceptance of technologies, such as the Technology Acceptance Model and the Unified Theory of Acceptance and Use of Technology, or has examined individual-level behavior without incorporating
organizational context within the model, such as the Theory of Planned Behavior (Davis, 1989) (Venkatesh et al., 2003) (Ajzen, 1991).
One model that considers both individual- and organizational-level factors in predicting individual innovation acceptance is the Multilevel Framework of
Organizational and Individual Innovation Adoption (Frambach & Schilewaert, 2002). The Multilevel Framework of Organizational and Individual Innovation Adoption suggests that individual innovation acceptance is based on objective organizational contextual factors such as trainings offered, incentives rewarded, support provided, peer usage of the innovation, and expectations as well as personal characteristics such as attitudes, values, and demographics (Frambach & Schilewaert, 2002). We used this model to guide our analysis in Aim 1. The model is based only on objective assessments of organizational context, however, and thus is not relevant for the other two aims.
17
experience. Therefore in Aims 2 and 3, we adapted the theory of innovation implementation (Klein & Sorra, 1996) to explain individual level implementation
effectiveness. Specifically in Aim 2, we tested whether innovation-values fit moderates the effect of perceptions of implementation climate on enrollment (i.e., implementation effectiveness). In Aim 3, we incorporated objective assessments of context and tested whether perceptions of implementation climate mediates the relationship between objective assessments of organizational policies and practices that encourage
implementation and enrollment. These models are discussed in detail in Chapters 5 and 6 respectively.
18
CHAPTER 3: STUDY DESIGN AND METHODS
Overview and Rationale
This dissertation was a secondary analysis of data collected directly from CCOP physicians and administrators, annual CCOP Progress reports, and the AMA Physician Masterfile. The aims utilized a concurrent cross-sectional design to examine both the physician characteristics and organizational contextual factors associated with patient enrollment in NCI-sponsored cancer clinical trials. Each aim employed a separate conceptual framework. More detailed descriptions of the conceptual models are provided in Chapters 4-6 respectively. The dependent variable for all three aims is the number of patients physicians enroll in NCI-sponsored cancer clinical trials in 2011. Key physician variables included physicians’ attitudes and values (Aims 1 and 2), as well as characteristics such as experience, medical specialty, and training (All three aims). Key organizational-level variables include organizational contextual factors, such as policies and practices to support implementation (e.g., trainings offered, support provided, expectations instituted) (Aims 1 and 3). In the first aim, contextual factors were
19 Research Questions and Hypotheses
Aim 1 Research Question: What are the physician characteristics and objective
assessments of organizational context associated with higher enrollment of patients in
NCI-sponsored cancer clinical trials?
Aim 1 Main Hypothesis: Personal characteristics (e.g., specialty, experience), attitudes towards the CCOP program, and organizational context (e.g., training, support, expectations) will directly influence physician enrollment of patients in clinical trials. In addition, personal characteristics and organizational context will have indirect effects on enrollment operating through attitudes.
Aim 2 Research Question: What are the physician characteristics and physicians’ perceptions of organizational context associated with higher enrollment of patients in
NCI-sponsored cancer clinical trials?
Aim 2 Main Hypothesis: Physicians’ perceptions of how the innovation fits with their values will moderate the role between their perceptions of innovation climate (i.e., a climate that supports, rewards, provides expectations regarding participating in CCOP) and physician enrollment of patients in clinical trials. Aim 3 Research Question: Are objective assessments of organizational context and physicians’ perceptions of organizational context associated with higher enrollment of
patients in NCI-sponsored cancer clinical trials?
Aim 3 Main Hypothesis: Physician perceptions of implementation climate will mediate the effect of objective assessments of organizational implementation policies and practices on physician enrollment of patients in trials.
Data
Data for this dissertation came from four sources: 1) 2011 Annual CCOP Progress Reports; 2) 2011 CCOP Administrator Survey; 3) 2011 CCOP-Affiliated Physician Survey; and 4) 2012 AMA Physician Masterfile. Data from all four sources were linked and de-identified for each respective analysis (Table 1).
20
a progress report to NCI detailing the previous nine-month’s research and enrollment activities. The report includes standardized questions regarding the allocation of CCOP resources, staffing assignments, total cancer patient volume, the number of open
cancer clinical trials, the total number of patients each CCOP enrolls, as well as the total number of patients each individual CCOP-affiliated physician enrolls. This study utilized the 2011 Progress Reports submitted in March 2012, which cover the period from June 2011 to February 2012. The 2011 Progress Reports overlap in timing with the 2011 CCOP Administrator and CCOP-Affiliated Physician Surveys. Specifically, the progress reports were used in all three aims to determine the dependent variable as well as to determine if a physician was the CCOP Principal Investigator (PI). Average physician enrollment by CCOP was also used in Aim 1.
2011 CCOP Administrator Survey. As part of the Implementing System
Intervention to Close the Discovery-Delivery Gap Grant (5R01CA124402), we
conducted a survey of CCOP administrators in Fall 2011. The goal was to learn more about how the CCOPs are organized and how they operate. All CCOP administrators participated (n=47) in the survey. The survey asked specific questions regarding the CCOP organizational structure, sponsored educational trainings, physician resources and support for screening, consenting, and enrolling patients, as well as CCOP staffing procedures. Specifically, Administrator Survey was used to assess the objective
organizational context factors in Aims 1 and 3.
2011 CCOP-Affiliated Physician Survey. Also as part of the Implementing
21
about physician participation in the CCOP program. The survey did not include physicians who practice at one of the 15 MB-CCOP. The physician survey asked specific questions regarding physicians’ perceptions regarding expectations for enrollment, research support provided by the CCOP, ability to provide input, how well they are kept informed of CCOP activities, recognition received from the CCOP, as well as personal beliefs, attitudes, and values regarding the importance of cancer clinical trials. Specifically, the physician survey was used to assess personal characteristics and attitudes in Aim 1. It was also used to determine innovation-values fit in Aim 2. In addition, it was used to for the physicians’ perceptions of climate in Aims 2 and 3.
2012 AMA Physician Masterfile. Established by the AMA in 1906, the Physician
Masterfile includes current and historical data for more than 1.4 million physicians, residents, and medical students in the U.S. This includes approximately 400,000 foreign medical graduates practicing in the U.S. A record is established when individuals enter medical school, or in the case of international medical graduates, upon entry into a
post-graduate residency or when they obtain a U.S medical license. The AMA Masterfile
contains demographic information, such as age and gender, as well as specialty,
experience, and medical school training and residency. The Masterfile also contains
information on practice location, type, and size. Specifically, the Masterfile was used to
characterize the physicians in the sample. Demographics, expertise, and experience
were included in the model for all three aims.
Study Sample
22
2011 and January 2012. We surveyed a total of 817 physicians across all 47 CCOPs. We achieved a response rate of 59%, which was in the range of rates previously
reported (45% to 79%) (Kellerman & Herold, 2001). Therefore, the final sample includes 485 physicians of whom, 74% were male and 26% were female (Table 2). In addition, approximately 75% were White non-Hispanic, 15% were Asian, and the remaining 10% were either African-American, Native Hawaiian/Pacific Islander, or reported multiple races. The average age was 53 years old (range 34 to 82) with an average of 26 years experience (range 8 to 57). Physicians on average enrolled approximately 5 patients a year in 2011 (range 0 to 62) with a standard deviation of 8 patients. The vast majority practiced in a group practice (78%) and trained in the U.S (80%). In addition, 40% reported hematology oncology as their primary specialty, 21% reported radiation oncology, 11% reported general non-specialized oncology, 10% reported some type of surgery, and the remaining 18% reported either general practice, gynecology oncology, pediatric oncology, or other type of specialist as their medical specialty.
In addition to generating the descriptive statistics for actual survey respondents, we also examined the descriptive statistics among non-survey respondents, the entire sample of surveyed CCOP physicians, and the population of all CCOP physicians to ensure the sample was not subject to any biases. There were two significant differences between survey respondents and non-respondents. First, in terms of specialty,
23 standard deviation of 7.5).
We also tested to see if there were any significant differences between those that were sampled compared to the CCOP physician population. Our sample was slightly over representative of physicians practicing in group practices (79% v. 72%) and
hospitals (12% v. 11%), and slightly under representative of physicians in solo practices (2% v. 5%) and surgeons (8% v. 10%). In addition, those that were sampled enrolled on average 4 patients per year in 2011 (range 0 to 88; standard deviation 8) compared to those that were not sampled, which only enrolled on average 2 patients per year (range 0 to 44; standard deviation 4). Although these differences were statistically significant, overall they are not likely to significantly influence the generalizability of study findings. Overview of Statistical Analyses
Intraclass Correlations and Interrater Agreement
For each physician survey question, we tested the consistency in responses of members of the same CCOP compared to members in different CCOPs by calculating intraclass correlation coefficients, ICC(1) and ICC(2). This provided a sense of the proportion of group-level variance accounted for by group membership. In addition, we also tested the within-group interrater agreement by calculating r*WG(J) indices. Overall
the results indicate that there was substantial variation in responses (Table 3). The ICC(1) values were low, and the ICC(2) values which vary as a function of the ICC(1) values and the sample size, were also modest.
The interrater agreement statistics demonstrated that for some measures, such as affect (r*WG(J) =0.77) and values (r*WG(J) =0.82), there was strong agreement among
24
composed the innovation-values fit construct (Want offer trials r*WG(J) =0.88;
Participating important r*WG(J) =0.79; Value participating r*WG(J) =0.82; Explore important
issues r*WG(J) =0.77). For other measures, however, such as beliefs regarding the
complexity (r*WG(J) =0.32) and exclusively (r*WG(J) =0.41) of the trials there was only
modest agreement. The inter-rater agreement statistics were also modest for perceived expectations for the number of patients physicians are expected to enroll (r*WG(J) =0.01)
and for the support needed to identify (r*WG(J) =0.27) and enroll patients (r*WG(J) =0.37).
Physicians also disagreed as to whether they were recognized (r*WG(J) =0.23) and
appreciated (r*WG(J) =0.21) for enrolling patients. Although many of these results indicate
that several of the constructs could be assessed at the group level (i.e., innovations-value fit), we were most interested in examining enrollment at the individual physician level.
Structural Equation Modeling
For each aim, we utilized SEM to analyze the results. There are many advantages of using SEM. For example, SEM allows researchers to test latent constructs that are not directly assessed, but rather are composed of observed data (e.g., attitudes, innovation-values fit, perceptions of implementation climate,
organizational context). SEM also takes into account measurement error by including error variables in the error portions of the observed variables; therefore conclusions about relationships are not biased by any measurement error. SEM is also
25
indirect and direct effects of variables on the outcome (Werner & Schermelleh-Engel, 2009).
There are five main steps involved in SEM. First, we specified each model. Second, we checked to ensure the model was identified, which means the number of parameters must be less than or equal to the number of observations (Norman & Streiner (eds), 2003). Third, we worked to fit and evaluate the model. We used maximum likelihood estimation techniques, given we had very little data missing. We also used clustered-robust standard errors as errors were likely correlated and we wanted to adjust for the 47 CCOPs. We then tested the fit of the model using the typical goodness-of-fit statistics. We examined the root mean square error of approximation (RMSEA), and the associated confidence interval and p-value. RMSEA values below 0.06 are considered acceptable with an upper bound of the confidence interval lower than 0.1. We also examined the Comparative Fit Index (CFI) and the Tucker-Lewis Index (TLI), and the standardized root mean squared residuals (SRMR). The CFI and TLI ideally should be above 0.90, and an ideal SRMR should be close to zero (lower than 0.08 is considered acceptable) (Norman & Streiner (eds), 2003) (Schreiber et al., 2006). Fourth, we modified the original models and made any necessary changes to improve fit (e.g., add covariances). Lastly, after we achieved the best fitting model, we interpreted the model and examined estimated standardized path coefficients and
corresponding standard errors. The general mathematical formula for SEM is as follows: Equation 1: Υ = ΒΥ + ΓΧ + α + ζ
26
side is composed of the observed endogenous measures (γ) and latent endogenous constructs (η). Χ represents both the observed exogenous measures (x) and the latent
exogenous constructs (ξ). Β and Γ are the coefficient estimates for the endogenous and exogenous variables, α are the intercepts, and ζ represents the error (e.η e.γ)
associated with the model. I can also estimate κ, the means of the exogenous variables,
Φ, the variances and covariances of the exogenous variables, and Ψ, the variances and covariances of the error terms.
Study Size and Power
The general rule regarding sample size for SEM is that 5 to 10 subjects per parameter included in the model are needed. In SEM, the number of parameters is based on: 1) the number of pathways in the model; 2) the number of variances for the exogenous variables; 3) the number of covariances in the model; and 4) the number of disturbance terms for the endogenous variables. For Aim 1, we had 64 parameters (44 pathways, 10 variances for exogenous variables, 8 covariances, and 2 disturbance terms). For Aim 2, we had 47 parameters (33 pathways, 10 variances, 3 covariances, and 1 disturbance term). Lastly for Aim 3, we had 73 parameters (52 pathways, 12 variances, 7 covariances, and 2 disturbance terms). Thus we needed a minimum of 365 to 730 physicians in the sample. Although we only had 485 physicians in the sample, we did not encounter any problems using SEM given all three models were identified.
27
for Aim 3 (27 variables). Thus the models were identified for all three aims.
• Aim 1: 231 observations > 64 parameters
• Aim 2: 210 observations > 47 parameters
• Aim 3: 392 observations > 77 parameters
28
!
29
CCOP$Survey$
Respondents$n=485 Respondents$n=332CCOP$Survey$Non7 CCOP$Entire$Sample$n=817 All$CCOP$Physicians$n=2725
Mean%or%Proportion%of%
Sample% Mean%or%Proportion%of%Sample% Mean%or%Proportion%of%Sample% Mean%or%Proportion%of%Sample%
2011%Patient%%Enrollment% 4.7*% (8.1) Range:%0,%62 3.4 (7.5) Range:%0,%88 4.2** (7.9) Range:%0,%88 2.7% (5.9) Range:%0,%88 Age 52.6 (9.8) Range:%34,82 52.8 (9.6) Range:%34,%76 52.7 (9.7) Range:%34,%82 52.5% (9.8) Range:%32,%90 Practice$Type
!!!Group!Practice 78% 81% 79%** 72%
%%%Hospital 12% 12% 12%** 11%
!!!Solo!Practice 4% 5% 2%** 5%
!!Other/None!Listed 6% 2% 7% 12%
Training$Location$
!!!U.S!Trained 80% 76% 78% 79%
!!!Non!U.S!Trained 20% 24% 22% 21%
Experience$ 25.7 (10.1) Range:%8,%57 26.0 (10.0) Range:%9,51 28.5 (10.1) Range,%8,57 25.7 (10.2) Range:%2,58 Medical$Specialty$
!!!General!Practice 5% 5% 5% 5%
!!!Gynecological!Oncology 4% 3% 4% 3%
!!!Hematology!Oncology 40% 39% 40% 31%
!!!Medical!Oncology 11%* 24% 16% 22%
!!!Other!Specialist! 4% 4% 4% 5%
!!!Pediatric!Oncology 5% 3% 5% 4%
!!!Radiation!Oncology 21% 16% 19% 19%
!!!Surgery! 10%* 5% 8%** 10%
Gender
!!!Male 74% 71% 72.5% 74.6%
!!!Female! 26% 29% 27.5% 25.4%
Descriptive*Variables Outcome* Table$2:$Descriptive$Statistics$All$Three$Aims$ Pediatric!Oncology%includes%child%neurology,%emergency%medicine%J%pediatrics,%pediatric%hematology%oncology,%pediatrics,%pediatric%surgery% Other!specialist%includes%anatomic%pathology,%anesthesiology,%cardiovascular%disease%,%dermatology,%endocrinology,% gastroenterology,%neurology,%otolaryngology,%pain%medicine,%psychiatry,%pulmonary%disease,%rheumatology,%urology Standard%deviations%in%parentheses% *%Indicates%significant%difference%between%survey%respondents%and%nonJrespondents%at%.05%significance% **Indicates%significant%difference%between%sample%and%population%at%.05%significance% Surgery%includes%abdominal%surgery,%colon%and%rectal%surgery,%critical%care%sugary,%dermatologic%surgery,%general%surgery,% neurological%surgery,%orthopedic%surgery,%plastic%surgery,%surgical%oncology,%spinal%cord%injury,%thoracic%surgery,%urological% General!practice%includes%addiction%medicine%emergency%medicine,%family%practice/medicine,%geriatric%medicine,%hospice%and%palliative%medicine,%general%practice,%preventative%medicine,%internal%medicine Gynecological!oncology!includes%gynecological%oncology,%general%gynecology,%gynecological%surgery% Hematology!oncology%includes%blood%banking,%hematology%oncology,%hematology Oncology%includes%medical%oncology,%oncology Radiation!Oncology%includes%diagnostic%radiology,%nuclear%medicine,%radiation%oncology,%radiology,%vascular%and%interventional%radiology
30
Table 3: Intraclass Correlations and Interrater Agreement Statistics for Physician Survey Questions
Construct) Measure) Aim(s) ICC(1) ICC(2) Average)R*
WG(J)
%)Significant )R*WG(J)
Attitudes:)Affect NCI/sponsored)trials)explore)clinical)issues)that)are)important)in)my)practice) 1 (0.02)0.00) /0.04 0.77 89%
Attitudes:)Beliefs) NCI/sponsored)trials)exclude)too)many)patients) 1 ()0.03)0.07* 0.44 0.41 40%
Attitudes:)Beliefs) NCI/sponsored)trials)are)too)complex)to)do)in)my)practice) 1 ()0.03)0.08* 0.46 0.32 36%
Attitudes:)Values) I)value)participating)in)NCI/sponsored)clinical)trials 1 ()0.02)0.01 0.09 0.82 94%
1 (0.03)0.06* 0.38 0.96 100%
Innovation/Values)Fit I)want)to)offer)NCI/sponsored)clinical)trials)to)my)patients) 2 (0.02)0.00) 0.00 0.88 98%
Innovation/Values)Fit Participating)in)NCI/sponsored)clinical)trials)is)important)to)me) 2 (0.02)0.02 0.18 0.79 91%
Innovation/Values)Fit I)value)participating)in)NCI/sponsored)clinical)trials 2 ()0.02)0.01 0.09 0.82 94%
Innovation/Values)Fit NCI/sponsored)trials)explore)clinical)issues)that)are)important)in)my)practice) 2 (0.02)0.00) /0.04 0.77 89%
2 ()0.02)0.01 0.10 0.92 100%
Perceptions)of)Implementation) Climate:))Rewards
I)receive)appreciation)when)I)enroll)patients)in) NCI/sponsored)clinical)trials 2)&)3
0.05*
(0.03) 0.36 0.21 15%
Perceptions)of)Implementation)
Climate:))Rewards I)receive)recognition)when)I)enroll)patients)in)NCI/sponsored)clinical)trials 2)&)3 (0.03)0.07* 0.45 0.23 21% Perceptions)of)Implementation)
Climate:))Expectations I)am)expected)to)help)the)CCOP)meet)its)patient)enrollment)goals)in)NCI/sponsored)clinical)trials) 2)&)3 (0.02)0.03 0.22 0.41 47% Perceptions)of)Implementation)
Climate:))Expectations I)am)expected)to)enroll)a)certain)number)of)patients)in)NCI/sponsored)clinical)trials 2)&)3 (0.04)0.14* 0.63 0.01 11% Perceptions)of)Implementation) Climate:))Support I)get)the)research)support)that)I)need)to)identify) potentially)eligible)patients)for)NCI/sponsored) clinical)trials 2)&)3 0.07*
)(0.03) 0.44 0.27 26%
Perceptions)of)Implementation) Climate:))Support I)get)the)research)support)that)I)need)to)enroll)) patients)in)NCI/sponsored)clinical)trials)(e.g.,) consenting)patients) 2)&)3 0.08*
()0.03) 0.48 0.37 38%
2)&)3 ()0.03)0.08* 0.47 0.88 100%
31
CHAPTER 4: ORGANIZATIONAL AND PHYSICIAN FACTORS ASSOCIATED WITH PATIENT ENROLLMENT IN CANCER CLINICAL TRIALS
Overview
Our purpose was to identify physicians’ individual characteristics, attitudes, and
organizational contextual factors associated with higher enrollment of patients in cancer
clinical trials among physician participants in the National Cancer Institute (NCI)’s
Community Clinical Oncology Program (CCOP). We hypothesized that physicians’
individual characteristics, such as age, medical specialty, tenure, CCOP organizational
factors (i.e., policies and procedures to encourage enrollment), and attitudes towards
participating in CCOP would directly determine enrollment. We also hypothesized that
physicians’ characteristics and CCOP organizational factors would influence physicians’
attitudes towards participating in CCOP, which in turn would predict enrollment. We
evaluated enrollment in NCI-sponsored cancer clinical trials in 2011 among 481
physician participants using structural equation modeling. The data sources include
CCOP Annual Progress Reports, two surveys of CCOP administrators and physician
participants, and the American Medical Association Masterfile.
Physicians with more positive attitudes towards participating in CCOP enrolled
more patients than physicians with less positive attitudes. In addition, physicians who
practiced in CCOPs that had more supportive policies and practices in place to
encourage enrollment (i.e., offered trainings, provided support to screen and enroll
32
also significantly enrolled more patients. Physician status as CCOP Principal
Investigator (PI) had a positive direct effect on enrollment, while physician age and
non-oncology medical specialty had negative direct effects on enrollment. Neither
physicians’ characteristics nor CCOP organizational factors indirectly influenced
enrollment through an effect on physician attitudes.
We examined whether individual physicians’ characteristics and attitudes, as well
as CCOP organizational factors, influenced patient enrollment in cancer clinical trials
among CCOP physicians. Physician attitudes and CCOP organizational factors had
positive direct effects, but not indirect effects, on physician enrollment of patients. Our
results could be used to develop physician-directed strategies aimed at increasing
involvement in clinical research. For example, administrators may want to ensure
physicians have access to support staff to help screen and enroll patients or institute
minimum accrual expectations. Our results also highlight the importance of recruiting
physicians for volunteer clinical research programs whose attitudes and values align
with programmatic goals. Given that physician involvement is a key determinant of
patient enrollment in clinical trials, these interventions could expand the overall number
of patients involved in cancer research. These strategies will be increasingly important
as the CCOP network continues to evolve.
Background
Cancer clinical trials are instrumental for developing innovative cancer treatments
and expanding current diagnostic, control, and prevention techniques (Sorbye et al.,
2009) (Grunfeld et al., 2002). Despite the potential for positive health outcomes, only
33
2010). To increase patient participation in trials, the CCOP, a cancer focused
provider-based research network administered by the NCI, engages community physicians in
clinical research to enhance the translation of research results into practice (NCI, 2010).
Since its inception in 1983, the CCOP network overall has generated over 50% of the
enrollment in NCI-sponsored cancer prevention and control trials and 30% of the
enrollment in NCI-sponsored cancer treatment trials (Minasian et al., 2010)
Although the CCOP network has successfully increased cancer clinical trial
enrollment, individual physicians vary in their enrollment of patients in clinical trials.
Many participating physicians enroll no patients in a given year, while others enroll
dozens. In 2011, approximately 40% of CCOP physicians enrolled no patients (mean: 3;
range: 0-88). Variation in physician enrollment has occurred since the program’s
inception, yet the reasons have not been systematically investigated. Research to date
has focused on identifying the organizational and environmental contextual factors that
drive clinical trial enrollment at the CCOP, rather than the individual, level (Kaluzny et
al., 1995) (Carpenter et al., 2012) (Weiner et al., 2012) (Jacobs et al., 2013). No
research has examined physician and organizational contextual factors associated with
physicians’ success in enrolling patients. These findings are critical to determine the
context within which we can increase enrollment of cancer patients in NCI-sponsored
cancer clinical trials and, in turn, the pace at which we identify and disseminate
innovative therapies. Understanding factors that drive physician accrual will be critical in
the organizational design of the new NCI Community Oncology Research Program
(NCORP), for example, by setting minimum expectations for enrollment, recognizing
34
also inform physician recruitment efforts for NCORP.
This study seeks to identify the specific CCOP-affiliated physicians’
characteristics and organizational contextual factors associated with higher enrollment
of patients in NCI-sponsored cancer clinical trials. The hypothesis is that organizational
contextual factors, such as trainings, support to enroll patients, expectations for
enrollment, physicians’ attitudes towards participating in clinical trials, and individual
characteristics, such as age, tenure, medical specialty will directly and indirectly affect
their enrollment of patients in trials.
Methods
Theoretical Framework
The conceptual model is adapted from the Multilevel Framework of
Organizational and Individual Innovation Adoption (Frambach & Schilewaert, 2002).
Although this framework was developed in the marketing and management literature, it
has become a common approach to address innovation implementation in health and
human services research as well. For example, the framework has been integrated as
part of the Consolidated Framework for Implementation Research, which seeks to
advance the implementation of health services research findings into practice [12]. An
attractive feature of this framework is that it includes factors at both the organizational
and individual levels to predict innovation adoption (Damschroder et al., 2009). In this
study we focused on adoption among individual physicians.
The original model as developed by Frambach and applied to this setting is
presented in Figure 1. The model postulates that social usage of the innovation, such as
35
innovativeness (i.e., tendency to accept an innovation regardless of others) directly
determines individual innovation acceptance. Innovation acceptance in this study is
participation in clinical trials, defined as the number of patients CCOP physicians
enrolled in NCI-sponsored cancer clinical trials in 2011. The model also suggests that
social usage and personal disposition towards innovativeness determines individuals’
attitudes towards using the innovation, which in turn determines innovation acceptance.
Also included in the model are organizational facilitators (e.g., training, support,
incentives) and individual characteristics (e.g., demographics, experience) that may also
indirectly influence innovation acceptance through individuals’ attitudes and personal
disposition towards innovativeness respectively.
The model we tested adheres to the basic structure of the framework proposed
by Frambach (2002); however, based on data availability, theory, and knowledge of
CCOP network operation, we made three changes to the original model before
analyzing any data. The tested model is presented in Figure 2. First, we combined
social usage and organizational facilitators into one construct, organizational context.
We did this for two reasons: (1) it makes theoretical sense as all the data used for this
construct is at the CCOP level and (2) we only had two observed variables, peer
enrollment and expectations, to construct social usage, but the statistical modeling
approach required we use at least three observed variables (O’Brien, 1994). The
second change is that we did not include personal disposition towards innovativeness in
our model because we lacked data on this construct. Lastly, we included individual
values as a component of attitudes rather than an individual characteristic. We decided
36
beliefs towards the ease of participation, and complexity of clinical trials as components
of attitudes towards innovation adoption. Therefore it made theoretical sense to include
values as a component of attitudes versus an individual characteristic.
Study Setting and Sample
The CCOP network is a joint venture between the NCI Division of Cancer
Prevention, which provides overall direction and funding for community hospitals and
physicians to participate in clinical trials, clinical cooperative groups, and
community-based physicians and hospitals (Kaluzny et al., 1994). The CCOP research bases
design and conduct clinical trials, and individual community-based physicians and
hospitals assist with patient enrollment, data collection, and dissemination of study
findings (Minasian et al., 2010) (Kaluzny et al., 1994) When the data were collected in
2011, 47 CCOPs operated in 28 states with approximately 3,000 participating
community physicians.
The sample is comprised of physicians who responded to the 2011 CCOP
Physician Survey. We used a stratified (by CCOP) random sample of 817 physicians
across all 47 CCOPs. The final sample included 485 physicians (59.4% of the total
physicians surveyed). The only significant (p<0.05) differences between survey
responders and non-responders were that responders enrolled more patients per year
(4.7 versus 3.4), were more likely to be a surgeon (10% versus 5%), and were less
likely to be a non-specialized general oncologist (11% versus 24%). There were no
significant differences between respondents and non-respondents regarding gender,
race, age, practice type, training location, and tenure. This study was determined to be
37 at Chapel Hill.
Study Design and Data Sources
The data for this cross-sectional study were obtained from four sources. The
2011 CCOP Progress Reports provided data on physicians’ enrollment activity from
June 1, 2011 to February 29, 2012. The 2011 CCOP Administrator Survey and the 2011
CCOP Physician Survey were both administered as part of a larger NCI-funded-study
(5R01CA124402). The Physician Survey supplied data on CCOP physicians’ attitudes
towards participation in clinical trials. Responses were collected between October 2011
and January 2012. The Administrator Survey provided information on the CCOP
organizational contextual factors. The majority of responses were collected at the
annual CCOP meeting in September 2011. Any remaining surveys were completed in
October 2011. We achieved a 100% response rate from CCOP Administrators. Lastly,
the 2012 American Medical Association Physician Masterfile provided data on CCOP
physicians’ individual characteristics.
Measures
Table 4 provides details on our measures. The outcome was the number of
patients CCOP-affiliated physicians enrolled in NCI-sponsored cancer clinical trials in
2011. Physician attitudes, a predictor construct, was composed of questions assessing
beliefs related to the complexity of trials, whether trials excluded too many patients,
affect towards whether trials explored important issues, and physicians’ values related
to participating in clinical trials. Organizational contextual factors, also a predictor
construct, included educational trainings offered, support provided by the CCOP to
38
usage (i.e., the average number of patients enrolled in NCI-sponsored clinical trials for
physicians within a specific CCOP), and CCOP expectations for enrollment. Physicians’
individual characteristics included age, practice type, tenure, physician training location,
medical specialty, and whether or not the physician is the CCOP Principal Investigator
(PI).
Statistical Analysis
SEM with maximum likelihood estimation was used to simultaneously test the
effects of the latent constructs in our conceptual model (i.e., organizational contextual
factors, physician attitudes) on enrollment. SEM is composed of multivariate regression
models and can be used to estimate proposed causal relationships (Norman & Streiner
(eds), 2003) (Schreiber et al., 2006). We used confirmatory SEM to test the
hypothesized pathways among factors represented in Figure 2 by comparing how well
this proposed structure fits the observed data. We elected to use SEM because it
allowed us to test for constructs that are not directly assessed, but are instead
composed of observed indicators representing the constructs of interest (e.g., CCOP
organizational contextual factors, physician attitudes). We elected to use clustered
robust standard errors to account for clustering of physicians within 47 CCOPs. We
evaluated model fit using the Comparative Fit Index (CFI) and the Tucker-Lewis Index
(TLI). CFI and TLI values range from 0 to 1, with values ≥ 0.90 representing adequate fit
(Norman & Streiner (eds), 2003) (Schreiber et al., 2006). We also examined the root
mean square error of approximation (RMSEA), and the associated confidence interval
and p-value. RMSEA values < 0.05 and an upper bound of the confidence interval < 0.1
39
Next, we examined the standardized root mean squared residuals (SRMR), with values
< 0.08 considered acceptable fit (Norman & Streiner (eds), 2003) (Schreiber et al.,
2006). We also evaluated our model by testing the significance of all standardized
estimates, including the direct and indirect effects of variables on the outcome.
Based on these fit statistics for the original model in Figure 2, we elected to
re-specify the model to improve its fit. SEM is an iterative process in which model fit is
improved by using theory and modifications indices either to add additional pathways
between variables or to allow items to co-vary (Norman & Streiner (eds), 2003)
(Schreiber et al., 2006). Modification indices are the minimum that the chi-square
statistic is expected to decrease if the corresponding parameter is no longer assumed to
be fixed at zero (Norman & Streiner (eds), 2003) (Schreiber et al., 2006). When
revising the model, we tested whether model fit improved by comparing the baseline
model with the new model using the Lagrange multiplier test and fit statistics.
Once we achieved a well-fitting model, we tested the significance of all
standardized estimates, including direct and indirect effects. Standardized parameter
estimates are transformations of unstandardized estimates that remove scaling and can
be used for informal comparisons of parameters throughout the model (Schreiber et al.,
2006). Direct effects are equal to the regression coefficients (i.e., β) while indirect
effects are the product of the two regression coefficients. For example, if X predicts Y
and Y predicts Z, then the indirect effect of X on Z equals the product of the two
regression coefficients (X on Y and Y on Z). Lastly, to ensure the validity of our SEM
results, we checked our results using negative binomial regression analysis with
40 Results
Study Population
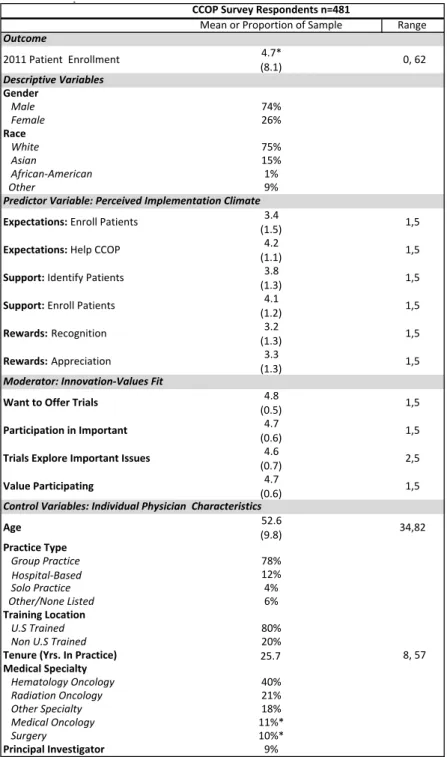
The final sample included 481 physicians with complete information. Table 5
provides descriptive statistics for the entire sample. Notably, 74% were male, 75% were
White non-Hispanic, and their mean age was 53 years; they have been in practice a
mean of 26 years. The vast majority practiced in group practices and trained in the U.S;
72% were oncology-based specialists, 10% were surgeons, and 18% reported another
medical specialty (e.g., gynecology, pediatrics, internal medicine). Physicians enrolled a
mean of 5 patients in 2011 (range: 0-62); approximately 40% of physicians enrolled no
patients in the 9-month reporting period.
SEM Analysis
The fit statistics and modification indices for the fixed parameters of the original
model tested in Figure 2 suggested that we re-specify the model to improve fit (CFI =
0.648; TLI = 0.560; RMSEA = 0.067; SRMR = 0.061). Therefore, we added seven
post-hoc modifications that were theoretically justified and improved model fit. Figure 3
presents the final model with all post hoc modifications and standardized estimates. For
these modifications, we allowed the error terms of the following measures to co-vary
higher than with other variables. For example, the percentage of doctors supported in
screening and enrolling patients, likely share common variation that is not explained by
any of the proposed relationships in the model.
1) Peer-usage with the outcome: Peer-usage is based on the individual physicians’
enrollment within a specific CCOP. We co-varied the error terms as they likely