AIRWAY MUCIN DYNAMICS IN INFECTION AND INFLAMMATION
Bethany Batson
A dissertation submitted to the faculty at the University of North Carolina at Chapel Hill in partial fulfillment of the requirements for the degree of Doctor in Philosophy in the Department of Pathology and Laboratory Medicine in the School of Medicine.
Chapel Hill 2019
ABSTRACT
Bethany Batson: Airway Mucin Dynamics in Infection and Inflammation (Under the direction of Mehmet Kesimer)
ACKNOWLEDGMENTS
Countless individuals have played a role in the creation, revision, and
completion of this body of work. My committee members, Dr. Claire Doerschuk, Dr. Marianne Muhlebach, Dr. Wanda O’Neal, Dr. Jonathon Homeister, and Dr. Mehmet Kesimer provided the encouragement and input that facilitated the completion of my work and graduate studies.
I would like to dedicate this work to my mentor, Mehmet Kesimer, who nurtured my enthusiasm for research and gave me the opportunity to become an independent investigator. This work would not have been possible without his blessing and guidance. Not only did you push me scientifically, but your continued support while I struggled with a difficult pregnancy and a newborn made finishing my PhD a reality. I have spent the past five years in the Kesimer lab, which have been filled with riveting scientific (and non-scientific) conversation, laughter, and
collaboration, and exciting science. Each member of the lab has enhanced my graduate experience with their specific area of technical expertise but also in other less scientific ways. From Giorgia Radicioni, I have learned about Italy and scuba diving; from Boris Reidel, everything German and Star Wars; from Jerome
a heightened appreciation for Baklava. I could never forget, the former lab manager and one of my best friends, Amina Ford, who taught me how to laugh through difficult times and that regardless of your title and position, with hard work you can achieve great things. I not only view these individuals as my labmates, but my friends and North Carolina family.
This work was truly a collaborative effort that involved numerous labs and core facilities within the CF center, and those both on and off UNCs’ campus. Within the Marsico Lung Institute and CF center I would like to acknowledge the following labs and cores: The CF Center Tissue Procurement and Cell Culture Core, The Molecular Biology Core, The Histology Core, The Michael Hooker Microscopy Core, and really the entire 7th floor of Marsico Hall. Outside of the CF center, I would like to recognize Dr. Brenda Temple from The UNC Center for Structural Biology, the High Throughput Genomic Sequencing Facility, Dr. Flavia Teles and Lynn Martin, and The UNC Animal Histopathology Core. Outside of UNC, I would like to acknowledge the fruitful collaboration with Dr. Tiemeyer and Tadahiro Kumagai from University of Georgia’s Complex Carbohydrate Research Center.
TABLE OF CONTENTS
LIST OF FIGURES ... xiv
LIST OF TABLES ... xix
LIST OF ABBREVIATIONS ... xxi
INTRODUCTION: MUCUS & MUCIN ... 1
CHAPTER 1. PART A: COMPREHENSIVE CHARACTERIZATION OF MUCINS WITHIN THE CF AIRWAY USING IN-VITRO MODELS ... 7
Introduction: Cystic Fibrosis ... 7
Methods ... 11
Cell Culture ... 11
CF cell culture models ... 11
Mucin Isolation and Static Light Scattering ... 12
Isolation and Analysis of Stored Gel Forming Mucins ... 13
Whole Mount Immunohistochemistry (IHC) ... 13
Agarose Gel Electrophoresis ... 14
Mass Spectrometry ... 15
Proteomic Semi-tryptic peptide analysis ... 17
Rate Zonal Centrifugation ... 17
Exosome Isolation ... 18
MUC5B and MUC5AC Standard In-Vitro Experimental Design ... 18
CF Cell Culture Models: Immunohistochemistry and MUC5B and
MUC5AC concentration quantitation ... 20 SMM: MUC5AC and MUC5B concentration quantitation ... 21 CF cell culture models: Macromolecular characterization of secreted
and intracellular gel forming mucins ... 21 Ps.a. cell culture model: MUC5B Semi-tryptic peptide analysis ... 23 CF cell culture models: Conformation analysis of the secreted gel
forming mucins ... 24 SMM cell culture model: Proteomic pathway analysis of secreted proteins ... 24 Ps.a. cell culture model: Proteomic pathway analysis of secreted proteins ... 25 Proteomic comparison of secretions from SMM and Ps.a. CF cell
culture models ... 26 CF Cell culture models: Proteomic analysis of mucin interacting
proteins in secretions ... 26 Ps.a. CF cell culture model: Pathway analysis of differentially expressed
exosomal miRNA ... 27 Ps.a. CF cell culture model: In silico MUC5B activity prediction based
on differentially expressed exosomal miRNA ... 28 Antibody based MUC5B bacteria degradation timecourse ... 29 Light scattering determination of MUC5B concentration and
macromolecular structure during bacteria degradation timecourse ... 29 Antibody based MUC5AC bacteria degradation timecourse ... 31 Light scattering determination of MUC5AC concentration and
macromolecular structure during bacteria degradation timecourse ... 31 Bacterial incubation control: antibody and light scattering measurements
CHAPTER 1. PART B: COMPREHENSIVE CHARACTERIZATION OF MUCINS WITHIN THE CF AIRWAY: A COMPARATIVE ANALYSIS
BETWEEN NON-DISEASE AND CF SPUTUM ... 68
Introduction ... 68
Methods ... 70
Study Population ... 70
Total Mucin Concentrations ... 70
MUC5AC and MUC5B Concentrations ... 70
Proteomic Semi-tryptic peptide analysis ... 71
Purification of Gel-Forming Mucins ... 71
Characterization of the Gel-Forming Mucins... 72
Glycomics ... 72
Microbiome ... 72
Statistics ... 73
Reagents ... 73
Results ... 74
Demographics ... 74
Total mucin concentrations in CF vs. normal subjects ... 74
Absolute MUC5B and MUC5AC concentrations in CF vs. normal subjects ... 75
Macromolecular characterization of purified gel-forming mucins in CF vs. normal... 76
Quantity, coverage, and localization of MUC5B and MUC5AC Semi-tryptic peptides in mucins from CF sputum and control sputum ... 77
Sputum mucin concentrations and the CF sputum microbiome ... 78
Discussion ... 80
Chapter 1 Part B Figures ... 88
CHAPTER 2: COMPREHENSIVE CHARACTERIZATION OF MUCINS WITHIN THE TH2 ASTHMATIC AIRWAYS ... 105
Introduction: Asthma ... 105
Methods ... 109
Cell Culture ... 109
Asthma model: ... 109
Mucin Isolation and Static Light Scattering ... 110
Isolation and Analysis of Stored Gel Forming Mucins ... 111
Exosome Isolation: ... 111
Whole Mount Immunohistochemistry ... 112
Agarose Gel Electrophoresis ... 113
Mucin interactome isolation: ... 114
Mass Spectrometry ... 114
Rate Zonal Centrifugation ... 116
Results ... 117
Histological examination of IL-13 challenged and control cultures... 117
IL-13 induced asthma cell culture models: antibody based MUC5B and MUC5AC concentration quantitation ... 117
IL-13 induced asthma cell culture models: Absolute MUC5B and MUC5AC concentration quantitation ... 118
IL-13 induced asthma cell culture model: Proteomic pathway analysis
of secreted proteins from non-asthmatic and asthmatic cultures ... 120
IL-13 induced asthma cell culture model: Proteomic analysis of the mucin interactome from non-disease cultures ... 122
IL-13 induced asthma cell culture model: Pathway analysis of differentially expressed exosomal miRNA from non-asthmatic and asthmatic cultures ... 123
IL-13 induced asthma cell culture models: In silico MUC5B activity prediction based on differentially expressed exosomal miRNA from non asthmatic and asthmatic cultures ... 124
Discussion ... 125
CHAPTER 3: ISOLATION, PURIFICATION, AND CHARACTERIZATION OF FCGBP, A PUTATIVE MUCIN BINDING GLYCOPROTEIN ... 156
Introduction: FCGBP ... 156
Methods ... 159
Ex-vivo cell culture challenges: Asthma and Cystic Fibrosis ... 159
Human Sputum Samples: ... 160
Mass Spectrometry Sample Preparation and Analysis ... 160
Transfection: ... 160
FGCBP Purification: ... 161
Characterization: Light Scattering ... 162
Characterization: Atomic force microscopy ... 162
In-Gel Digestion………..163
Structural analysis ... 164
Interaction analysis ... 164
FCGBP BS3 Crosslinking ... 166
Immunohistochemistry of FCGBP and MUC5AC during IL-13
challenge of non-asthmatic cultures ... 167
Quantitation of FCGBP concentration in secretions of asthma and CF cell culture models and sputum using antibody and proteomic methodologies ... 167
FCGBP purification ... 168
FCGBP conformation and structure analysis by atomic force microscopy and light scattering ... 169
FCGBP BS3 crosslinking analysis ... 169
Proteomic analysis and localization of reduced FCGBP bands ... 170
FCGBP computational analysis ... 171
Semi tryptic peptide analysis of FCGBP GDPH cleavage sites ... 171
Molecular weight and glycosylation predictions of FCGBP domains based on GDPH cleavage sites ... 172
FCGBP layer properties and interactions with the MUC5B and MUC5AC standards ... 173
Discussion ... 174
Chapter 3 Figures ... 181
SUMMARY AND FUTURE DIRECTIONS ... 199
APPENDICES ... 203
Appendix 1. ... 203
Appendix 2. ... 206
Appendix 3 ... 235
LIST OF FIGURES
Figure 1.1. CF cell culture models exhibit mucus hypersecretion and
adhesion of mucus to surface. ... 46
Figure 1.2. Comparison of MUC5AC in apical secretions after 120-hour SMM challenge and the SMM itself. ... 47
Figure 1.3. Macromolecular characterization of secreted and stored mucins. ... 48
Figure 1.4. Ps.a. CF cell culture model: MUC5B Semitryptic peptide analysis. ... 49
Figure 1.5. Rate zonal conformation analysis of gel-forming mucins. ... 50
Figure 1.6. Label free proteomic analysis of apical secretions. ... 51
Figure 1.7. Shared significant differentially secreted proteins between the SMM and Ps.a. 120 hour cell culture challenge based on label free proteomic analysis. ... 52
Figure 1.8. Changes in non-gel forming mucins and mucin interactome proteins in CF cell culture models. ... 53
Figure 1.9. Changes in mucin interactome in CF cell culture models. ... 54
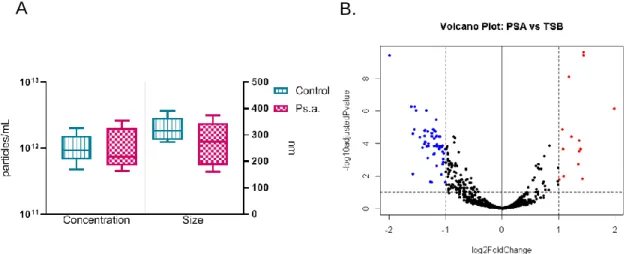
Figure 1.10. Changes in exosome concentration size and miRNA cargo after 120 hour Ps.a challenge. ... 56
Figure 1.11. Mucin type O-glycosylation genes targeted by significantly decreased exosomal miRNA after Ps.a. challenge. ... 59
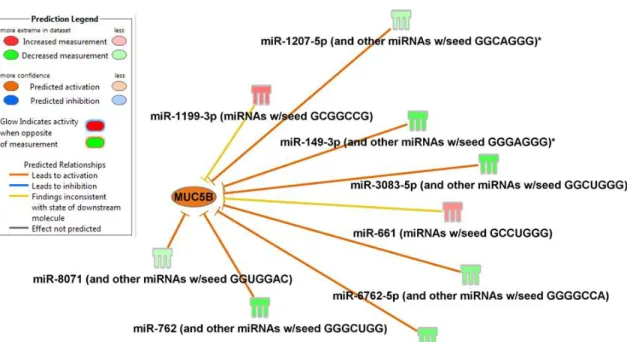
Figure 1.12. MUC5B gene predicted to be activated by differentially expressed miRNA after Ps.a. challenge. ... 61
Figure 1.13. miR-6762-5p concentration negatively and significantly correlates with MUC5B concentration. ... 62
Figure 1.14. Salivary MUC5B standard shows time dependent antibody loss after incubation with bacteria. ... 63
antibody loss after incubation with bacteria. ... 65 Figure 1.17. Biophysical characterization of MUC5AC after time course
incubation with bacteria after re-purification via isopycnic centrifugation
and analysis by SEC-MALS. ... 66 Figure 1.18. Gel forming mucin timepoint incubation with TSB. ... 67 Figure 1.19. Total mucin concentration increases significantly in CF... 89 Figure 1.20. Within CF cohort, total mucin concentration and the ratio of
MUC5AC to MUC5B varies with human neutrophil elastase activity
and age. ... 90 Figure 1.21. Absolute MUC5B and MUC5AC concentrations, and the
MUC5AC/MUC5B ratio are significantly elevated in CF ... 91 Figure 1.22. Macromolecular properties of the purified gel forming mucins
from sputum are not significantly different between healthy and CF. ... 92 Figure 1.23. MUC5B and MUC5AC from CF sputum have significantly higher
ratio of Semi-tryptic to full tryptic peptides. ... 93 Figure 1.24. MUC5B and MUC5AC from CF and normal sputa show distinct
signatures based on Semi-tryptic peptides and the mucin domains
they map to. ... 94 Figure 1.25. Specific domain localization of Semi-tryptic peptides differs
between CF and normal. ... 95 Figure 1.26. Relationship between microbiome and mucin concentrations. ... 96 Figure 1.27. Purified gel forming mucins from control and CF sputum have
significantly different glycan profiles. ... 97 Supplementary Figure 1.28. Total mucin concentration does not significantly
change with medication usage... 99 Supplementary Figure 1.29. Visual representations of the Semi-tryptic
peptide coverage of the gel-forming mucins reveal differences between
normal and CF sputa ... 100 Supplementary Figure 1.30. Relationship between microbiome and MUC5B
sequence analysis shows stratification based on oral flora or classic
pathogen classification. ... 102 Figure 1.32. Relationship between microbiome and mucin concentrations. ... 103 Figure 1.33. Significantly different non-sulfated glycans derived from gel
forming mucins purified from healthy and CF sputum. ... 104 Figure 2.1. Asthma cell culture models exhibit goblet cell hyperplasia and
increased storage of intracellular mucins. ... 134 Figure 2.2. Asthma cell culture models exhibit mucus hypersecretion
which is adherent to the apical surface. ... 135 Figure 2.3. Asthma cell culture models shows a disproportionate increase
in MUC5AC during 20 day challenge with IL-13 ... 136 Figure 2.4. Asthma cell culture models exhibit mucus hypersecretion
dominated by MUC5AC. ... 137 Figure 2.5. Macromolecular characterization of secreted gel-forming
mucins from non-disease and asthmatic HBE cultures after 20 day
challenge with IL-13. ... 138 Figure 2.6. Macromolecular characterization of stored gel forming mucins
isolated from asthma cell culture model. ... 139 Figure 2.7 Label free proteomic analysis of apical secretions based on
uniquely identified proteins and ingenuity pathway analysis of
significantly changing proteins following 20 day IL-13 challenge ... 140 Figure 2.8. Secretion pattern of non gel-forming mucins as measured by
label free LC-MS/MS in apical secretions during Il-13 challenge ... 141 Figure 2.9. Secretion pattern of increasing probable mucin interacting
proteins as measured by label free LC-MS/MS during lL-13 challenge ... 142 Figure 2.10. Secretion pattern of decreasing probable mucin interacting
proteins as measured by label free LC-MS/MS during Il-13 challenge ... 143 Figure 2.11. Changes in exosome concentration size and miRNA cargo
after IL-13 challenge ... 144 Figure 2.12. Mucin type O-glycosylation genes targeted by significantly
Figure 2.13. Differentially expressed miRNA at baseline after IL-13 treatment ... 150 Figure 2.14. MUC5B gene predicted to be down regulated by differentially
expressed miRNA after 20 day IL-13 treatment ... 152 Supplement Figure 2.15. Secretion pattern of probable mucin interacting
proteins as measured by label free LC-MS/MS during Il-13 challenge ... 153 Supplemental Figure 2.16. Secretion pattern of probable mucin interacting
proteins as measured by label free LC-MS/MS during IL-13 challenge ... 154 Supplemental Figure 2.17. Comparative analysis of canonical pathways
enriched by differentially expressed proteins ... 155 Figure 3.1. Secretion of FCGBP significantly increases in inflammation and
infection ... 181 Figure 3.2. Signficantly decreased miRNA predicted to increase FCGBP
expression. ... 182 Figure 3.3. FCGBP purification strategy and characterization ... 183 Figure 3.4. Unreduced SDS-Page of 293F clones’ cell lysates following
transfection, single cell selection, and expansion. ... 184 Figure 3.5. Macromolecular characterization of purified FCGBP. ... 185 Figure 3.6. BS3 identified cross-linked peptides from FCGBP with peptide
fragmentation chromatogram. ... 186 Figure 3.7.Band pattern of purified, unreduced, and reduced FCGBP and
localization of reduced bands based on Semi-tryptic LC-MS/MS analysis ... 187 Figure 3.8. Homology and repeated domain pattern of FCGBP ... 188 Figure 3.9 Diagram of FCGBP protein backbone and domain structure ... 189 Figure 3.10. Computational FCGBP structural prediction of 1 of the 12
repeated domains based on multiple sequence analysis. ... 190 Figure 3.11. Predicted molecular weight of FCGBP domains based on
GD/PH cleavage sites. ... 193 Figure 3.12. FCGBP layer properties based on viscoelastic broadfit model
Figure 3.13. FCGBP and mucin interactions as measured by quartz crystal
microbalance ... 196 Supplementary Figure3.14. Localization of FCGBP in CF lung tissue by
LIST OF TABLES
Chapter 1 Table 1 Shared differentially expressed proteins identified in apical secretions after 120 hours of SMM or Ps.a treatment ... 55 Chapter 1 Table 2. Top 20 significantly decreasing and increasing miRNA
isolated from apically secreted exosome like vesicles after 120 hour
challenge with Ps.a. or control ... 57 Chapter 1 Table 3. Significant KEGG pathways based on significantly
increasing miRNA isolated from apically secreted exosomes after 120
hour challenge with Ps.a. or control ... 58 Chapter 1 Table 4. Decreasing miRNA isolated from apically secreted
exosomes following 120hour treatment with Ps.a or TSB (control) predicted to affect mucin type O glycan biosynthesis based on
Diana miRpath analysis. ... 60 Chapter 1. Table 5. Study Cohort Characteristics for non-disease controls
and CF patient populations ... 88 Chapter 1 Table 6. Significant Spearman r correlations between specific
glycan core structures and microbiome composition ... 98 Chapter 2, Table 1. Top 20 significantly decreasing and increasing miRNA
isolated from apically secreted exosome like vesicles after 20 IL-13
challenge of non-disease HBE cultures ... 145 Chapter 2 Table 2. Significant KEGG pathways based on significantly
increasing miRNA isolated from apically secreted exosomes after 20
day IL-13 challenge or control of non disease cultures ... 146 Chapter 3 Table 3. Top significantly decreasing and increasing miRNA
isolated from apically secreted exosome like vesicles after 20 IL-13
challenge of asthmatic HBE cultures ... 147 Chapter 3 Table 4. Significant KEGG pathways based on significantly
increasing miRNA isolated from apically secreted exosomes after 20
day IL-13 challenge or control of asthmatic HBE cultures ... 148 Chapter 2 Table 5. Significantly different miRNA at baseline ... 151 Chapter 3 Table 1. Abundance of Semitryptic peptides at GDPH cleavage
Chapter 3 Table 2. Predicted O and N linked glycosylation sites based
on in silico prediction ... ……192 Chapter 3 Table 3. Predicted molecular weight (kDa) based on protein
backbone and various glycan core structures of full length FGCBP and specific domains representative of clusters A,B, & C domains
LIST OF ABBREVIATIONS AB-PAS Alcian Blue-Periodic Acid Schiff
AFM Atomic force microscopy ALI Air liquid interface ATP Adenosine triphosphate BAL: Bronchial alveolar lavage BSA Bovine serum albumin CF Cystic Fibrosis
CFTR Cystic fibrosis transmembrane regulator CREB cAMP response element-binding protein CsCl Cesium Chloride
Cys Cysteine
DMBT-1 Deleted in malignant brain tumor -1 DTT Dithiothreitol
EGFR Epidermal growth factor receptor ELISA Enzyme linked immunosorbent assay EMT Epithelial mesenchymal transition ENaC Epithelial sodium channel
ERK Extracellular-signal-regulated kinase FASP Filter aided sample preparation FBS Fetal bovine serum
FCGBP IgGFc-binding protein
Fra-2 Fos-related antigen 2
FXR-RXR Farnesoid X Receptor-Retinoid X Receptor GalNAc N-Acetylgalactosamine
GuHCl Guanidine Hydrochloride HBE Human bronchial epithelial HLA Human leukocyte antigen HNE Human neutrophil elastase IgE Immunoglobulin E
IGF-1 Insulin like growth factor 1 IgG Immunoglobulin G
IHC Immunohistochemistry IL-# Interleukin-#
IPA Ingenuity Pathway Analysis
IR Infrared
JAK Janus Activated Kinases
LC-MS/MS Liquid chromatography Tandem Mass Spectrometry LPLUNC Long palate, lung and nasal epithelial clone
LXR-RXR Liver X receptor-Retinoid X Receptor MAPK Mitogen activated protein kinase
MARCKS Myristoylated Alanine-Rich C Kinase Substrate MEM Minimum essential media
MSA Multiple sequence alignment MW Molecular weight
NF-κB Nuclear factor-kappa B
NRF-2 Nuclear factor erythroid 2–related factor 2 ORF Open reading frame
ORMDL Orosomucoid-like proteins OVA Ovalbumin
P2Y2 Purinoceptor 2
PARS Protease activated receptors PBS Phosphate buffered saline PCL Periciliary layer
PNS Post nuclear supernatant
Ps.a. Pseudomonas aeruginosa culture filtrate QCM-D Quartz crystal microbalance with dissipation RhoGDI Rho GDP-dissociation inhibitor
Rpm Revolutions per minute
RT Room temperature
SCC Saline-sodium citrate
SDS-PAGE Sodium dodecyl sulfate-polyacrylamide gel electrophoresis SDS sodium dodecyl sulfate
SEC-MALS Size exclusion chromatography-Multi angle light scattering Ser/Thr Serine/ Threonine
SNARE Soluble N-ethylmaleimide-sensitive factor attachment protein receptor Sp1 Transcription factor Sp1
SPLUNC Short palate, lung and nasal epithelial clone STAT6 Signal transducer and activator of transcription 6 TAE Tris acetate, ethylenedinitrilotetraacetic acid TBS Tris Buffered Saline
TGF-B Transforming growth factor beta TH2 T-helper cell type 2
TIL Trypsin Inhibitor like cysteine rich domain TNF-α Tumor necrosis factor alpha
TYK2 Tyrosine kinase 2
INTRODUCTION: MUCUS & MUCIN
Mucus is a viscoelastic gel that covers and protects the body’s non-keratinized epithelial surfaces. The components that make up mucus vary by location and function though regardless of the location, the general function of mucus is innate immune defense [1]. In the respiratory tract mucus is responsible for coating the epithelium, entrapping inhaled particles and pathogens, and
transporting them up and out of the airway maintaining a quasi-sterile lung environment. In the lung, the mucus layer is made up of two distinct layers; the pericilliary layer and the mobile mucus layer [2]. The pericilliary layer (PCL) is composed of mesh consisting of membrane tethered macromolecules including: MUC1, MUC4, and MUC16 which maintains the separation between the two layers and also helps control the hydration of the mucus layer [2-4]. The mobile mucus layer contains secreted ions, water, antimicrobial peptides and globular proteins, and the gel forming secreted mucins [5]. The two main gel-forming mucins in the lung are MUC5B, which is secreted from both the superficial epithelium and the
MUC5B and MUC5AC are large highly glycosylated polymeric proteins. Though the number of repeats is variable, each of the gel forming mucins contain internal mucin domains that are rich in serine threonine and proline and are the sites of o-linked glycosylation [10]. Interspersed in these regions are cysteine rich
domains. Both the N and C termini have cysteine rich regions, which share similarities to the von Willebrand factor (vWF) D and C domains. These terminal cysteines are critical for the polymerization of the mucin monomers through disulfide bond formation. This polymerization is initiated in the endoplasmic reticulum where the C termini dimerization occurs in addition to intramolecular disulfide bonds that promote proper folding of the domains [10, 11]. The mucin dimers are then
transported to the Golgi where they glycosylated and then multimerized through disulfide bonding at the N termini [12]. Numerous enzymes have been implicated in the glycosylation of mucins which starts with the addition of N-Acetylgalactosamine (GalNAc) and through the stepwise addition of sugars creates the different core structures that are can be further modified by addition of functional groups such as sialic acid and sulfate [13]. Mucins are extensively glycosylated and over 70%of their mass can be attributed to these carbohydrate decorations. The structural
The significant size of mucin multimers make the organization and packaging of these macromolecules into small secretory granules an impressive feat and one that is not completely understood though calcium charge shielding and the formation of non covalent calcium mediated crosslinking have been reported to be involved [14, 15]. After packaging into smaller granules it is proposed that these granules likely undergo lateral fusion to create larger granules, which can be stored until secreted.
After packaging there are several classes of proteins that are required for the exocytosis of the mucin granule. The first step of exocytosis requires moving the mucin granule from the Golgi to the plasma membrane. This is facilitated by a
trimeric protein complex made up of MARCKS (Myristoylated Alanine-Rich C Kinase Substrate), Heat Shock Protein 70 and Cysteine String Protein, which interact with the cytoskeleton [16, 17]. After reaching the plasma membrane the granule is loosely tethered by Rab GTPase protein present on the granule surface [18]. Tight docking to the plasma membrane and preparation for exocytosis occurs through interactions with the soluble N-ethylmaleimide-sensitive factor attachment protein receptor (SNARE) complex and Munc proteins, which both provide scaffolding and also interact with second messengers to stimulate exocytosis [18].
which it interacts. For example Munc13 is involved in both processes whereas Munc18b, Synaptotagmin 2, and VAMP8 are thought to only be involved with
stimulated secretion as their deficiency results in lack of secretions after exposure to traditional secretagogues [18-21]. Activation of the exocytotic machinery can occur through several pathways involving different G-coupled receptors such as
purinoceptor 2 (P2Y2) and protease activated receptors (PARS) that when bound ligand, ATP and serine protease such as neutrophil elastase, respectively, activate a signaling cascade involving phospholipase-Cβ, diacylglyceral and inositol
triphosphate [18, 22, 23]. The basal and stimulated secretion rates differ significantly with the stimulated rate occurring in two phases: a very rapid short 10second phase following by a slower (though still several fold higher than the basal rate) and longer plateau phase.
After exocytosis of the granules contents, there is an exchange of sodium and calcium ions leading to a rapid expansion of the mucin molecules as they undergo transition from a condensed state within the granule to a hydrated state forming the mucus gel [24]. Though mucins are the main component of mucus and important in determining the rheological properties of the mucus, they do not act alone [25-27]. Raynal et al showed that concentrated, purified MUC5B do not recapitulate the properties of mucus [28]. Additionally several publications have highlighted the role calcium and other globular proteins that interact with mucin play in changing the mucus properties [5, 29].
In addition to proteins and mucins, the apical secretions also contain
that carry protein, RNA, DNA, and lipid cargo reflecting to some degree the parental cell they derived from. Since first discovery in reticulocytes, exosomes have been identified in numerous other body fluids including plasma, saliva, bronchial alveolar lavage, urine and also in the secretions from human bronchial epithelial cell cultures [30-33]. They have been proposed to have utility as a therapeutic, prognostic and disease biomarker in a diverse set of diseases including cancer, neurodegenerative, immune and infectious [34-38]. Their role in intercellular communication was also recently shown in an airway cell culture model where exosomes were shown to be taken up by other cell types and change the protein and miRNA expression of the recipient cell including that of the gel forming mucins [39] demonstrating their important regulatory role on mucin secretion by the epithelium.
CHAPTER 1. PART A: COMPREHENSIVE CHARACTERIZATION OF MUCINS WITHIN THE CF AIRWAY USING IN-VITRO MODELS
Introduction: Cystic Fibrosis
Cystic fibrosis (CF) is a multi organ autosomal recessive genetic disorder that arises from mutations in the cystic fibrosis transmembrane regulator (CFTR) [42]. Though different areas of the body exhibit different symptoms due to this deficiency, most of the morbidity and mortality of CF is associated with respiratory complications and this is where my work will focus [43]. CFTR functions both in secretion of
bacterial infection is the host immune response, which includes heavy neutrophilic infiltration, dysregulated cytokine signaling, and also mucus hypersecretion, thus feeding into the ongoing cycle of dehydration, infection, inflammation, and mucus hypersecretion and eventually progressing to tissue destruction and fibrosis [1, 45, 48].
The development of mucostasis and bacterial infection presents in early childhood and persist into adulthood and until recently most of the focus was upon classical pathogenic strains such as Pseudomonas aeruginosa and Staphylococcus aureus [60, 61]. Application of 16S sequencing technologies to the lung microbiome has since revealed increased diversity including genera typically found in the oral cavity, which likely colonized the lung during infancy following aspiration, along with the pathogenic genera [62-64]. Also it has been shown that there is a progressive change in the CF microbiome that correlates with the age and disease severity [65, 66]. In early childhood (2 years) it was shown that mainly microbes belonging to the oral flora community colonized the lung and that several years later this shifted to a community dominated by classic CF pathogens which was accompanied by more severe inflammation and tissue damage [65].
There have been conflicting positions regarding the role and nature of mucins in the CF airways. Though numerous studies have shown at the transcript level that
ultra-centrifugation to isolate and purify these macromolecules based on their buoyant density [69, 70]. At the other end of the spectrum, there are others that have reported that the mucins within the CF airways are cross-linked and this is responsible for the rheological changes of CF mucus [71]. Thus the question remains, in the highly proteolytic environment how is the macromolecular structure of the gel forming mucins altered and with what other proteins do they interact to create a pathologic CF mucus.
Methods
Cell Culture
Primary human bronchial epithelial (HBE) cells passage 1 or 2 derived from non-cystic fibrosis and cystic fibrosis donors were grown at air liquid interface (ALI) and maintained according to previously established protocol [75]. Basal media was changed on alternating days and the apical surface washed with 37°C PBS 2-3 times each week. Challenges were performed on cultures once fully differentiated (21-28 days after confluence), which was verified by the presence of ciliation and mucus production. For the following experiments, treatments and controls were performed on cells derived from the same donor lung allowing for a paired statistical analysis.
CF cell culture models
To emulate the CF lung environment, two different reagents were used: culture filtrate from Pseudomonas aeruginosa (Ps.a.) or supernatant of
mucopurulent material (SMM), which were applied to the apical surface daily for 5 days. Ps.a. was prepared as previously described, 0.22μm filtered and diluted 1:5 in MEM [76]. SMM was isolated and prepared according to Ribiero et al and the resulting material pooled from 5 CF donors in order to generate sufficient volume for the challenges and reduce interpersonal variability [77]. For the large 30mm
were used for the Ps.a. or SMM challenges, respectively. The apical surface was washed with warmed PBS prior to the start of and each day during the challenge. The large inserts were washed with 1mL of PBS and the small cultures with 350uL. These washings were stored at 4°C after addition of 8M GuHCl to achieve a final concentration of 4M in order to prevent further degradation. Basal media was collected at baseline, before start of treatment, and each day thereafter for cytokine analysis.
Mucin Isolation and Static Light Scattering
Isopycnic density gradient centrifugation was performed to isolate the gel forming mucins using 4mL of pooled apical secretions in 4M GuHCl at a starting density of 1.45g/ml CsCl in 4M GuHCl spun at 50,000 rpm in a fixed angle rotor (70.1 TI) for 60-70 hours at 14°C [78]. A slot blot with vacuum filtration was performed on the resulting twelve 750μL fractions, which were then probed with polyclonal MUC5B antibody and monoclonal MUC16 (CA125) antibody to identify the peak with the highest concentration of MUC5B and minimal contamination by membrane bound mucins. These fractions were pooled and subjected to CL2B size exclusion chromatography (2 x 5mL) coupled with matrix assisted laser light
scattering (Dawn Heleos II, Wyatt Technology) and refractometry (Optilab T-rEx, Wyatt Technology) (SEC-MALS/dRi) at a flow rate of 0.5mL/min to determine concentration and macromolecular properties’ of the gel forming mucins, as
Isolation and Analysis of Stored Gel Forming Mucins
After completion of the 5-day challenge, one large 30mm insert from
treatment and control for each donor was used for post nuclear supernatant isolation (PNS). After sequential gentle washings with prewarmed PBS minimizing
mechanical stimulation, freshly prepared homogenization buffer (20mM HEPES, 130mM glutamic acid, 0.1mM CaCl, 3mM EGTA, 10nM N-Ethylmaleimide, Turbo DNase reaction buffer/DNAse (according to manufacturer’s instructions, ambion), and cOmplete mini protease inhibitor tablets (according to manufacturer’s
instructions, Roche), pH 7.2) was added to the apical surface of the cell cultures. Cells were removed/scraped from the insert and homogenized with 50 strokes of the dounce homogenizer while on ice. An equal volume of 8M GuHCl was added to the resulting homogenate and then centrifuged at 200g for 10 minutes at 4°C to pellet any remaining cell debris. The supernatant was removed and subjected to isopycnic density gradient centrifugation at a starting density of 1.45g/ml CsCl in 4M GuHCl for 60-70 hours at 50,000 rpm with a fixed angle rotor (70.1 TI) [78]. Eighteen 500μL fractions were taken per gradient and analyzed for MUC5B and MUC16 reactively following slot blot with vacuum transfer. The MUC5B rich fractions were further analyzed by SEC-MALs/dRi as described above.
Whole Mount Immunohistochemistry (IHC)
After completion of challenge, the apical surface was washed gently and thoroughly with 37°C PBS prior to fixation with Carnoy’s Solution (60% Ethanol, 30% Chloroform, and 10% glacial Acetic Acid) applied to both basal and apical
with 0.2% Triton X in Tris Buffered Saline (TBS) for 30 minutes at room temperature and then the cultures were blocked overnight at 4°C with a solution of 1% BSA, 1% Fish Gelatin, 0.1% Triton X and 5% normal donkey serum in 1 X TBS. Primary antibodies against MUC5B (1:500, polyclonal), MUC5AC (4ug/mL, 45M1), and x-tubulin (3ug/mL) were prepared in blocking buffer and applied to apical and basal surfaces overnight at 4°C. After washing cultures with blocking buffer diluted 1:10, secondary antibodies diluted (1:1000) were added to both culture surfaces and incubated overnight at 4°C protected from light. The following day, the cultures were washed and counterstained with Hoechst, according to manufacturer’s instructions. The membrane was excised from the plastic insert and mounted on a slide with the apical surface facing upward. This was allowed to dry overnight before sealing and imaging.
Agarose Gel Electrophoresis
rabbit and mouse primary antibodies were applied and the resulting signal measured using Licor Odyssey Scanner and quantified via densitometric analysis using the software provided by manufacturer (Version 3.0.30). For each challenge and code, the intensity values were normalized to the highest value prior to statistical analysis to measure the change in mucin secretion and account for donor-to-donor variability.
Mass Spectrometry
Equal volumes (450μL) of daily apical secretion for treatment and control in 4M GuHCl were prepared for Liquid Chromatography Tandem Mass Spectrometry using a modified filter aided sample preparation (FASP) method [83]. Specifically, each sample solubilized in 4M GuHCL was reduced with DTT using a final
concentration of 20 mM for 1 hour and 65°C and then alkylated with 50 mM iodoacetamide for 1 hour at 25 °C protected from the light. The samples were centrifuged at 14,000g for 10 minutes and the 10kDA filter washed twice with 4M GuHCl and then an additional three times using 50mM ammonium hydrogen carbonate (NH4HCO3). The filter was placed in a new collection tube and 0.5 ug modified proteomic grade trypsin (Sigma) added and the samples were incubated in a humidified chamber for 18 hours at 37°C. The peptides were centrifuged and eluted from filter and then concentrated using vacuum centrifugation (Heto-vac). The peptides were then dissolved in 30 uL of 0.1% formic acid analyzed by liquid
acetonitrile, while the column used for peptides separation is a Acclaim PepMap RSLC, 75 µm x 15 cm, nanoViper C18 2 µm 100 Å) coupled to a hybrid quadrupole orbitrap mass spectrometer with a Nano spray source (Q-Exactive, Thermo Fisher, Bremen, Germany).
Proteins were identified by searching against most current human database (Proteome Discoverer 1.4) and were quantified based on total precursor intensity using Scaffold, Version 4 (Proteome Software Inc). A paired students T-test was used to compare the treatment and controls from each donor.
For MUC5AC and MUC5B absolute quantification, an internal standard was prepared by spiking 3 heavy labeled internal peptide standards from each protein achieving a final concentration of 100 fmol /µl. All raw files obtained from tSIM-DIA analyses of sputum digest samples were processed by Skyline (version v1.4). For each peptide the ratio between the corresponding endogenous and internal standard peak areas of each precursor (MS) and top 3 most intensity product ions (MS/MS) was calculated. Ratios from the three peptides were averaged and MUC5B and MUC5AC concentrations were calculated with the following equation:
Protein concentration = [L/H × C × a/b * c/d]
Proteomic Semi-tryptic peptide analysis
The label free proteomic spectrum files were uploaded and searched against the human database using Scaffold (Version 4) allowing for Semi-tryptic and fully tryptic cleavage sites. The unique MUC5B and MUC5AC Semi-tryptic peptides from the apical secretions following 120 hour challenge with Ps.a or TSB (control) were identified and aligned to the full mucin protein backbone to generate a percent coverage and localize the Semi-tryptic peptides to specific UniProt annotated
regions of MUC5B (Q9HC84) or MUC5AC (P98088). The frequency of each type of non-tryptic cleavage site was also calculated for MUC5AC and MUC5B for each sample.
Rate Zonal Centrifugation
Exosome Isolation
Exosomes were isolated from equal volumes of apical secretions by
differential centrifugation. Briefly the raw secretions were spun down at 3000g x 20 minutes at 4°C using a swing out bucket rotor (SW40 Ti) after which the supernatant was kept and centrifuged at 10,000 rpm x 110 minutes at 14°C. The supernatant was removed and centrifuged for a third time at 19,000 rpm x 1.5 hours at 14°C. After this step, the supernatant was discarded and the remaining pellet was washed with 10 mL of PBS prior to the final centrifugation at 25,000 rpm x 60 minutes at 14°C. The supernatant was removed and the remaining pellet was resuspended in 100mL of PBS. The freshly isolated exosomes were diluted 1:500 - 1:1000 in 0.22uM filtered PBS and analyzed by nanoparticle tracking analysis as described previously [33]. Based on the resulting particle concentration measurements,
volumes from each sample containing an equal number of particles were submitted for miRNA sequencing using the HTG EdgeSeq platform, the details for which have been described previously [39].
MUC5B and MUC5AC Standard In-Vitro Experimental Design
MUC5B and MUC5AC standards derived from healthy donor salivary secretions and apical washings from an A549 MUC5B knockdown cell line, a gift from Dr. Babu Subramani (UNC) respectively; that were subjected to
two-dimensional isopycnic centrifugation using a starting density of 1.35g/ml were
dialyzed into PBS. Ps.a. or TSB were diluted 1:5 in MEM and 0.22um filtered before adding to standards in a 1:4 ratio of Ps.a/TSB to standard. Standards were
120 minutes, and 24 hours after addition of the Ps. a. or TSB. For each of these timepoints, the first aliquot was added directly to premeasured urea to achieve a final concentration of 6M in preparation for agarose gel electrophoresis western blot using both monoclonal and polyclonal antibodies against the gel forming mucins. The second aliquot was added to an equal volume of 8M GuHCl in order to repurifiy the gel forming mucins by isopycnic density-gradient centrifugation under
Results:
CF Cell Culture Models: Immunohistochemistry and MUC5B and MUC5AC concentration quantitation
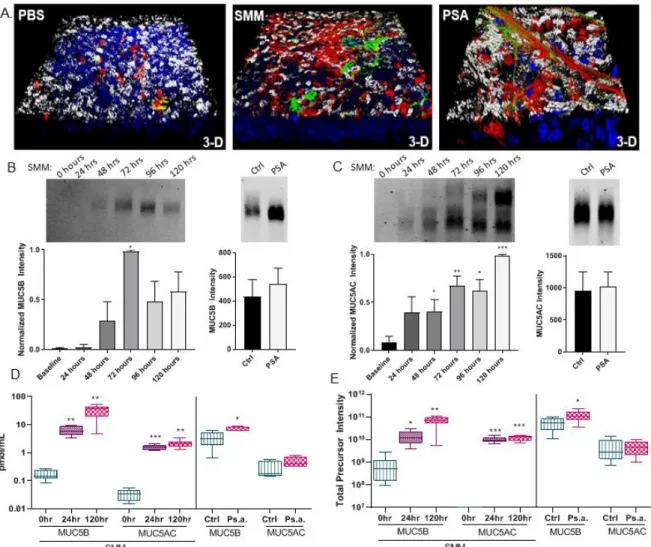
Cell cultures models of CF lung disease revealed significant hypersecretion of the gel forming mucins. MUC5AC and to a lesser extent MUC5B remained adherent to the apical surface after exposure to CF airway stimuli (Ps.a. and SMM) despite extensive washing as measured by whole mount immunohistochemistry (Figure 1.1A). Interestingly this increase in MUC5AC and MUC5B was not evident when the apical secretions of the Ps.a. treated cultures were analyzed by immunoblotting with antibodies against MUC5AC and MUC5B after agarose gel electrophoresis (Figure 1.1B and C, right panels) though MUC5AC and MUC5B did increase after the SMM challenge (Figure 1.1C, left panels).
In contrast to this, the proteomic analysis using absolute quantitative
methods (Figure1.1D) showed a significant increase in mean (±SE) MUC5B in both Ps.a. (7.481 ± 0.59 vs. 3.450 ± 0.92 pmol/mL) and SMM (32.70 ± 6.69 vs. 0.17 ± 0.03 pmol/mL) treated cultures as compared to their respective controls, TSB and PBS. This same trend was evident with label free LC-MS/MS analysis (Figure 1.1E) measuring the total precursor intensity (TPI) of MUC5B (±SE) for Ps.a (1.19x10¹¹ ± 3.17x10¹⁰ vs. 5.49x10¹⁰ ± 1.5x10¹⁰ TPI) and SMM (6.9x10¹⁰ ± 1.45x10¹⁰ vs.
8.01x10⁸ ± 4.04x10⁸ TPI).
TPI). In contrast, MUC5AC did significantly increase after SMM treatment by both absolute quantitation (2.11 ± 0.29 vs. 0.03 ± 0.006 pmol/mL) and label free
(1.21x10¹⁰ ± 1.28x10⁹ vs. 0 TPI, where 0 indicates below limit of detection). The ratio of MUC5AC to MUC5B decreased slightly but not significantly in both Ps.a. (0.06 ± 0.01 vs. 0.11 ± 0.03) and SMM (0.1 ± 0.04 vs. 0.16 ± 0.015).
SMM: MUC5AC and MUC5B concentration quantitation
Analysis of the 0.22um filtered SMM after diluting to the concentration present in the daily apical washings revealed a surprising amount of MUC5AC by both
agarose gel electrophoresis and absolute quantitative LC-MS/MS as compared to the apical secretions from the 24 and 120 hour SMM challenge timepoints (3.025 vs. 1.6 ± 0.13 vs. 2.11 ± 0.29 pmol/mL). Minimal staining by antibody was present for MUC5B in the SMM after agarose gel electrophoresis and absolute quantitation showed the MUC5B concentration in the SMM to be equivalent to the amount found in apical secretions at the 24 hour SMM treatment timepoint, but was far less than the apical secretion MUC5B concentration after 120 hours of treatment (6.01 vs. 6.23 ± 0.96 vs. 32.7 ± 6.9 pmol/mL). Lane analysis of the agarose gel MUC5AC staining pattern (Figure 1.2) indicated that the lower MUC5AC band, which was evident after 24 hours in the apical secretions, aligns with the MUC5AC positive band present in the SMM.
CF cell culture models: Macromolecular characterization of secreted and intracellular gel forming mucins
in concentration of the gel forming mucins, though this method does not discriminate between MUC5B and MUC5AC. After 120 hours of Ps.a. treatment the cultures exhibited a significant increase in mean (±SE) concentration of gel forming mucins in the apical secretions (47.38 ± 15.53 vs. 33.03 vs.11.38 ug/mL), as did the apical secretions from the SMM treated cultures (54.71 ± 4.90 vs. 12.08 ± 3.17 ug/mL) (Figure 1.3A). In regards to the mean (±SE) concentration of the intracellular, stored gel forming mucins, the Ps.a. treated cultures exhibited a significant increase (2.70 ± 0.40 vs. 1.42 ± 0.34 ug/mL) whereas though the intracellular gel forming mucins isolated from the SMM treated cultures also increased in concentration (3.34 ± 0.93 vs. 1.32 ± 0.21 ug/mL), it did not reach significance (p=0.07) due to high donor variability (Figure 1.3D).
In general the molecular weight of both the apically secreted and intracellular gel forming mucins in both treatments followed a decreasing trend with the exception of the apically secreted mucins after the Ps.a. challenge, which remained
209.1 ± 8.24nm) was unchanged (Figure 1.3C). This was a consistent finding for the SMM treated cultures for both the apically secreted (191.1 ± 3.85 vs. 180.1 ± 5.53 nm) and intracellular gel forming mucins (234.3 ± 11.89 vs. 216.5 ± 7.92 nm) (Figure 1.3F).
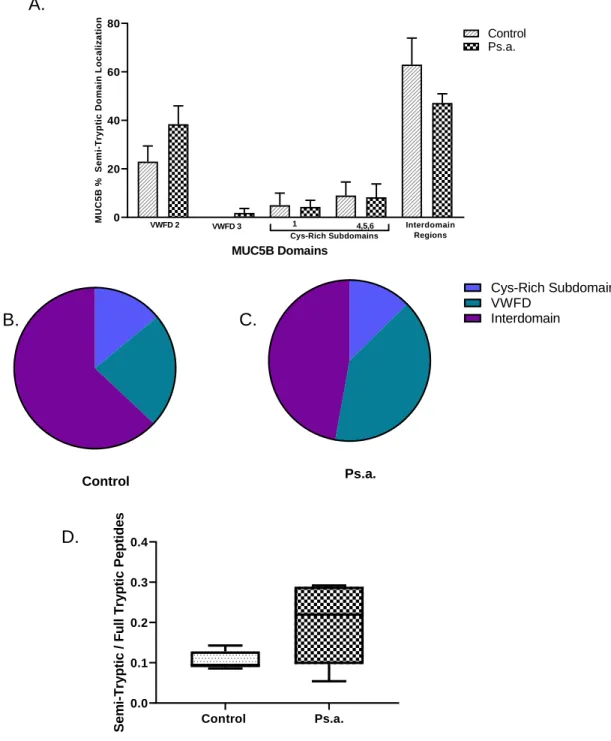
Ps.a. cell culture model: MUC5B Semi-tryptic peptide analysis
Analysis of the MUC5B Semi-tryptic peptides following 120-hour challenge with Ps.a. or TSB (control) revealed no significant differences in the number of unique Semi-tryptic peptides to full tryptic peptides or in the domains to which the Semi-tryptic peptides are localized along the MUC5B backbone. Semi-tryptic peptides provide insight into cleavage events, whether autocatalytic or bacterial mediated, that occur in the cell culture model prior to collection of the apical secretions and processing for LC-MS/MS analysis. Despite exposure to bacterial proteases, the MUC5B from apical secretions following 120 hour of Ps.a. exposure did not significantly differ from apically secreted MUC5B after 120 hour TSB
CF cell culture models: Conformation analysis of the secreted gel forming mucins
Conformational analysis of the apical secretions by rate zonal centrifugation revealed that the MUC5B peak shifted towards the lower fractions indicating a more compact conformation after SMM treatment (Figure 1.5A). This trend was not as prominent after the Ps.a. treatment, where the MUC5B peak spanned a broad range of fractions including both compact and linear conformations (Figure 1.5B). In both treatments, the MUC5AC peak appeared in a more bimodal distribution with an early sharp peak at fractions 2&3 and a later, broader peak at fractions 7-9 (Figure
1.5C&D).
SMM cell culture model: Proteomic pathway analysis of secreted proteins Analysis of the apical secretions by label free proteomics revealed hundreds of proteins that significantly changed after treatment with SMM and Ps.a. as
compared to their respective controls, PBS and TSB. Specifically after the SMM treatment, there were over 1600 proteins identified with 450 being differentially expressed/secreted. Among those 450 differentially expressed proteins, 295
proteins significantly decreased whereas 155 increased. Ingenuity Pathway Analysis (IPA) (Figure 1.6B) of the significantly changing proteins revealed the top canonical pathways (p value, direction) to be: Actin Cytoskeleton Signaling (1.34x10⁻²²,
downregulated), Acute Phase Response Signaling (1.84x10⁻²¹, upregulated) LXR-RXR Activation (9.57x10⁻²¹, upregulated), Integrin Signaling (1.95 x10⁻¹⁷,
functions (Figure 1.6C) the most significantly enriched categories were inflammatory response, cellular compromise, cellular movement, immune cell trafficking, and cell death and survival. Numerous proteins (481) were identified in the SMM that was applied to the apical surface when challenging the cells, and 380 of those proteins were shared between the SMM itself, the apical secretions after 24 hours of SMM treatment and the apical secretions after 120 hours of treatment (Figure 1.6D). Taking this overlap into account, when looking at the differences between Day1 and Day5 of SMM treatment as a measurement of initial vs. sustained cell response, there were numerous (140) significantly changing proteins. This number was narrowed down to 48 after excluding proteins also present in the SMM itself due to uncertainty regarding the source of these proteins (SMM itself vs. HBE in response to SMM). Interestingly among those 48 proteins, 45 decreased when comparing Day 5 to Day1 and only 3 Increased. These proteins were significantly enriched in
Organismal Injury and Abnormalities, Developmental Disorders, Dermatological Disease and conditions, Skeletal and Muscular Disorders, and Immunological Disease. A complete table of all unique and differentially expressed proteins when comparing SMM to PBS is provided in Appendix 2.
Ps.a. cell culture model: Proteomic pathway analysis of secreted proteins
Response Signaling (4.23 x10⁻⁶, upregulated), LXR/RXR Activation (6.06 x10⁻⁶, no prediction), RhoGDI Signaling (4.9 x10⁻⁵, no prediction), IGF-1 Signaling (6.47 x10⁻⁵, no prediction), and FXR/RXR Activation (1.08 x10⁻⁴, no prediction) (Figure 1.6F). In regards to the top disease and biological functions, Cellular Compromise,
Inflammatory Response, Cellular Movement, Dermatological Disease and
Conditions, and Organismal Injury and Abnormalities were enriched (Figure 1.6G). A complete table of all unique and differentially expressed proteins when comparing Ps.a. to TSB is provided in Appendix 1.
Proteomic comparison of secretions from SMM and Ps.a. CF cell culture models
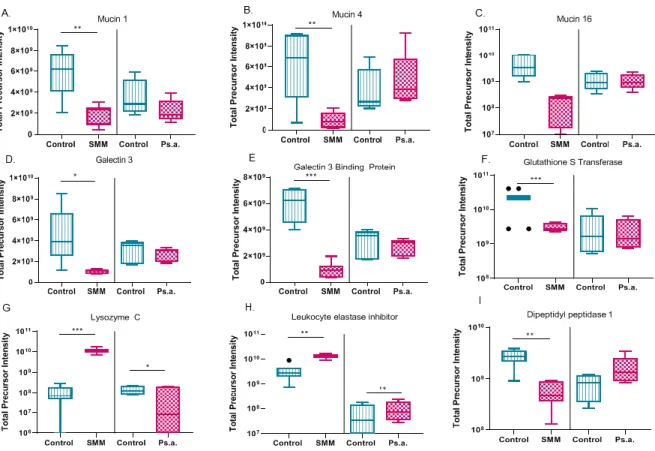
When comparing the significantly changing apically secreted proteins in both the SMM and Ps.a. cell culture challenges, only 14 proteins were shared between them (Figure 1.7A). Furthermore the direction of change was only similar for four of the identified proteins including MUC5B, Gelsolin, Secretoglobin family 3A member 1, and Vacuolar protein sorting associated protein 28 (Figure 1.7B-D and table 1). Among the numerous identified proteins based on label free proteomics, other mucins including MUC1 and MUC4 significantly decreased after SMM challenge but not after the Ps.a. challenge. MUC16 did not significantly change in either conditions (Figure 1.8A-C).
CF Cell culture models: Proteomic analysis of mucin interacting proteins in secretions
binding protein, and glutathione S transferase significantly decreased after SMM challenge (Figure 1.8D-F). Another category of proteins that increased in the apical secretions after both the SMM and Ps.a. challenges were those with immune modulatory effects. Several proteins within this group have been hypothesized to interact with mucin such as lysozyme C and Leukocyte elastase inhibitor, which both increased in the SMM and Ps.a challenges, and dipeptidyl peptidase 1 which
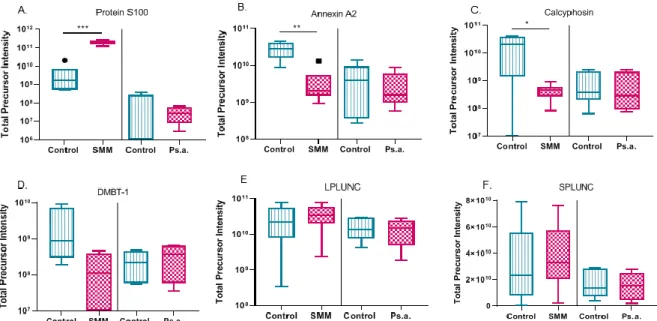
significantly decreased after SMM challenge (Figure 1.8G-I). Another category of mucin interacting proteins that have calcium-binding functions including: Protein S100, Annexin A2, and Calcyphosin, significantly changed after SMM challenge (Figure 1.9A-C). Though numerous apically secreted proteins significantly changed in these two CF cell culture model systems, several proteins including: DMBT-1, SPLUNC and LPLUNC, that have been implicated in CF or inflammation and predicted to associate with mucus, did not change (Figure 1.9D-F).
Ps.a. CF cell culture model: Pathway analysis of differentially expressed exosomal miRNA
exosomal miRNA that exhibited the greatest decrease and increase, as measured by log2Fold change, are listed in Table 2. In silico pathway analysis of the
significantly increasing and decreasing miRNA revealed numerous, diverse
pathways predicted to be affected. The top 20 most significantly changing pathways based on the differentially expressed miRNA are listed in Table 3. Interestingly Mucin type O-glycosylation (p value=0.007) (Figure 1.11) was among the pathways predicted to be affected by the decreasing miRNA and 40 of the miRNA (Table 4) identified in our analysis were predicted to target specific genes involved in the glycosylation of the mucin backbone including: polypeptide
N-acetylgalactosaminyltransferase 4, Alpha-N-acetylgalactosaminide alpha-2,6-sialyltransferase 1, CMP-N-acetylneuraminate-beta-galactosamide-alpha-2,3-sialyltransferase 1, Beta-1,3-galactosyl-O-glycosyl-glycoprotein beta-1,6-N-acetylglucosaminyltransferase, and Alpha-N-acetylgalactosaminide alpha-2,6-sialyltransferase 1.
Ps.a. CF cell culture model: In silico MUC5B activity prediction based on differentially expressed exosomal miRNA
In an attempt to identify miRNA that directly affect the muc5b gene expression, an IPA network analysis was performed highlighting the gel forming mucins and overlaying the miRNA expression data from the Ps.a cell culture
challenge. Though no miRNA were predicted to target MUC5AC, nine miRNA were identified from our dataset that were predicted to target MUC5B. Among those miRNA, two increased significantly in our experimental system and 7 significantly decreased (Figure 1.12). This culminated in an overall predicted activation of
correlated with the absolute MUC5B protein concentration measured in the apical secretions by LC-MS/MS. This revealed that miR 6767-5p was significantly
(p=0.022) negatively correlated (Pearson r=-0.71) with MUC5B protein concentrations, thus corroborating the IPA analysis findings (Figure 1.13).
Antibody based MUC5B bacteria degradation timecourse
MUC5B time-course incubation with three different bacteria genera known to be members of the CF lung microbiome, Pseudomonas aeruginosa (Ps.a),
Streptococcus sanguinis, and Prevotella melaninogenica showed loss of both polyclonal and monoclonal antibody reactivity by 24 hours (Figure 1.14).
Specifically, compared to the control at 0 minutes, there was a 100% and 98% loss of antibody signal for the polyclonal and monoclonal, respectively, after 24 hours of Ps.a. incubation. The intermediate timepoints of the Ps.a. incubation (10, 60, and 120 minutes) showed a moderate loss of monoclonal and polyclonal signal intensity, approximately 45%. Streptococcus and Prevotella were less pronounced in their effect at 24 hours but still showed a 58% and 61% loss in antibody reactivity for the polyclonal antibody and a 68% and 63% loss for the monoclonal antibody,
respectively.
Light scattering determination of MUC5B concentration and macromolecular structure during bacteria degradation timecourse
trend in the concentration measurements was found with both Streptococcus, which decreased by 29% after 24 hours incubation (20.28 ± 3.05 vs. 28.44 ± 1.4 ug/mL) and with Prevotella, which decreased by 35% after 24 hours (18.15 ± 4.5 vs. 27.86 ± 0.8 ug/mL). None of these decreases in concentration were significant (Figure
1.15A). The molecular weight (Figure 1.15B) did not significantly change at the 120-minute timepoint for Pseudomonas (1.79x10⁷ ± 5.75x10⁵ vs. 2.05x10⁷ ± 1.49x10⁶ g/mol), Streptococcus (1.81x10⁷ ± 1.17x10⁶ vs. 2.12x10⁷ ± 3.08x10⁶ g/mol), and
Prevotella (1.89x10⁷ ± 1.19x10⁹ vs. 1.96x10⁷ ± 1.18x10⁶ g/mol). The 24-hour
timepoint revealed a large increase in mean (±SE) molecular weight, which was also accompanied by high variation among the repeats for each bacteria genera tested. Specifically at 24 hours, MUC5B incubated with Pseudomonas increased in mean molecular weight by 2.7 fold, measuring 5.59x10⁷ ± 3.7x10⁷ g/mol, MUC5B
incubated with Streptococcus increased 1.4 fold, measuring 3.05x10⁷ ± 9.17x10⁶ g/mol, and MUC5B incubated with Prevotella increased by 7.3 fold, measuring 1.43x10⁸ ± 1.09x10⁸ g/mol (Figure 1.15B). The trends seen in molecular weight were reflected in the measurement of the mean (±SE) radius of gyration (Figure 1.15C). Though slightly reduced, the radius of gyration after 120 minutes incubation did not significantly change for Pseudomonas (180.6 ± 5.57 vs. 193.7 ± 4.7 nm),
The 24-hour timepoint after Streptococcus incubation was unchanged (189.7 ± 19.23 nm) as compared to the control at 0 minutes.
Antibody based MUC5AC bacteria degradation timecourse
When looking at the polyclonal and monoclonal antibody intensity of
MUC5AC after 0, 10, 60,120 minutes and 24-hour incubation with Pseudomonas,
Streptococcus, and Prevotella, there was a significant decrease in antibody signal intensity by 24 hours (Figure1.16). Specifically after the 24-hour incubation with
Pseudomonas, there was a 60% and 78% loss of polyclonal and monoclonal antibody signal, respectively, as compared to the 0 minute control. After 24-hour incubation with Streptococcus, there was a 53% and 65% loss of polyclonal and monoclonal antibody reactivity, respectively. The 24-hour Prevotella incubation revealed the most dramatic polyclonal and monoclonal antibody signal loss of 94% and 98%, respectively. Also the Prevotella incubation displayed a stepwise pattern of antibody reactivity loss throughout the timecourse as evidenced by the
progressive 32%, 47%, and 81% loss of polyclonal antibody reactivity and a similar 45%, 66%, and 78% loss of monoclonal antibody reactivity at the 10, 60, and 120-minute incubation timepoints, respectively.
Light scattering determination of MUC5AC concentration and macromolecular structure during bacteria degradation timecourse
after 24-hour incubation with Streptococcus (1.94 ± 0.65 vs. 4.5 ± 0.62 ug/mL) and
Prevotella (0.15 ± 0.07 vs. 4.615 ± 0.14 ug/mL) as compared to the 0-minute timepoint control. Also throughout the Prevotella incubation, the mean MUC5AC concentration decreased in a stepwise manner at the 10, 60 and 120-minute timepoints (3.42 ± 0.52 vs. 1.21 ± 0.37 vs. 0.75 ± 0.25 ug/mL) mirroring the pattern of antibody reactivity loss (Figure 1.17A, right panel). The mean (±SE) molecular weight decreased in the Pseudomonas (1.85x10⁷ ± 3.15x10⁶ vs. 3.09x10⁷ ± 5.52x10⁶ g/mol) and Streptococcus (1.78x10⁷ ± 7.55x10⁵ vs. 2.12x10⁷ ± 4.24x10⁶ g/mol) timecourse incubations until 120 hours (Figure 1.17B). Similar to the MUC5B incubation, at the 24-hour timepoint, the molecular weight of MUC5AC after the
Pseudomonas incubation increased 4.33 fold, measuring 1.34x10⁸ ± 1.15x10⁸ g/mol and after the Streptococcus incubation increased 1.4 fold, measuring 2.9x10⁷ ± 1.28x10⁶ g/mol (Figure 1.17B). In regards to the Prevotella incubation, the mean molecular weight of MUC5AC remained relatively unchanged at the 10 and 60 minute timepoints but then increased 1.9 and 5.3 fold at the 120 minute and 24 hour timepoints, respectively (Figure 1.17B). The mean (±SE) radius of gyration was more variable across the different bacterial genera analyzed (Figure 1.17C). The
Pseudomonas incubation showed a progressive decrease until the 120 minute timepoint (182 ± 12.53 vs. 194.8 ± 8.6 nm) which was followed by an increase to 220.7 ± 66.58 nm at 24-hours as compared to the 0-minute control. A similar pattern was seen in the radius of MUC5AC during the Prevotella timecourse incubation,
was still smaller than the starting radius at 0 minutes. The Streptococcus incubation showed a progressive decrease in the MUC5AC radius of gyration (178.8 ± 23.15 vs. 199.9 ±11.38 nm), though this did not reach statistical significance due to the high variability between repeats (Figure 1.17C).
Bacterial incubation control: antibody and light scattering measurements of MUC5B and MUC5AC
As a control for this study, TSB was incubated with the same MUC5B and MUCAC standards in the same manner as the bacteria culture filtrates. There was neither a loss of antibody signal intensity nor a significant change in the
Discussion:
Mucostasis with chronic infection and inflammation are hallmarks CF lung disease. While it is accepted that mucus hypersecretion and hyperconcentration occurs, the specific contribution of the individual gel forming mucins, their
macromolecular conformation and structure in this highly proteolytic environment, and the disease specific differentially expressed proteins they interact with are not known. Bacterial infection and the resulting host immune response is a critical driver in CF pathogenesis. Recent technological advances have elucidated the complex nature of the CF microbiome which encompasses numerous different genera including those traditionally considered pathogenic and those belonging to the oral flora community including anaerobes. Still the relationship and interactions between these microbes and the mucin rich environment they inhabit is not well understood. We address these questions using apical secretions collected from two well-established in vitro models of CF. One model focuses more narrowly on the effect of
Pseudomonas aeruginosa while the other offers a more complete view by using SMM which bacterial products in addition to host immune cell products and a broad range of cytokines as well [86]. The apical secretions collected during these
Pseudomonas aeruginosa,Streptococcus sanguinis, and Prevotella melaninogenica.
Historically, there has been a debate in the field regarding the contribution of mucins to mucostasis with some reports stating that mucin concentrations in the CF airways are reduced as compared to normal [67, 68]. These studies primarily relied upon antibody based methods and Henderson et al showed that these methods, which are sensitive to epitope loss, do not accurately depict what is occurring in the CF airway and instead demonstrated the utility of biophysical methods in quantifying mucin [40]. In this study both methodologies were used and compared. We showed using light scattering, label free and isotope labeled mass spectrometry that the concentration of the gel forming mucins increases in two CF cell culture models whereas by agarose gel western blot they did not. This discrepancy in concentration measurements based on antibody dependent and independent methodologies supports the previous findings of Henderson et al, refutes the idea that mucins are reduced in CF, and also questions the validity of using antibody based methods in such a highly proteolytic environment.
Though MUC5B increased significantly in both systems, MUC5AC only increased in the SMM model. By using absolute measurement of MUC5AC, it
which revealed that the lower MUC5AC positive band that was present after 24 hours of SMM treatment aligned with the MUC5AC band from the SMM itself. In contrast, there was no detectable MUC5B signal in the SMM. Thus care should be taken when using the SMM model to account for the presence of mucin and other proteins that are derived from the SMM itself. Taking this into account, MUC5B was the dominant gel forming mucin found in the apical secretions from the epithelial cells after challenging with Ps.a. and SMM, but whole mount immunohistochemistry revealed that there was significant MUC5AC staining on the apical surface of the cells that was adherent and not able to be removed by the thorough PBS washings. This suggests there is a difference in the adherence of the two gel forming mucins which has been suggested in other disease systems [87]. The abundance of MUC5AC adherent to the cell surface, yet not in the apical secretions after Ps.a. challenge, combined with its presence in the SMM, which is derived from CF
airways, raises the question of how and why MUC5AC is present at such high levels in the SMM. One hypothesis reflects the different clearance modalities that are present in the cell culture system and within the lung. The cell culture model primarily relies upon cilia beating to move mucus on the apical surface whereas in the lung both cilia beating and cough clearance occur. Thus perhaps MUC5AC is best cleared through cough clearance explaining its presence in the SMM and absence in the apical secretions following Ps.a. challenge. Also the Ps.a. model is an isolated system and lacks the ongoing inflammatory and immune response that is present in vivo. Therefore we propose that the MUC5B increase may be the
subsequent immune response that stimulates the MUC5AC hypersecretion to reach the level where it is also abundant within the secretions. A possible candidate for this is neutrophil elastase, which is highly prevalent within the CF airways as well as in SMM, and has been shown to induce MUC5AC expression [55, 86, 88].
The fate of the gel forming mucins following secretion is still unknown. Some have suggested that they are degraded in this highly proteolytic environment and others that they are cross-linked together as a result of reactive oxygen species [67, 68, 71]. In order to answer this questions, gel forming mucins were purified from the apical secretions through isopycnic density gradient centrifugation and the
concentration, molecular weight, and radius were measured by SEC-MALS. Corresponding to the proteomic data, the concentration of apically secreted high molecular weight gel forming mucins did increase significantly in both the SMM and Ps.a. models. Though the radius was unchanged in both treatments, the molecular weight decreased after the SMM challenge, yet remained constant after the Ps.a. challenge. While this discrepancy in the direction of molecular weight change could be due to other proteases in the SMM, such as elastase, it is important to note that the resulting decreased MW after SMM challenge was within the normal range for intact gel forming mucins. Interestingly, in both models, the intracellular/stored gel forming mucins did show a significant and consistent decrease in molecular weight after challenge, in addition to a significant increase in concentration and minimal change in radius. As the intracellular gel forming mucins are isolated from the
The conformational analysis of the apically secreted gel forming mucins by rate zonal centrifugation indicated that after SMM treatment the MUC5B had a more compact structure. This shift in conformation is similar to the published change seen in basally accumulated MUC5B from primary CF cell cultures [89]. After Ps.a.
treatment, the MUC5B exhibited a more broad distribution extending to both linear and compact areas in the gradient. The MUC5AC tended to exhibit a shift toward the earlier more linear fractions in both treatments.
To assess the global response of the epithelial cells to the CF environment, pathway analysis of all the differentially secreted proteins following SMM or Ps.a. challenge was performed. Analysis of the apical secretions following SMM
showed similar results for the different CF culture models. Interesting the acute phase response pathway was increased in both of the challenges. This pathway refers to an organism’s systemic innate immune response to different stimuli including infection and inflammation and functions to promote healing and re-establish homeostasis [90]. Interestingly these are typically blood-associated proteins such as C-reactive protein and previous publications have shown that this protein is elevated in CF serum and correlates with disease severity [91-93].
Additionally several of the signaling pathways (NK-κB, TNF-α, IL6-, IL-1, and IL-8) that generate the acute phase response pathway have been shown to be increased and important in CF pathogenesis and present within the SMM [48, 86, 94, 95]. This finding supports that these culture models do in fact replicate to some extent the CF lung environment heavy with infection and inflammation. Another pathway present in both CF cell culture models was the LXR and FXR/RXR pathways which are involved in fatty acid and cholesterol metabolism but also have been implicated in resolution of inflammatory response [96]. The actin cytoskeleton remodeling was the most significantly enriched canonical pathway in the SMM CF cell culture model. Actin remodeling is an important step in the exocytosis of mucin granules and the enrichment of this pathway suggests that it is likely connected to the mucin