The changing landscape of accrual accounting
Robert M. Bushman
University of North Carolina at Chapel Hill [email protected]
Alina Lerman Yale University [email protected]
X. Frank Zhang Yale University [email protected]
July 2015
The changing landscape of accrual accounting
ABSTRACT
A fundamental property of accrual accounting is to smooth temporary timing fluctuations in operating cash flows, indicating an inherent negative correlation between accruals and cash flows. We show that the overall correlation between accruals and cash flows has dramatically declined in magnitude over the past half century and has largely disappeared in more recent years. The adjusted R2 from regressing (changes in) accruals on (changes in) cash flows drops from about 70% (90%) in the 1960s to near zero (under 20%) in more recent years. In exploring potential reasons for the observed attenuation, we find that increases in non-timing-related accrual recognition, as proxied by one-time and non-operating items and the frequency of loss firm-years, explain the majority of the overall decline. On the other hand, temporal changes in the matching between revenues and expenses, and the growth of intangible-intensive industries play only a limited role in explaining the observed attenuation. Lastly, the relative decline of the timing role of accruals does not appear to be associated with an increase in the asymmetrically timely loss recognition role.
Keywords: accrual accounting, accruals, cash flows, earnings management, accrual quality
1. Introduction
A central role of accrual accounting is to smooth out temporary fluctuations in cash flows
(e.g., Dechow 1994; Dechow et al. 1998), as accrual accounting systems recognize economic
events in firms’ financial statements independently of the timing of cash flows associated with
these events. We refer to this role as the timing role (or the smoothing or noise reduction role) of
accruals. By adding accruals to operating cash flows, accrual accounting systems produce an
earnings number that should be a less noisy measure of operating performance than operating
cash flows. As Dechow (1994) points out, a central implication of the timing role of accrual
accounting is that contemporaneous accruals and cash flows are negatively correlated. This
negative correlation is often taken as given in the literature and serves as the cornerstone of a
variety of earnings/accrual quality models (e.g., Dechow and Dichev 2002). In this paper, we
show that the correlation between accruals and cash flows has dramatically diminished in
magnitude over the past half century and has largely disappeared in more recent years.
We adopt two models to examine the overall correlation between accruals and cash
flows. The first one is based on Dechow (1994) and regresses total accruals on contemporaneous
operating cash flows. We run the model both in levels and in changes specifications for each
year from 1964 through 2014 and examine the temporal change in the goodness of fit measure
and in the coefficient on contemporaneous cash flows. We find that the adjusted R2 drops from
about 70% (90%) in the 1960s to near zero (under 20%) in more recent years for the levels
(changes) specification. At the same time, the negative coefficient on contemporaneous cash
flows experiences a drastic increase over the years. Under the levels (changes) specification, an
increase of $1 in operating cash flows was associated with a decrease of approximately 70 cents
cents) in the last ten years. The results suggest that the overall correlation between accruals and
cash flows has significantly diminished over the past fifty years in a persistent and smooth
manner.
The second model we use is the Dechow and Dichev (2002) regression of total accruals
on past, current, and future operating cash flows. Again, we find a dramatic decline in the
adjusted R2 of the model and a smooth increase in the coefficient on contemporaneous cash
flows over the fifty-year period. The adjusted R2 has dropped from about 70% in the 1960s to
below 10% in the latest years, whereas the coefficient on contemporaneous cash flows has
increased from about -0.8 to -0.4 over the same time period. In contrast, the coefficients on past
and future cash flows show only a small positive change in magnitude over time. While we use
the balance sheet approach to estimate total accruals for the early years of the sample and the
statement of cash flows approach from 1988 forward, we observe a similar pattern of decline
when carrying out our analysis with the balance sheet approach on the full sample for
consistency.
Having documented the pronounced and continuous decline in the overall correlation
between accruals and cash flows, we explore potential reasons for this attenuation. A number of
economic and accounting developments could be associated with this decline. For example, if
cash flows and economic earnings have become more volatile, reflecting increasing economic
shocks to firms’ operations, then accruals are likely to have a weaker correlation with cash flows
in the later years. A temporal increase in the frequency of reported recurring and
non-operating items and net losses may also contribute to the attenuation of the negative correlation
both because these items are not often accompanied by large positive cash flows and because the
estimation error. The growing prominence of firms with high intangible intensity could lead to
an increase in transactions which do not generate accruals due to immediate expensing of cash
outflows. Accruals may also increasingly reflect the timely loss recognition role, which suggests
a positive correlation between accruals and cash flows and thus attenuate the overall negative
correlation. From the accounting standards perspective, the FASB’s expansion of the balance
sheet-based model of financial reporting, in such manifestations as the push toward fair value
accounting, may have made accruals less correlated with cash flows overall (without necessarily
increasing the amount of estimation errors in the accrual generating process). Overall, even
though the conceptual timing role of accrual accounting has not been changed, a significant
increase in the magnitude of other elements of accruals (e.g., economic-based cash flow shocks,
accrual estimation errors, fair value adjustments, one-time and non-operating items, timely loss
recognition, losses and earnings management) may lead to a decline in the extent of the observed
negative correlation between accruals and operating cash flows.1
We find that increases in one-time and non-operating items and in firms reporting losses,
all of which are proxies for non-timing-related accrual recognition, are positively associated with
the attenuation in the timing role of accrual accounting. Collectively, they explain about 63% of
the decline in the overall correlation between accruals and cash flows. On the other hand, the
changes in economic-based cash flow shocks, the temporal changes in the matching between
revenues and expenses (Dichev and Tang 2008), the emergence of intangible-intensive firms
(Srivastava 2014), and in the asymmetrically timely recognition of gains and losses (Ball and
Shivakumar 2006) play only a limited role. Overall, it appears that the decline in the relative
prominence of the timing role is an artifact of changing operating uncertainty and accounting
1 There may be other reasons, not addressed in this paper, why accruals are increasingly representative of estimation
practices that have increased the presence of non-timing-related accruals and the frequency of
loss years.
We perform a battery of additional tests to extend the main results. First, we examine the
relationship between accruals and cash flows using firm-specific time-series regressions and
observe that the results corroborate those from cross-sectional regressions. Next, we follow
Srivastava (2014) and examine separately five successive listing cohorts. We document the
temporal attenuation in the accrual-cash flow relationship for all cohorts. To further explore the
potential effects of the change in the sample composition over time we repeat our analyses on a
sample of the largest 1,000 firms in each year and on relatively constant samples of firms with at
least 30 (40) years of data. We also consider a broad definition of accruals in Richardson et al.
(2005) and find the tenor of the paper unchanged. Next, we expand the smoothing window to
non-adjacent fiscal periods to consider the possibility that accruals map to cash flows up to three
periods preceding and following the current period. Finally, we consider whether changes in
operating cash cycles, changes in absolute total accruals, or industry effects contribute to the
observed attenuation. Overall, we find that our results are robust to these alternative samples and
specifications.
Our evidence that the overall correlation between accruals and cash flows has
significantly declined over the years has broad implications for academics, practitioners, and
regulators. Given that the accounting rules governing the basic recognition of revenues and
expenses have, in large part, remained unchanged, fundamentally the basic role of accruals is
still smoothing out the temporary fluctuations in cash flows. However, both economic and
reporting developments have led to the dramatic decline in the relative prominence of this timing
obscured the expected negative accrual-cash flow relation. Accounting educators and
practitioners should be interested in the magnitude of the decline and the explanatory factors for
it which may help identify firms or periods where it is particularly likely to be observed. Despite
the unchanged conceptual timing role of accruals, it is important to note that empirically today’s
accruals contribute little towards reducing earnings volatility relative to cash flow volatility.
Practitioners and academics may want to revisit the notion that a negative relationship between
accruals and cash flows is a necessary characteristic of high-quality earnings (e.g., Dechow and
Dichev 2002; Dichev et al. 2013). Finally, existing research has documented that many accrual
related regularities, such as value relevance of earnings and the accrual anomaly, have declined
over time (Collins et al. 1997; Green et al. 2011). It is possible that our documented attenuation
in the accrual cash flow relation and the factors contributing to that attenuation may be able to
explain, in full or in part, these observed phenomena.
On a more pragmatic note, the Dechow and Dichev (2002) measure of accrual mapping
into cash flows and its various modifications are ubiquitous in the accounting research literature.
The characteristics of their empirical results, such as the reported adjusted R2 of 47% from the
firm level analysis, are widely discussed and at times used as points of reference for similar
models (Dechow et al. 2010). Empirical accounting studies, which either examine accrual
accounting or utilize measures of accrual quality, typically pool historical data over the full
sample, by industry, or by firm, in examining their research questions. The decline in the
inherent relationship between contemporaneous accruals and operating cash flows suggests that
researchers should be aware of the possible inter-temporal changes in this measure and, at a
minimum, should evaluate the consistency of their findings over time. 2 For example, we
2 The documented attenuation in the accrual-cash flow relation is particularly relevant for studies which utilize the
document that the magnitude and standard deviation of residual accruals calculated from either
the firm-specific or the pooled specifications of the Dechow (1994) or the Dechow and Dichev
(2002) models are systematically underestimated in the more recent years. Another implication
of our findings that popular accrual models lack explanatory power in recent years calls the
meaning of the estimation of residual accruals into question. If cash flows explain little of the
variation in accruals, then the residual is basically accruals and the variance of residual accruals
is equivalent to the variance of accruals, which does not seem to be a useful way to assess
accounting quality.3
Our findings may also be important for studies that examine the relative change in the
Dechow and Dichev or other smoothing metrics of accruals across various time periods (e.g.,
Singer and You 2011; Doyle and Magilke 2013). Although these papers are carefully constructed
to rely on difference in difference techniques over samples matched on characteristics such as
industry affiliation and size, we suggest that the explanatory factors that contribute to the
attenuation of the timing relationship, such as non-recurring and non-operating items, should also
be controlled for. Measures of accruals quality rooted in the negative correlation between
accruals and cash flows are also increasingly applied in the examination of non-US samples
(Barth et al. 2012). Our findings suggest that researchers comparing US and foreign regimes
should consider whether other countries have experienced a similar decline in the accrual-cash
flow relation and, if so, whether it stemmed from the same economic and reporting factors.
We organize the rest of the paper as follows. Section 2 reviews relevant literature.
Sections 3 describe our sample. Section 4 presents the main empirical results and explores
sample 1994-2004; McNichols and Stubben 2014 for the sample 1990-2010; Hribar et al. 2013 for the sample 2000 to 2010).
potential explanations. Section 5 discusses robustness tests and implications, and Section 6
concludes.
2. Prior Research and Background
Accrual accounting recognizes economic events in firms’ financial statements
independently of the timing of cash flows associated with these events.4 The contrast between
cash-based accounting and accrual-based accounting is highlighted in Financial Accounting
Standards Board [FASB] Concept 1:
“[Accrual accounting] recognizes that the buying, producing, selling, and other operations of an enterprise during a period, as well as other events that affect enterprise performance, often do not coincide with the cash receipts and payments of the period.” (paragraph 44)
A central role of accrual accounting, which we refer to as the timing role, is to smooth out
temporary timing fluctuations in operating cash flows. For example, consider a firm in a steady
state with constant scale of operations over time. An increase in accounts receivable due to a
customer unexpectedly delaying payments would simultaneously reduce cash flows (as
compared to a case of prompt payment) and increase accruals by the same amount. Similarly, a
temporary increase in inventory is associated with growth in the working capital account
“inventory” and a contemporaneous reduction in operating cash flows. Accrual accounting
prevents such transitory fluctuations from affecting the reported earnings of the firm via accruals
with similar magnitude but opposite signs to cash flows. As Dechow (1994) points out, the
central prediction of the timing role of accrual accounting is that accruals and cash flows from
operations are negatively correlated. This smoothing property of the reporting system can be
4 We use the term “independently” to highlight the standard definition of accrual accounting as a practice of
viewed as a channel by which accruals increase the informativeness of reported earnings.
Accrual accounting systems produce an earnings number that is less noisy than operating cash
flows as accruals mitigate the noise that arises from exogenous or manipulative variation in
working capital items. Accruals record real economic transactions in a timely fashion, thus
distinguishing our system of accounting from the mere counting of cash.
The negative contemporaneous association between operating cash flows and total
accruals is observed going back to some of the early studies on accrual accounting (Rayburn,
1986; McNichols and Wilson, 1988). Rayburn (1986) records firm-specific Pearson correlation
of -0.81 between the levels of cash flows from operations and total accruals in the 1962-1982
period. McNichols and Wilson (1988) observe Spearman correlation of -0.69 (-0.78) between the
levels (changes) of the two variables in the 1967-1985 period. Later research continues to
explore the association in a more systematic fashion. Dechow (1994), Sloan (1996), and Dechow
et al. (1998) all predict, document, and exploit a negative contemporaneous correlation between
levels or changes of aggregate accruals and operating cash flows. Dechow (1994), in particular,
specifically posits that the negative association is inherent in the system where accruals are used
to smooth the noisy cash flow metrics. This relation stems from the temporary nature of cash
flow fluctuations and is smaller when measured over longer intervals. Dechow and Dichev
(2002) expand on this role of accruals and introduce a measure, which they term accrual quality,
capturing the mapping of current accruals into last period, current period, and next period cash
flows. In line with the timing role of accrual accounting, their analysis indicates that the
association between working capital accruals and contemporaneous operating cash flows is
strongly negative while that between accruals and past/future cash flows is positive (albeit of a
(2002) mapping measure to explore questions pertaining to accruals characteristics (i.e. Francis
et al., 2004, 2005; Dechow et al., 2010).5
In summary, the negative association between contemporaneous accruals and cash flows
is well established in the literature. However, there is some sporadic evidence in studies using a
more recent sample period suggesting that the association between accruals and cash flows has
become less pronounced in recent years. For example, Barone and Magilke (2009) find a Pearson
(Spearman) correlation of -0.04 (-0.33) between levels of operating cash flows and total accruals
on the pooled 1988-2004 time period. Givoly and Hayn (2000) find that the covariance between
accruals and cash flows increased from about -0.01 in the 1960s-1980s to -0.005 in the 1990s. In
this paper, we examine whether the negative association between accruals and cash flows has
weakened over time and, if so, explore the potential reasons for such attenuation.
Our paper is closely related to Dichev and Tang (2008) and Srivastava (2014), which
both examine a temporal change in the properties of accounting earnings over the past decades.
Dichev and Tang (2008) document a persistent decline in matching between revenues and
expenses and the effect of this decline on earnings volatility, persistence and reversibility of
changes. Conceptually, both the timing role of accruals and the matching of revenues and
expenses are key elements of the accrual accounting system and thus are inherently related to
each other. Our investigation can be viewed as further development on the theme of accrual
accounting evolution from the accruals vs. cash flow perspective. The accrual perspective may
5 There is a debate in the literature about whether the smoothing property of accruals improves or impedes earnings
informativeness. In contrast to works noted above, some have adopted the view of smoothing as an earning management mechanism (i.e. Beatty et al., 2002; Leuz et al., 2003). For example, Myers et al. (2007) document a stronger negative correlation between changes in quarterly cash flows and accruals for firms with strings of
differ from revenue/expense perspective. In a given period, some transactions may affect the
timing of accruals and cash flows but not the matching between revenues and expenses. For
example, suppose a firm receives cash from a customer in advance of the delivery of the goods
or services. All else equal, this transaction leads to higher cash flows and lower accruals in
period t, but it does not affect any expenses recognized in period t with the matching principle.
On the other hand, other transactions may affect the matching between revenues and expenses
but not the timing of accruals and cash flows. For example, the imposed requirement to expense
employee stock options should increase the matching of expenses to the appropriate revenue, but
it should not change the smoothing property of accruals. Therefore, one may envision an
accounting reporting evolution where the matching of revenues and expenses is increasingly
disrupted over time, while the timing role of accruals, whether intended or nefarious, remains
unchanged and vice versa.6 However, both this study and Dichev and Tang (2008) support the
view that the prominence of matching as the fundamental principle in the determination of
earnings has significantly deteriorated over time.
Srivastava (2014) examines whether shifts in the real economy, and specifically the
growth in prominence of firms with high intangible intensity, explain the bulk of the temporal
changes in earnings properties. He finds that such sample composition changes are significantly
responsible for the decrease in the relevance of earnings and the matching between revenues and
expenses documented respectively by Collins et al. (1997) and Dichev and Tang (2008). The
growth in intangible-intensive firms could be related to our documented attenuation of the
association between contemporaneous accruals and cash flows. The operating cash outflows
6 Empirically, we find that the disappearing correlation between accruals and cash flows is not explained by the
related to the development of intangible assets such as patents, trade names, human capital, and
customer relations are typically immediately expensed and do not generate contemporaneous
accruals. However, it is also possible that our observed attenuation is supplementary or unrelated
to sample composition changes documented by Srivastava. As discussed above, the accrual
accounting changes may be independent of the matching decline, and the increases in
non-timing-related accrual recognition could be evident for both “old” and “new” economy firms.
3. Sample and Definition of Variables
We obtain our sample data from Compustat and limit the sample to firm-years with
non-missing accruals, cash flows, and average total assets variables. We use the balance sheet
approach to estimate total accruals before 1988 because firms were not required to disclose the
statement of cash flows until the promulgation of SFAS No. 95 in 1987. Specifically, before
1988, total accruals (TACC) are defined as changes in non-cash current assets less changes in
non-debt current liabilities minus depreciation expense, scaled by average total assets. Cash
flows (CFO) are cash flows from operations measured as earnings minus total accruals, where
earnings (E) are earnings before extraordinary items scaled by average total assets. To address
the fact that the balance sheet-based accruals suffer from measurement errors, especially for
firms with merger and acquisition activity or discontinued operations (Hribar and Collins, 2002),
we estimate the total accruals from the statement of cash flows from 1988 onwards.7 Thus, post
1987, cash flows (CFO) are cash flows from operations as disclosed on the statement of cash
flows, scaled by average total assets. Total Accruals (TACC) are measured as earnings scaled by
average total assets minus cash flows, where earnings are from the statement of cash flows.
Following the prior literature we exclude financial firms (SIC two digit code from 60 through
69) and firm-years with significant acquisition activity (ratio of sales from mergers and
acquisitions to net sales over five percent).8 Our final sample consists of 217,164 firm-year
observations from 1964 to 2014 (inclusive). While we use total accruals in the main analysis on
the premise that total accruals best capture the difference between accrual accounting and cash
accounting, the empirical results are basically identical if we use working capital accruals
(untabulated).
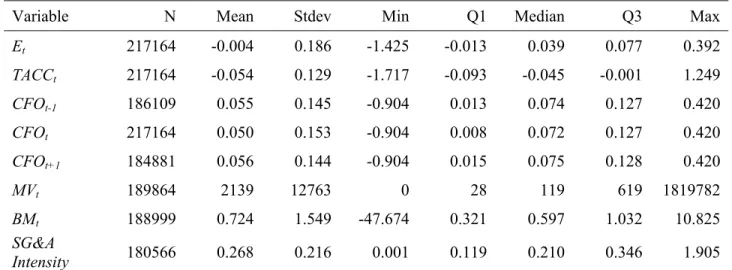
Table 1 presents the descriptive statistics and the correlation matrix of the variables of
interest. The descriptive statistics are generally in line with existing research (such as Table 2 of
Dechow and Dichev, 2002). The mean total accruals and operating cash flows are -0.054 and
0.050, respectively.9 The Pearson (Spearman) correlation between total accruals and
contemporaneous cash flows from operations on the pooled basis is expectedly negative at -0.14
(-0.39). In line with the timing role of accruals, the Pearson correlations between both total
accruals and past and future cash flows from operations are positive and statistically significant.
Similar to Dechow and Dichev’s (2002) results, we find that the positive Pearson correlations
between accruals and past/future cash flows are smaller in magnitude than the negative
correlation between accruals and contemporaneous cash flows. The Spearman correlation
between total accruals and past and future cash flows from operations is small and negative. As
discussed in Dechow and Dichev (2002) we may observe this within simple correlations because
the positive autocorrelation in cash flows combined with the negative correlation between
accruals and contemporaneous cash flows counteract the expected positive relation.
4. Results
4.1 Main results
4.1.1 Dechow (1994) model
We begin our analysis with the exploration between contemporaneous accruals and cash
flows over time. Dechow (1994) shows that accruals and cash flows are negatively correlated
because accruals tend to mitigate timing and matching problems in cash flows when reflecting
firm performance. We capture this relation by regressing total accruals on cash flows from
operations, as shown in equation (1a). We run equation (1a) each year and examine β1, the coefficient on CFO, and the adjusted R2, a measure of the model’s goodness of fit, over time.
(1a)
where TACC and CFO are total accruals and cash flows from operations, respectively.10
We present the results of the annual regressions in Panel A of Table 2. The adjusted R2
from equation (1a) has dropped from about 70% in 1960s to near zero in more recent years,
suggesting that the relative prominence of the timing role of accrual accounting has dramatically
declined over time. In a similar vein, the coefficient β1 has increased from about -0.7 to -0.02 over the past fifty years. To perceive the economic magnitude, the results can be interpreted as
follows: a negative cash flow shock of $1 is, on average, associated with a 70 cents increase in
accruals in the 1960s but only a 2 cents increase in recent years. Note that the R2 cannot drop
below zero, which limits the downside for the adjusted R2.
For completeness, we note that prior research and theory has frequently focused on the
relation between the changes, rather than the levels, in accruals and cash flows (McNichols and
Wilson, 1988; Leuz et al., 2003). To address this alternative specification we estimate equation
(1b) in a similar fashion.
10 We include the subscript t even in models run in the cross-section each year for stylized consistency with the
∆ ∆ (1b)
where ∆TACC and ∆CFO are annual changes in total accruals and cash flows from operations, respectively.
The results of the annual changes regressions are presented in Panel B of Table 2 and are
qualitatively similar to the levels results. The adjusted R2 from equation (1b) has dropped from
about 90% in 1960s to under 10% at its lowest in 2000 and has remained at approximately 15%
hereafter. The coefficient β1 has increased from about -0.9 to -0.4 from 1960s to 2000 and has remained above -0.6 subsequently.
In Panels C and D of Table 2, we examine the changes in the adjusted R2 and the
coefficient β1 from models (1a) and (1b) respectively in a more systematic fashion by regressing each on a time trend. In both panels, t-statistics in parentheses are adjusted for Newey-West
autocorrelations of three lags. We observe that the coefficient on the time trend is negative
(positive) and statistically significant for the adjusted R2 (β1) and the goodness of fit of the model is over 85% for both levels and changes specifications. The fitted values for the beginning and
ending year of the sample confirm the drastic decline in the smoothing relationship. Figure 1
presents the results from Table 2 in graphical form. It highlights the continuity and smoothness
of the decline (increase) of the adjusted R2 (β1) over time, suggesting that the pattern is not attributable to a regime shift.
4.1.2 Dechow and Dichev (2002) model
Next, we consider the Dechow and Dichev (2002) model that regresses total accruals on
past, current, and future cash flows, as shown in equation (2).
We show the results of the annual regressions in Panel A of Table 3. The adjusted R2
from equation (2) has dropped from about 70% in the 1960s to below 10% in the latest years,
and β2, the coefficient on contemporaneous cash flows, has increased from about -0.8 to -0.4 over the same time period. In Panel B of Table 3, we regress the adjusted R2 and cash flow
coefficients from model (2) on a time trend. The coefficient on the time trend is negative
(positive) and statistically significant for the adjusted R2 (β2) and the goodness of fit of the model is approximately 90% for both. The fitted values at the beginning and ending sample period
years exhibit an even more pronounced change than that observed in the results from the annual
regressions.
We do not offer a directional prediction regarding the change in the association between
accruals and past and future cash flows. One possibility is that the attenuation of the
contemporaneous association is partnered with a decline in the positive association with adjacent
cash flows for the same reason that affects the overall correlation between accruals and cash
flows when accruals are increasingly not utilized to smooth temporal variations in cash flows.
An alternative possibility is that the loss of the negative association between accruals and
contemporaneous cash flows is coupled with an increase in the association between accruals and
adjacent cash flows. This change could happen if the past/future cash flows related to current
accruals comprise a greater portion of the total cash flows while the portion of the current cash
flows related to current accruals decreases (i.e. the error component in past and future cash flows
decreases while the error component in the current cash flows increases). Turning to the
observed coefficients on past and future cash flows in Panel A of Table 3, we find that the
time-series changes are relatively small in magnitude. The coefficient on past cash flows, denoted as
the last ten years of the sample. A time trend regression in Panel B shows that the increase is
statistically significant but of a much smaller magnitude than an increase for the
contemporaneous cash flow coefficient. The coefficient on future cash flows, denoted as β3 in model (2), has increased from about 0.04 in the early to about 0.20 in the latest years of the
sample. The coefficient on the time trend in Panel B is about half the magnitude on the
coefficient on the time trend for contemporaneous cash flows. These relatively small temporal
changes in the coefficients on adjacent cash flows suggest that the dramatic decline in the
adjusted R2, a measure of greatest interest to us, is driven mainly by the loss of the association
between contemporaneous accruals and cash flows. This is consistent with the notion that while
the conceptual timing role of accrual accounting has remained unchanged, its relative
prominence has drastically declined.
Figure 2 presents the results from Table 3 in graphical form. Panel A shows a relatively
smooth and persistent decline of the adjusted R2, a summary measure of the mapping between
accruals and cash flows. Panel B shows the temporal variation in the coefficients on the past,
current, and future cash flows in the Dechow and Dichev (2002) model. As discussed previously,
we observe a pronounced attenuation of the negative coefficient on contemporaneous cash flows
and small increases of the coefficients on past and future cash flows.
Overall, the results in Section 4.1 indicate that the negative association between
contemporaneous accruals and cash flows has dramatically shrunk over the past fifty years. This
is evidenced by a striking temporal decrease in the adjusted R2 and the temporal increase in the
coefficient on contemporaneous cash flows in the accruals models based on Dechow (1994) and
Dechow and Dichev (2002). Furthermore, the attenuation of the overall correlation between
4.2 Possible explanations
Having documented the drastic decline in the magnitude of the overall correlation
between accruals and cash flows, we now explore the potential reasons for the observed
attenuation.
4.2.1 Economic-based and. timing-related cash flow shocks
Cash flows may fluctuate as a result of either economic-based or timing-related events.
Economic-based cash flow shocks represent fundamental shocks in firm performance and are
reflected in reported earnings independent of contemporaneous accruals. In contrast,
timing-related cash flow shocks stem from the inter-temporal variability of cash flows and thus are
negatively correlated with accruals. In this section, we consider a possibility that the relative
importance of economic-based and timing-related cash flow shocks may have changed over
time.
Dechow and Dichev (2002) note that the ability of accruals to map into cash flows is, in
theory, related to cash flow volatility. An increase in cash flow volatility over the sample period
could lead to a disruption in the expected stable relationship between cash flows and accruals
stipulated by the timing role of accrual accounting. Mathematically, the R2 and the cash flow
coefficient in equation (1a) can be written as ∗ , and , , respectively.
Thus, cash flow volatility (VAR(CFO)) directly affects both the R2 measure and the cash flow
coefficient. Cash flow variability has both economic-based and timing-related components. We
disentangle the two by using the lag-one autocorrelation in cash flows changes to proxy for
timing-related cash flow shocks. Timing-related cash flow shocks tend to reverse in subsequent
periods, suggesting a negative autocorrelation in changes in cash flows. Intuitively, this negative
mitigating its effect on earnings. Less noise in cash flows over time may call for a diminished
smoothing role of accruals, suggesting a negative link between the timing role of accruals and
the autocorrelation in cash flows changes. To address the second source of cash flow variability,
we proxy for economic-based cash flow shocks with a measure of the cash flow volatility after
controlling for the lag-one autocorrelation in changes in cash flows. In untabulated analysis we
observe that the lag-one autocorrelation in changes in cash flows is consistently negative
throughout our sample, indicating continuous presence of timing-related cash flow shocks. It is
largely flat from 1960s to mid 1990s and exhibits a slight increase in the last twenty years of the
sample (from approximately -0.4 to -0.3). The last twenty years of the sample also exhibit a
growing gap in the standard deviations of total accruals and cash flows from operations. Both
metrics are at roughly 0.11 in the early 1990s and diverge to about 0.14 and 0.19 for accruals and
cash flows respectively in the latest years of the sample. Together, the increasing gap in
volatilities and the relatively small change in autocorrelation of cash flow changes, suggest
relative growth (decline) in economic-based (timing based) cash flow shocks in the last twenty
years of the sample.
To examine whether a temporal increase in the operating cash flow volatility or a decline
in the magnitude of the autocorrelation in changes in cash flows are responsible in part or in full
for the attenuation of the accrual-cash flow link, we run the time-series regression (3a) on the
sample period.
. _∆ (3a)
where the dependent variable is adjusted R2 from the Dechow and Dichev (2002) regression as
represented in model (2). This variable captures the goodness of fit of the model where accruals
proxy for the overall correlation between accruals and cash flows. Time is a time trend
represented as the number of years from 1964. Std(CFO) is the cross-sectional standard deviation
of cash flows from operations calculated annually. Auto_ΔCFO is the average lag-one
autocorrelation in changes in cash flows from operations calculated annually.
We present the results of the regression model (3a) in Table 4. Column 2 indicates that
the coefficient on Std(CFO) is negative and statistically insignificant and the coefficient on
Auto_ΔCFO is negative and marginally significant suggesting that a decrease in the frequency or
the magnitude of timing-related cash flow shocks may contribute to the declining timing role of
accruals over time.11 Notably, cash flow effects do not subsume the effect of the time trend.
While the latter declines from -0.016 in column 1 to -0.014 in column 2, it remains statistically
significant. Overall, the results included in this section suggest that the growth in
economic-based cash flow shocks did not significantly contribute to the decline in the association between
accruals and cash flows, while a relative decline in the timing based shocks may have played a
limited role.
4.2.2 Timing-related vs. non-timing-related accruals
Conceptually, accruals include two components: timing-related and non-timing-related.
Timing-related accruals offset temporary fluctuations in cash flows whereas non-timing-related
accruals stem from conservatism, mark-to-market accounting, accrual estimation errors, earnings
management, and other events and estimates that are not directly related to contemporaneous or
adjacent time period cash flows. While timing-related accruals are negatively correlated with
operating cash flows, non-timing-related accruals are not. An increase in the frequency or
11 Recall that a negative autocorrelation in changes in cash flows is inherent to the timing role of accruals. If the
magnitude of non-timing-related accruals is thus expected to shrink the overall correlation
between accruals and cash flows.
We first use one-time items and non-operating items to proxy for non-timing-related
accruals. Prior literature shows that non-recurring items have drastically increased over time
(Bradshaw and Sloan, 2002). Because one-time items are by definition (or at least should be)
transient and do not play into the accrual accounting smoothing of earnings, they may be
contributing to the observed attenuation of the correlation between accruals and cash flows.
Although our main analysis already excludes extraordinary items from the measure of earnings,
we extend our work by considering the effect of special items and non-operating items, which
have drastically increased in both frequency and magnitude over the past fifty years.
Next, we consider the implications of loss firms for the association between accruals and
cash flows. The frequency of firms reporting losses has increased dramatically over the years
(Hayn, 1995; Klein and Marquardt, 2006), a fact that may contribute to the attenuation of the
correlation between accruals and cash flows.12 Arguably, many losses are not directly related to
operating cash flows and thus serve as a good proxy for non-timing-related accruals. However,
the frequency of firm-year losses may overlap with the first proxy considered above, as negative
one-time items may shift the reported earnings into loss territory. In addition, the frequency of
firm-year losses could also capture economic-based cash flow volatility, addressed in the prior
section, as firms subject to greater economic shocks are more likely to report losses. In that
12 The frequency of losses increases from about 3% in 1960s to over 30% in more recent years in our sample. When
we estimate the adjusted R2 from the Dechow and Dichev model separately for profit and loss subsamples, we find
that the Dechow and Dichev adjusted R2 declines for both profit and loss firms, but the decline is more dramatic for
loss firms: from 78% (68%) in the 1960s to about 50% (15%) in the most recent decade for profit (loss) firms. A decline in the adjusted R2 for both subsamples suggests that the information content of accruals has changed over
time for both profit and loss firms. A sharp drop in the adjusted R2 over time for loss firms is consistent with the
sense, the frequency of firm-year losses is a proxy for both non-timing-related accruals and
economic-based cash flow shocks.
We test the effect of one-time items, non-operating income, and reported losses by
running the time-series regression (3b) on our sample.
. (3b)
where the dependent variable and Time are defined as in model (3a). PctLoss is the annual
frequency of firms with earnings before extraordinary items less than zero. Std(OI-PTI) is the
cross-sectional standard deviation of the difference between operating income after depreciation
and pre-tax income. The difference OI-PTI largely captures special items such as impairments,
restructuring charges, and gains and losses from extinguishment of debt, but it also includes
non-operating income/expense, such as realized or unrealized gains or losses from investments.
Untabulated results indicate that the magnitudes and volatilities of both of these categories have
increased drastically over the time period examined. Furthermore, the presence and extent of
these items may be correlated with other one-time items aggregated with recurring income in the
reporting process and thus not explicitly identified as “special items.” Conceptually, because
most of these non-recurring items do not have operating cash flow impacts in contemporaneous
or adjacent time periods, their presence is expected to reduce the magnitude of the correlation
between accruals and cash flows.
Column 3 in Table 4 contains the regression results from model (3b). We find that the
coefficient on Std(OI-PTI) is insignificantly negative and that the coefficient on PctLoss is
negative and statistically significant. The inclusion of Std(OI-PTI) and PctLoss reduces the
coefficient on Time to -0.006 (from -0.016 in column 1). In untabulated analysis, we in turn
Time and find that when considered separately both coefficients are highly negative and
statistically significant.13 Overall, the results suggest that the increase in the frequency and
magnitude of non-timing-related accruals contributes to the attenuation in the overall correlation
between accruals and cash flows.
4.2.3 Poor matching between revenues and expenses
Next, we consider the effect of the temporal change in the matching between revenues
and expenses. The FASB’s slow push of balance sheet accounting towards greater prominence
may have changed the role of accruals over time (Dichev, 2008). Among the standards which
denote the ascent of fair value accounting are those on the determination and treatment of
goodwill, reporting for financial assets, and impairments of fixed assets. Dichev and Tang (2008)
document the aggregate effects of the regulatory evolution in the context of the loss of matching
between recognized revenues and expenses. They find a continuous and pronounced decline in
the contemporaneous correlation between revenues and expenses and corresponding changes in
earnings properties such as increased volatility, decreased persistence, and greater negative
autocorrelation. Conceptually, the poor matching between revenues and expenses is related to
non-timing-related accruals discussed earlier.
To examine whether a temporal decrease in the matching of revenues and expenses
documented by Dichev and Tang (2008) is related to the attenuation of the overall correlation
between accruals and cash flows, we run equation (3c) on the sample period.
. . (3c)
where the dependent variable and Time are defined as in model (3a). Adj.R2(DT) is the adjusted
R2 from the Dichev and Tang (2008) model run annually, which serves as a proxy for the
matching between revenues and expenses14:
where SALEare the net sales scaled by average total assets and EXPENSEare expenses measured
as sales minus earnings before extraordinary items scaled by average total assets.
The results of the regression model (3c) are reported in column 4 of Table 4. We observe
a negative and statistically insignificant coefficient on Adj.R2(DT), suggesting that the decline in
matching between revenues and expenses over time observed by Dichev and Tang (2008) did not
significantly contribute to the loss of the correlation between accruals and cash flows. The
coefficient on Time retains its negative magnitude and statistical significance. This result is
corroborated by the (untabulated) observation that while the goodness of fit metrics from the
Dechow (1994) and Dechow and Dichev (2002) models declined by over 70 percent, the
goodness of fit metric of Dichev and Tang (2008) decayed by only about 15 percent.
4.2.4 Intangible intensity
Srivastava (2014) examines whether the temporal decrease in the relevance of earnings
and the matching between concurrent revenues and expenses documented respectively by Collins
et al. (1997) and Dichev and Tang (2008) is driven by changes in the real economy or changes in
the accounting standards. He finds that the observed patterns are, for the most part, due to
changes in the composition of firms in the US economy, and particularly the growing
prominence of firms with high intangible intensity. The same factors that contribute to the
negative relationship between intangible intensity and average earnings quality measures could
be applicable to explaining the attenuation of the accrual-cash flow relation. Namely the growing
14 The results are qualitatively similar if we use the coefficient on EXPENSE
t as the proxy for the matching between
investments in intangible assets such as patents, trade names, human capital, and customer
relations all represent transactions which are, for the most part, expensed upon the outflow of
cash and, thus, do not lead to the contemporaneous generation of accruals. To examine whether a
temporal increase in the intangible intensity is responsible in part or in full for the attenuation of
the accrual-cash flow link, we run the time-series regression (3d) on the sample period.
. & _ (3d)
where the dependent variable and Time are defined as in model (3a). SG&A_Intensity is annual
average of the selling, general, and administrative expenses scaled by total expenses, the latter
equal to sales minus earnings before extraordinary items. Column 5 in Table 4 contains the
regression results from model (3d). We find that the coefficient on SG&A_Intensity is
insignificantly negative. The decline in the magnitude of the negative coefficient on the time
trend variable from column 1 to column 5 reveals that when considered alone, about 25%
[=(0.016-0.012)/0.016 ] of the timing role decline is related to the temporal growth in intangible
intensity documented by Srivastava (2014).15
Our main model in column 6 of Table 4 includes all six of the potential explanatory
variables for the attenuation of the correlation between accruals and cash flows. We find that in
this specification the coefficient on Time increases to -0.006 (t=-2.02). The coefficients on
Std(OI-PTI) and PctLoss are significantly negative, confirming our expectation that one-time and
non-operating items and the frequency of losses contribute to the attenuation in the correlation
between accruals and cash flows. The coefficients on cash flow volatility and autocorrelation are
insignificant while retaining an expected sign. The coefficient on SG&A_Intensity remains
negative and insignificant.16 Lastly, the coefficient on adj. R2(Dichev-Tang) becomes negative
and significant, suggesting that it captures measurement errors in the other explanatory variables
as the expected sign is positive.
One caveat in identifying potential explanations for the attenuation in the correlation
between accruals and cash flows is that the explanatory variables considered in Table 4 are
highly correlated. The magnitude of Pearson correlations between the six explanatory variables
ranges from 0.5 to 0.9, while the time series examined provide only 51 observations for each
variable. Multicollinearity could increase the standard error and thus render the coefficient
estimate on one or more variables to be statistically insignificant. The second caveat is that any
variable that is mechanically related to the time trend, such as the authors’ age over time, is
likely to exhibit significant coefficients. In light of these two caveats, we adopt the following
criteria when interpreting the results. First, each explanatory variable should have a strong
economic theory or intuition. Second, the explanatory variable should have a significant
coefficient with the expected sign in the stand-alone regression, and the coefficient must not flip
its sign from the stand-alone regression to the full model presented in column 6. Under these
criteria, we interpret the results in Table 4 to mean that one-time and non-operating items, and
loss firms are mostly responsible for the attenuation in the overall correlation between accruals
and cash flows and explain the majority of the effect (about 63% =(0.016-0.006)/0.016). The
temporal changes in economic and timing based cash flows shocks and in intangible intensity are
all related to the observed attenuation of the accruals-cash flow link, but that effect is subsumed
by other explanatory variables.
4.2.4 Asymmetrically timely recognition of gains and losses
As Ball and Shivakumar (2006) point out, another inherent property of accrual
current period cash flows from a durable asset are likely to be positively correlated with
revisions in its expected future cash flows, the timely gain and loss recognition role of accruals
suggests a positive correlation between accruals and contemporaneous cash flows. This positive
correlation will tend to offset the negative correlation from the timing role of accrual accounting
in a linear specification, such as equation (1a). Because losses are generally recognized in a more
timely fashion than gains, the positive correlation will not be symmetric. It is possible that the
effect of the asymmetrically timely gain and loss recognition gets stronger over the observed
period and thus attenuates the negative coefficient on cash flows from equation (1a) in the recent
years.
To incorporate the asymmetrically timely recognition of economic gains and losses via
accruals into our analysis, we follow Ball and Shivakumar’s (2006) extension of the cash flow
model and estimate equation (4) over the sample period.17
∗ (4)
where D is equal to one if annual ΔCFOt is negative and zero otherwise. We also consider an
alternative specification of D which is equal to one if CFOt is negative and zero otherwise. If the
observed decline in the correlation between accruals and cash flows, as evidenced by the
unadjusted Dechow (1994) model results reported in Table 2, is in large part due to the change in
the asymmetrically timely gain and loss recognition, then the adjusted R2 from equation (4)
should not change significantly over time.
The results of the adjusted R2 from the annual regressions are plotted in Panels A and C
of Figure 3 and show a continuous and smooth decline for both specifications of D. The key
finding is that for both specifications the adjusted R2 from equation (4) has dropped from about
unadjusted Dechow (1994) model reported in Panel A of Table 2. In Panel B we observe that the
coefficient on D*CFOt, where D equals 1 when CFOt is negative, is significantly negative in the
first ten years of the sample, suggesting that for this period the interaction variable does not
capture well the economic loss recognition role under this specification. The coefficient, on
average, is positive and increasing from mid 1970s to 2000, in line with Ball and Shivakumar’s
(2006) conjecture that the conservative recognition of expected losses has increased over that
time period. It declines slightly afterwards. When considering the specification where D equals 1
when ΔCFOt is negative in Panel D, we observe that the coefficient on D*CFOt, is largely zero
in the first fifteen years of the sample, suggesting a limited loss recognition role of accruals
during that period. The coefficient oscillates between zero and 0.25 in the remaining years but no
pronounced increase is evident. Using the levels (changes) specification of CFOt to define D,
the coefficient on CFOt increases from -0.67 (-0.65) in 1980, when the loss recognition
coefficient consistently takes on the expected sign, to about -0.35 (0.00) in the recent years,
indicating a declining timing role of accruals over this thirty year period. In untabulated analysis
we regress both coefficients and the goodness of fit metric from the Ball and Shivakumar (2006)
model on a time trend and observe expected, statistically significant, relationships.
Overall, we conclude that the attenuation in the correlation between accruals and cash
flows is not significantly driven by an offsetting increase in the accruals’ role of timely gain and
loss recognition. The adjusted R2 from Ball and Shivakumar (2006) non-linear specification
declines over time in a similar manner to the one from Dechow (1994) linear specification.
5. Robustness and Implications
We conduct cross-sectional regressions in the main analysis presented above in line with
most accrual accounting literature. In this section, we examine the relationship between accruals
and cash flows using firm-specific time-series regressions. Specifically, we break our sample
period into four subperiods: 1964-1975, 1976-1987, 1988-1999, 2000-2014. Then in each
subperiod, we estimate equations (1a) and (2) by firm. Panels A and B of Table 5 report
summary statistics of the coefficient estimate on CFO and the adjusted R2 from the Dechow
(1994) and the Dechow and Dichev (2002) models respectively. We find that the correlation
between accruals and cash flows considerably decayed over time even in these firm-specific
time-series regressions. In Panel A, the median CFO coefficient estimates from equation (1a)
increased from -0.91 in 1964-1975 to -0.82 in 1976-1987, further to -0.65 in 1988-1999, and
finally to -0.43 in 2000-2014. The median adjusted R2 declined from 0.84 in 1964-1975 to 0.71
in 1976-1987, further to 0.37 in 1988-1999, and finally to 0.16 in 2000-2014. The results from
equation (2) exhibit a similar, albeit slightly weaker, pattern in Panel B. In sum, the results from
firm-specific time-series regressions corroborate those from cross-sectional regressions in the
main analysis, suggesting that our results are not sensitive to regression specifications.
5.2 Sample composition
Next, we consider the effects of a change in the sample composition. Because we
examine a very long time-series it is feasible that the sample had changed significantly over time,
both in terms of specific firms and in terms of distinct industries gaining and losing prominence.
Srivastava (2014) documents that the observed changes in various earnings characteristics
documented in prior research are, for the most part, driven by the integration of successive
cohorts of newly listed firms into the sample. He observes that successive cohorts exhibit
expenses due to their increasing intangible intensity. The growth of firms with considerable
investments in intangible assets which are, for the most part, expensed upon cash outflows and
do not generate contemporaneous accruals, could contribute to the observed temporal attenuation
of the accrual-cash flow relation. Furthermore, newly listed firms are likely to possess some of
the characteristics which we find contributory to the attenuation, such as the probability of
loss-years. To examine the effect of the sample composition changes we follow Srivastava (2014)
methodology of separating the sample into successive listing cohorts by the first year in which a
firm’s data are available in Compustat. All of the firms with a listing year before 1970 are
classified as “pre-1970”, while the remaining firms listed in a common decade are referred to as
a cohort of firms newly-listed in the 1970s, 1980s, 1990s, and 2000s.
Table 6 presents the number of firm-year observations from the successive listing cohorts
in each year and the adjusted R2 of the annual regression of the levels model based on Dechow
(1994) for each cohort.18 The breakdown of the total sample by listing cohorts closely mirrors
that reported in Table 1 of Srivastava (2014). We graphically illustrate the main finding in Figure
4. Two patterns are noteworthy. First, the adjusted R2 from different cohorts are similar to each
other in any given window, especially in the 1960s – 1990s period when the adjusted R2 drops
dramatically.19 Second, the adjusted R2 exhibit a pronounced decline over the years for each of
the cohorts, suggesting that the attenuation of the accrual-cash flow relationship is prevalent both
among “old” and “new” economy firms. For example, the adjusted R2 for the pre-1970 cohort
drops from about 70% in 1960s to around 10% in 2000s. When we focus on the period from
2000 forward, we do find that the last two listing cohorts (1990s and 2000s) have lower adjusted
R2 than the first two listing cohorts (pre-1970s and 1970s), but the downward trend exists in all
18 We find the same results when using the Dechow and Dichev (2002) model.
19
cohorts (although the last two start from very low points). Overall, Table 6 and Figure 4 provide
compelling evidence suggesting that the documented attenuation in the accrual-cash flow
relation is not driven by the change in the sample composition, in contrast to the findings of
Srivastava (2014) for earnings quality metrics.
We further extend the analysis of sample composition effects in several ways. First, we
follow the logic of Dichev and Tang (2008) and repeat our analysis on the sample of largest
1,000 firms in each year as measured by total assets. Model 1 of robustness specifications
reported in Table 7 shows that the coefficient on the time trend and the goodness of fit of the
Dechow and Dichev (2002) model are only slightly decreased (by about 20% and 13%
respectively), when compared to those reported in the main analysis. We also carry out our
analyses on a relatively constant sample of firms with at least 30 (40) years of non-missing data
in our sample. Panels A and B of Figure 5 presents the results of the annual regressions of the
levels model based on Dechow (1994). We observe the decline (increase) of the adjusted R2
(coefficient β1) over time very similar to that reported in Figure 1 despite a significant reduction in the number of observations per year. Overall, we confirm that our results are not driven by
changes in sample composition.
5.3 Alternative definitions of accruals and cash flows in Richardson et al. (2005)
In this section, we consider alternative definitions of accruals and cash flows in
Richardson, Sloan, Soliman, and Tuna (2005). Richardson et al. introduce a comprehensive
measure of accruals that includes both current and non-current operating and financial accruals.
Following Richardson et al., we define TACCt as changes in non-cash assets minus changes in
equal to cash dividends plus stock repurchases less equity issuances. Then we repeat our main
analysis by estimating equations (1a), (1b), and (2) each year. The adjusted R2 from these three
equations exhibit a declining pattern very similar to that reported in the main analysis
(untabulated). Model 2 of Table 7 reports the results of regressing the goodness of fit measure
from the Dechow and Dichev (2002) model on the time trend when using the Richardson et al.
(2005) definitions of accruals. We observe that the coefficient on the time trend is negative and
highly significant, albeit a third smaller in magnitude (-0.010 compared to the -0.016 reported in
the main analysis). These results indicate that our main message of the declining overall
correlation between accruals and cash flows is robust to the broad definition of accruals and cash
flows in Richardson et al. (2005) and subsequent studies. To the extent that the broad definition
of accruals and cash flows contains more measurement errors with respect to the timing role of
accruals, we expect the results to be weaker than those based on traditional accrual measures, a
conjecture confirmed in Model 2 of Table 7.
5.4 Other robustness checks
There could be a number of other operations-based and regulatory reasons why the
correlation between accruals and cash flows has diminished over time. We carry out a battery of
additional tests to explore alternative explanations to the observed decline in the negative
association between accruals and cash flows. The remainder of Table 7 contains the results of
analyses which consider the impact of expanding the conceptual smoothing window and industry
composition. We briefly address each of these analyses below.
First, we consider the possibility that while the smoothing of cash flows via accruals has
decreased over the adjacent periods, the window of smoothing has expanded – i.e. accruals today
Dechow and Dichev (2002) model of mapping the past, present, and future cash flows into
accruals to include years -2 to +2 (Model 3 of Table 7) and years -3 to +3 (Model 4 of Table 7).
We observe that the negative loading of the time trend variable for adjusted R2 is largely
unchanged from that reported in Panel B of Table 3.
Next, we repeat the analysis by each 2-digit SIC industry and calculate the descriptive
statistics of the adjusted R2 from the Dechow (1994) and the Dechow and Dichev (2002) models
across industries. Prior research suggests that various changes in characteristics of financial
reporting over time are in large part driven by the growth of technology-based industries (Lev
and Zarowin, 1999). The mean, 1st quartile, median, and 3rd quartile of the adjusted R2 all
decline substantially over time. For the sake of brevity, we only report the regressions of mean
and median adjusted R2 from the Dechow and Dichev (2002) model in Table 7. Models 5 and 6
show that the coefficients on the time trend are highly significant, with t-statistics of about 20, in
both mean and median industry-specific adjusted R2 regressions. These results suggest that our
main findings are not driven by a specific industry or a significant change in the composition of
firms across industries. We complete this analysis by examining whether the potential
explanations for the attenuation in the association between accruals and cash flows hold in
various industries. Table 8 presents the results of the full model in Table 4 (column 6) across
sectors. We find that the coefficients on Time are negative for all sectors. Among potential
explanatory variables, Std(OI-PTI) and PctLoss have statistically significant coefficients with
expected signs in 4 and 5 (of the total 7) sectors respectively. These results are similar to those
reported in Table 4 for the whole sample and confirm that conclusions drawn above regarding
the observed attenuation and its likely causes are not limited to a select set of industries. The
(SEC=3) and services (SEC=7) sectors, rendering the coefficients on Time to be insignificant, a
result consistent with the notion that intangible intensity plays an important role in these two
sectors (Srivastava 2014).
Lastly, we carry out several robustness tests untabulated for brevity. We consider the
potential impact of a change in the operating cycles of firms. Dechow and Dichev (2002) suggest
that the magnitude of the estimation errors in the accrual generating process is related to the
length of the operating cycle. Thus, an increase in the average operating cycle could be
associated with a decrease in the accrual-cash flow relation due to larger estimation errors. We
examine the average annual operating cycle for our sample and find no pattern of a systematic
change over the past fifty years. We also consider the effect of using quarterly rather than annual
data and carry out the Dechow (1994) levels regression of total accruals on contemporaneous
cash flows from operations separately for the four fiscal quarters. We observe a pattern of
dramatic decline (increase) in the adjusted R2 (coefficient β1) similar to that reported in the annual analysis in Figure 1. The fourth quarter exhibits the most pronounced change from 1975
to 2011. This is in line with observed explanatory factors reported in our analyses as frequency
and magnitude of special items, particularly negative ones, is higher in the fourth fiscal quarter
(Potepa, 2014).
Overall, we find that our results on the loss of the correlation between accruals and cash
flows are robust to alternative samples, research designs, and specifications.
5.5 Implications to research
The models of the accrual-cash flow relationship are ubiquitous in the accounting
research literature. Empirical accounting studies most frequently either pool historical data over
sample period in examining their research questions. Our findings of a temporal change in the
structural relation between accruals and cash flows suggest that residual accruals as measured
with the Dechow (1994) or the Dechow and Dichev (2002) model and their various
modifications, may be systematically biased for the recent years. Carrying out pooled regressions
(either for a full sample, an industry, or a given firm) assigns an average intercept and
coefficients in the regression of accruals on cash flows. Because the inherent relation has
significantly declined over the years the estimated pooled regression would overestimate the
intercept and underestimate the coefficient on contemporaneous cash flows for the recent years.
The magnitude and variability of the residuals in such models (a metric often interpreted as a
measure of accrual quality) could then be systematically biased up or down depending on the
magnitude of the estimated coefficients and the values of cash flows. We illustrate that the
residual accruals are, in fact, systematically underestimated in more recent years in Table 9.
We estimate the Dechow (1994) levels model and the Dechow and Dichev (2002) model
in three ways: with annual regressions, pooled regression, and firm-specific regressions. Each
year we calculated the average and the standard deviation of residual accruals across firms under
each of the three specifications. We then calculate in turn the difference between the average
values of the residual accruals from the pooled regression and annual regressions, and from the
firm-specific regression and annual regressions. We repeat the process for the differences in
standard deviations. Finally, we regress the difference in average residuals from the Dechow
(1994) pooled (firm-specific) and annual regressions on the time trend and report the results in
the first (second) specification of Panel A. We observe that the magnitude of residual accruals
from the pooled regression is persistently lower than that from the annual regressions for the