THE INJURY EXPERIENCE OF UNION DRYWALL CARPENTERS IN WASHINGTON STATE, 1989-2008
Ashley Land Schoenfisch
A dissertation submitted to the faculty of the University of North Carolina at Chapel Hill in partial fulfillment of the requirements for the degree of Doctor of Philosophy in the Department of
Epidemiology, Gillings School of Global Public Health.
Chapel Hill 2012
ii © 2012
iii ABSTRACT
ASHLEY LAND SCHOENFISCH: The injury experience of union drywall carpenters in Washington State, 1989-2008
(Under the direction of Dr. Steve Marshall)
Despite research over the past 15 years addressing patterns of injury among drywall installers, work remains to understand the health of these workers and guide the development of targeted injury prevention strategies. The purpose of this study was to describe the incidence of, and circumstances surrounding, work-related injuries among drywall carpenters, and examine potential care shifting between two systems: workers’ compensation and private insurance.
Using data from the Carpenters Trusts of Western Washington and the Washington State Department of Labor and Industries, we defined a 20-year (1989-2008) cohort of 5,073 union drywall carpenters, their 37 million union work hours in Washington State, their workers’
compensation claims and their union-provided private health insurance claims. Data were linked at the level of the worker using an encrypted identifier. Rates of work-related injury and health care utilization were examined by worker characteristics and over calendar time. Brief narratives were used to gather additional injury event details, and qualitative data gathered through
interviews with substantive experts provided contextual details.
iv
been increasing since the mid-1990s. Higher rates of health care utilization were observed for drywall carpenters with at least one work-related injury (versus no injury).
The observed decline over time in drywall installers’ rate of work-related injury is
vii
ACKNOWLEDGMENTS
Several individuals have been particularly instrumental in the assembly, extension and maintenance of this unique cohort of union carpenters. In particular, we thank Lin Conley and Larry McNutt at the Carpenters Trusts of Western Washington for their continued support in making the union carpenter data available for research purposes. We thank Darrin Adams at the Safety and Health Assessment and Research Prevention (SHARP) Program in the Washington State Department of Labor and Industries for provision of the workers’ compensation claims files for linkage to the carpenter cohort. We appreciate the helpful comments provided on pieces of this research by Barbara Silverstein, also at the SHARP Program, and Darrin Adams. A special thanks to the Pacific Northwest Regional Council of Carpenters and the representatives, instructors and construction superintendents and foremen who allowed for visits their worksites and spent time talking about the drywall trade and the construction industry. We thank Wilfred “Buck” Cameron of Strategic Solutions for Safety, Health and Environment for his key
involvement in the conduct of work site visits and expert interviews in Seattle, Washington, as well as his thoughtful contributions to various aspects of the research study. Thank you to epidemiologists in the Division of Occupational and Environmental Medicine at Duke University Medical Center – Hester Lipscomb, John Dement, Kristen Kucera, Doug Myers – for thoughtful comments on various aspects of this work. Thank you to my dissertation committee members – Steve, Alan, Carri, David and Hester – for providing comments on this work and to many of you for being particularly instrumental in my development as an epidemiologist over the past 4 years. Thank you to Kristie Wicker for research support, particularly in the managing logistics related to travel to Washington State. Thank you to Amanda McCoy for helpful collaboration in the early stages of this work. This work was supported by the National Institute for Occupational Safety and Health (Grant number: 1 U600H009761).
vii
TABLE OF CONTENTS
LIST OF TABLES……….………….………….………….………….………….………. ix
LIST OF FIGURES………….………….………….………….………….………..……….. xi
LIST OF ABBREVIATIONS AND SYMBOLS….………….……….………….………. xii
CHAPTER 1. INTRODUCTION……… 1
Overview………….………….………….………….………….………….……….…….… 1
Overall objectives and specific aims………….………….………….……….…. 2
CHAPTER 2. BACKGROUND………….………….………….………….………….………. 5
Occupational health and safety in the construction industry….……….…….……..… 5
Construction industry research challenges and progress………….…….……… 7
Construction workers involved in drywall installation….………….……… 11
Drywall installers’ occupational safety and health….………….………….……… 12
Summary of research needs….………….………….………….………….……… 14
CHAPTER 3. RESEARCH DESIGN AND METHODS….………….……….…………..……… 17
Rationale and Overview….………….………….………….……….……….……… 17
Data sources……..….………….………….………….……….……….………….……… 19
Source cohort of members of the United Brotherhood of Carpenters and Joiners of Western Washington, 1989 through 2008….………….………… 19
Direct observation of construction site drywall work.………….………..… 21
Key informant interviews….………….………….…….………….…….……… 22
Outcomes…...………….………….………….………...……….………….………...…... 22
Time at risk…...………….………….………….………...……….………. 25
Explanatory variables…...………….………….………….………...………. 25
Statistical approach…...………….………….………….………...………...……. 27
CHAPTER 4. WORK-RELATED INJURIES AMONG UNION DRYWALL CARPENTERS IN WASHINGTON STATE, 1989-2008….………….….…….. 36
vii
Overview.……….………….………….………….………….…….…….………..…….… 36
Introduction….………….………….………….………….……….…….….……...… 36
Methods….………….………….………….………….………….……….….….… 38
Cohort data….………….………….………….………….………….……….. 38
Time at risk and covariates….………….………….………….………....…. 39
Injury and illness data….………….………….………….……….…….…… 39
Statistical methods….………….………….………….……….…………..… 41
Results….………….………….………….………….………….……….………… 42
Description of the study cohort….………….………….……………….………...… 42
Work-related injury claims among drywall installers….……………….………..… 43
Characteristics of work-related injuries among drywall installers….………. 44
Discussion….………….………….………….………….………….……….…….…….… 46
A sub-analysis examining drywall installers’ work-related injury rates by time of union entry with respect to study follow-up …...…….………….………….. Tables and Figures………... 51 57 CHAPTER 5. CHARACTERISTICS OF AND CIRCUMSTANCES SURROUNDING WORK-RELATED INJURIES AMONG UNION DRYWALL CARPENTERS IN WASHINGTON STATE, 1989-2008: AN ANALYSIS OF INJURY NARRATIVES….….………….……….……….………. 73
Overview…….………….………….………….………….……….…….…….……… 73
Introduction….………….………….………….………….………….….…….………...… 74
Methods….………….………….………….………….………….……….……..… 75
Cohort data………….………….………….………….………….………….……..… 75
Workers’ compensation claims data and narrative text data……...………….… 76
Coding of injury narratives…….………….………….……….….…….……… 76
Analyses………….………….………….………….………….……….…… 77
Results.………….………….………….………….………….……….………… 77
Falls from elevation………….………….………….………….….……….….……… 78
Falls on the same level………….………….………….……….…….…….……..… 80
vii
Overexertion/bodily reaction ………….………….………….….………….…….…. 81
Drywall sheet type and size ………….………….………….….………….…….….. 82
Comparison of ANSI/OIICS codes to information gathered in narratives……… 83
Discussion……….….………….………….….………….………….….………….……… Tables and Figures………... CHAPTER 6. MUSCULOSKELETAL BACK DISORDERS AMONG DRYWALL CARPENTERS IN WASHINGTON STATE, 1989-2008………….……….…… 84 90 95 Overview………….………….………….………….………….……….…….…….……… 95
Introduction……….………….………….………….……….…….……….…….… 96
Methods………….………….………….………….………….……….………….……..… 98
Data sources…….………….………….………….………….……….…….…….…. 98
Outcomes, covariates and time at risk……….………….………….…………....… 100
Analyses…….………….………….………….………….………….…….….………. 101
Results………….………….………….………….………….……….……….……… 102
Description of the study cohort….………….………….……….…….…………..… 102
Work-related overexertion back injuries….………….……….……….…… 102
Health care utilization for musculoskeletal back disorders covered through union-provided health insurance………………….….. 103
Examination of the relationship between health care utilization for musculoskeletal back disorders and work-related overexertion back injuries... 104
Discussion………….………….………….………….………….……….………... Tables and Figures………... 105 109 CHAPTER 7. SYNTHESIS………….………….………….………….……….……….. 114
Overview of findings………….………….………….………….……….……… 114
Limitations ………….………….………….………….……….….……….………. 117
Strengths………….………….………….………….………..……….……… 120
Significance and public health impact…….………….………….………….……….…. 122
Directions for future research……..………….………….………….……….……..……. 123
APPENDIX A: Site visit tool……….….……….……… 127
vii
APPENDIX B: Interview guide………... APPENDIX C: Results presented to interview participants………..
128 136 REFERENCES……….………….………….………….………….……….……….. 138
x
LIST OF TABLES
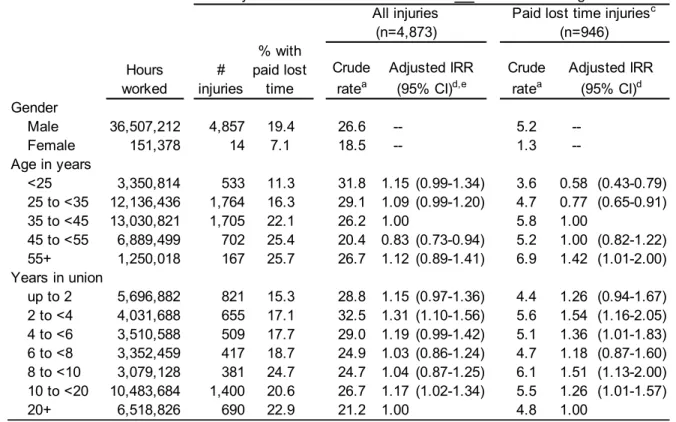
Table 4.1. Number of worker-hours, work-related injuries, crude injury rates, adjusted injury rate ratios and 95% confidence intervals, stratified by worker characteristics and type of work performed, Washington State
union carpenters, 1989-2008………. 59 Table 4.2. Frequencies, rates and 95% confidence intervals of work-related
injuries, and proportion with paid lost time, stratified by whether drywall material was considered a contributing factor in the injury event and by mechanism, nature and body part affected, union drywall installers,
Washington State, 1989-2008………... 60 Table 4.3. Among drywall installers, number of worker-hours and work-related
injuries in which drywall material was considered to be a contributing factor, with proportion with paid lost time, crude injury rates, adjusted incidence rate ratios and 95% confidence intervals, workers'
compensation claims data, Washington State union carpenters,
1989-2008…….……… 62
Table 4.4. Among drywall installers, number of worker-hours and work-related injuries in which drywall material was considered to not be a contributing factor, with proportion with paid lost time, crude injury rates, adjusted incidence rate ratios and 95% confidence intervals, workers' compensation claims data, Washington State union
carpenters, 1989-2008……….. 63
Table 4.5. Among drywall installers, crude rates, adjusted incidence rate ratios and 95% confidence intervals of work-related injuries by worker age and time in the union, stratified by the source of injury, Washington
State union carpenters, 1989-2008…………..…………..……..……..………... 64 Table 4.6. Stratified by the predominant type of work performed, worker
characteristics by prevalent versus incident union entry, Washington
State union carpenters, 1989-2008…....……..……..……..……..……… 69 Table 4.7. Number of worker-hours, work-related injuries, crude injury rates,
adjusted injury rate ratios and 95% confidence intervals, stratified by worker characteristics and type of work performed, Washington State union carpenters who joined the union in 1989 or later, Washington
State union carpenters, 1989-2008…………..………...……... 72 Table 5.1. By injury mechanism, categories used to capture information about
injury events, Washington State union drywall carpenters, 1989-2008…... 90 Table 5.2. Comparison between ANSI/OIICS-coded injury mechanisms to
information provided in the injury narratives, Washington State union
drywall carpenters, 1989-2008... ... 93 Table 5.3. Among drywall installers’ falls from elevation and falls on the same
level with a primary source of injury code (ANSI/OIICS) for “floor, walkway, or ground surface” (58*/62*), secondary source of injury codes (ANSI/OIICS) and text-confirmed contributing factors,
Washington State union carpenters, 1989-2008……... 94
x
Table 6.1. Number of worker-hours and work-related overexertion back injuries with crude injury rates, adjusted incidence rate ratios and 95% confidence intervals, stratified by predominant type of work performed, workers' compensation claims data, Washington State union
carpenters, 1989-2008……… 110
Table 6.2. Number of months of insurance eligibility and visits for musculoskeletal back disorders, utilization rates, rate ratios and 95% confidence intervals, stratified by the predominant type of work performed,
Washington State union carpenters, 1989-2008……… 111 Table 6.3. Drywall installers’ incidence rates, rate ratios and 95% confidence
intervals associated with health care utilization through the carpenters' trust for musculoskeletal back diagnoses, stratified by the number of work-related overexertion back injuries and time since the injury,
Washington State union carpenters, 1995-2008……… 113
xii
LIST OF FIGURES
Figure 2.1. Work activities and common drywall lifting methods among drywall
installers, adapted from work by Pan et al. (1999a)……….. 16 Figure 4.1. Crude rates of work-related injuries overall and 95% confidence
intervals over calendar time, stratified by predominant type of work
performed, Washington State union carpenters, 1989-2008………...… 57 Figure 4.2. Crude rates of work-related injuries with paid lost time and 95%
confidence intervals over calendar time, stratified by predominant type
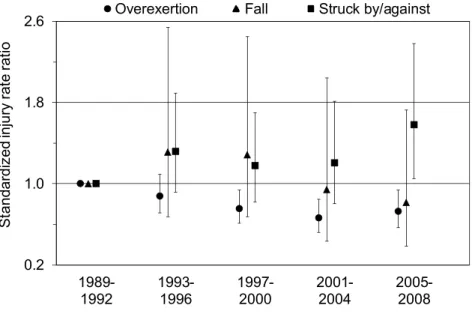
of work performed, Washington State union carpenters, 1989-2008………. 58 Figure 4.3. Among drywall carpenters, standardized injury rate ratios and 95%
confidence intervals of observed rates of injury over time in which drywall material was a contributing factor, compared to expected rates (based on injuries of a similar mechanism in which drywall material was
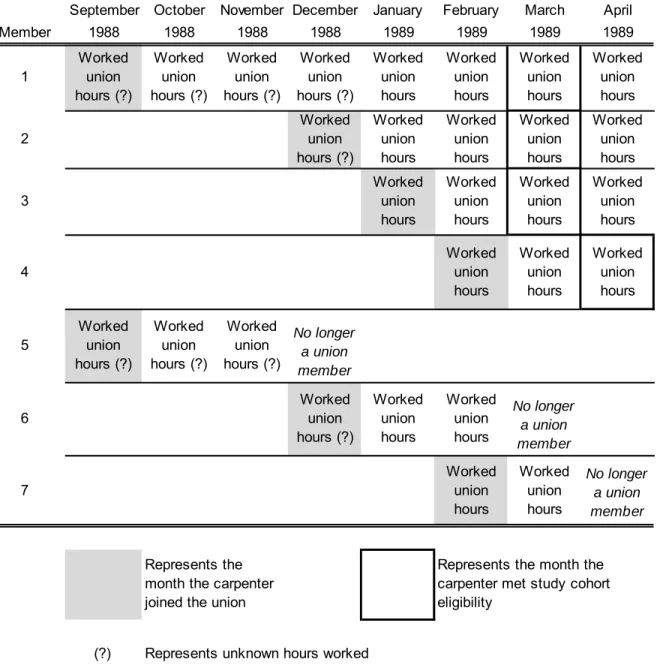
not a contributing factor), Washington State union carpenters, 1989-2008……. 65 Figure 4.4. Graphical representation of the cohort by date of union entry………... 66 Figure 4.5. The proportion of union drywall carpenters who joined the union
prior to the start of study follow-up, by year, Washington State union
carpenters, 1989-2008………... 67
Figure 4.6. The proportion of worker-hours contributed by union drywall
carpenters who joined the union prior to the start of study follow-up,
by year, Washington State union carpenters, 1989-2008……… 68 Figure 4.7. Rates of work-related injury over time stratified by union entry status
(prevalent verses incident), with 95% confidence intervals,
Washington State union carpenters, 1989-2008……… 70 Figure 4.8. Rates of work-related injury with paid lost time over time stratified by
union entry status (prevalent verses incident), with 95% confidence
intervals, Washington State union carpenters, 1989-2008……….. 71 Figure 5.1. Among drywall installers, percent of falls from elevation by the
surface from which the worker fell, Washington State union
carpenters, 1989-2008………... 91
Figure 5.2. Among drywall installers, percent of injuries of each mechanism by the task in which the worker was engaged, Washington State union
carpenters, 1989-2008………... 92
Figure 6.1. Crude rates of work-related overexertion back injuries and 95% confidence intervals over calendar time, stratified by the predominant type of work performed, with rates of health care utilization overlaid (solid line, all workers combined), Washington State union carpenters,
1989-2008……….……….. 109
Figure 6.2. Musculoskeletal back visits per 100 person-years of eligibility by time in the union, stratified by predominant type of work performed. Stratified rates were estimated using negative binomial regression.
Washington State union carpenters, 1989-2008……….. 112
xii
LIST OF ABBREVIATIONS
ANSI American National Standards Institute BLS Bureau of Labor Statistics
CI Confidence interval
CTWW Carpenters’ Trusts of Western Washington
df degrees of freedom
FTE Full-time equivalent
GEE Generalized estimating equations ICD International Classification of Diseases
NIOSH National Institute for Occupational Safety and Health NORA National Occupational Research Agenda
OIICS Occupational Injury and Illness Classification System OSHA Occupational Safety and Health Administration RBRVS Resource-based relative value scale
r2p Research to practice
SHARP Safety and Health Assessment and Research Program SOII Survey of Occupational Injuries and Illnesses
US United States
WC Workers’ Compensation
1 CHAPTER 1
INTRODUCTION
Overview
Construction workers involved in drywall installation are at high risk of work-related injury. A study of union carpenters in Washington State reported overall workers’ compensation (WC) claim rates among drywall installers that were 25 percent higher than rates among carpenters in all trades combined [Lipscomb HJ, et al. 2000]. Studies have documented a considerable risk of overexertion, fall-related and struck-by injuries among drywall installers [Chiou SS, et al. 2000, Lipscomb HJ, et al. 2003a, Lipscomb HJ, et al. 2008, Lipscomb HJ, et al. 2000, Lipscomb HJ, et al. 2003d]. Despite progress over the past 15 years in understanding injuries among construction workers involved in drywall installation, work remains to understand the health of these workers and guide the development of effective interventions targeted at the prevention of injuries in this high-risk trade.
2
exposures and the context from which the injury rate data arose. These qualitative methods were guided in part through direct observation of drywall installation work on construction sites.
The study addresses research goals recently set forth by the National Occupational Research Agenda’s (NORA) Construction Sector Council [NORA Construction Sector Council 2008] to reduce injuries associated with falls (Strategic Goal 1.0) and struck-by hazards (Strategic Goal 3.0), as well as to reduce the incidence and severity of work-related musculoskeletal
disorders among construction workers (Strategic Goal 7.0). Furthermore, interviews with trade experts included the sharing of research results, supporting the National Institute for Occupational Safety and Health’s (NIOSH) Research to Practice (r2p) initiative to share and translate research findings.
Over the 20-year study period, 5,073 carpenters were affiliated with a union local whose predominant type of work was drywall installation. These workers contributed 36.7 million hours of union work and filed over 6,000 WC claims. The scope of this cohort, in terms of both its size and available sources of data, facilitated the most comprehensive research to date on
occupational injuries and illnesses among drywall installers.
Overall objectives and specific aims
The purpose of this study was to enhance the body of scientific knowledge on work-related injuries among carpenters involved in drywall installation. First, we sought to describe the
incidence of and circumstances surrounding work-related injuries among drywall carpenters using a well-defined cohort of union carpenters in Washington State from 1989 through 2008,
3
• Stratified by the type of work performed (drywall installation versus other types of carpentry), quantify rates of overall injury, paid lost work day(s) injury, and drywall material-related injury. Quantify injury rates by year and describe characteristics of injuries (body site affected, nature, event, source, paid lost time) and injured workers (age, gender, time in the union).
• Calculate injury rate ratios comparing rates of these three injury outcomes (overall injury, paid lost work day(s) injury, and drywall material-related injury) overall and over time by predominant type of work performed (drywall installation versus other types of carpentry), worker age and worker time in the union. Perform stratified analyses as needed by characteristics of the injuries (body site affected, nature, event, source, paid lost time) and workers (age, gender, time in the union).
• Describe injury event details through an analysis of injury narrative text data to investigate factors contributing to the injury, with an emphasis on identifying injuries related to drywall material and possible preventive factors.
Additional work was aimed at enhancing the understanding of drywall installers’ use of health care covered through union-provided health insurance for musculoskeletal conditions of the back. Analyses were performed to quantify health care trends over time (1989 through 2008) and explore potential care-shifting between the WC and union-provided health insurance systems. The specific aims associated with this study objective were:
• Stratified by the type of work performed (drywall installation versus other types of
4
• Calculate injury rate ratios comparing health care utilization rates for musculoskeletal conditions overall and over time by predominant type of work performed (drywall installation versus other types of carpentry), worker age, gender and time in the union.
5 CHAPTER 2
BACKGROUND
Occupational health and safety in the construction industry
The construction industry is one of the largest industries in the nation, currently
employing about 5.6 million workers or roughly 8% of the national workforce across a variety of trades [Bureau of Labor Statistics. US Department of Labor 2011a,b, The Center for Construction Research and Training 2007]. Compared to the national workforce, construction workers are younger (39 versus 41 years), predominantly male (90% versus 54%), and more likely to be foreign-born (22% versus 15%) [The Center for Construction Research and Training 2007].
6
and nonfatal injury rates between construction occupations in the industry have been observed [The Center for Construction Research and Training 2007], undoubtedly reflecting variations in job tasks.
Reports based on data from the BLS or WC claims suggest there have been declines in rates of work-related injuries and illnesses in the US construction industry (and in the US workforce overall) since the early 1990s. The BLS and Department of Labor have attributed the declines to safer workplaces [Chao EL 2000, Occupational Safety and Health Administration 2000]. Accordingly, in the late 1980’s there was increased attention to construction workplace safety [Welch LS, et al. 2007]. Large construction owners began to pre-qualify bidders based, in part, on safety and health performance. In addition, WC costs began to rise dramatically. A focus to win bids and control the high costs associated with work-related injury brought new attention to injury management and return-to-work programs during this time. In addition, during the 1990’s, regulatory efforts were aimed at preventing injuries from falls, notably the 1991 vertical fall protection standard for the construction industry in Washington State and the national-level revised Safety Standard for Fall Protection by the Occupational Safety and Health
Administration (OSHA) in 1994.
Despite these encouraging efforts to enhance workplace safety over the past several decades, it has also been suggested that the observed declines may be attributed, in part, to factors other than improved workplace safety. These factors include major changes in OSHA’s recordkeeping requirements toward a generally more exclusive definition of “recordable case” [Friedman and Forst 2007]. Under-reporting of work-related injuries by employees and
7
employees who do not report, including efforts to bid competitively, contain workers’
compensation costs and avoid targeted regulatory inspections [Government Accountability Office 2009, US House of Representatives June 2008, Welch LS, et al. 2007]. A US Government Accountability Office study suggests even occupational practitioners have been pressured by employers to practice in a way that leads to under-reporting of work-related injuries [Government Accountability Office 2009]. Employees may have intentionally under-reported injuries as well, given incentives to not report and fear of potential consequences of reporting (e.g., reduced hours, job loss) [Azaroff, et al. 2002, Pransky G, et al. 1999, Shannon HS and Lowe GS 2002, The Center for Construction Research and Training 2007].
Construction industry research challenges and progress
Much of our understanding of nonfatal injuries and illnesses in the construction industry come from large national databases and state-level resources, particularly BLS’ SOII and WC claims. These data have been used to highlight trends over time, injury characteristics, and worker and workplace characteristics associated with higher risk of injury.
8
Research suggests WC compensates under half of the total costs associated with work-related injuries among construction industry workers [Dong X, et al. 2007]. Medical care and costs associated with work-related musculoskeletal conditions may be covered instead by private medical insurance, government social service agencies, or the worker themselves [NORA Construction Sector Council 2008] [Koehoorn M, et al. 2006, Lipscomb HJ, et al. 2009a, Lipscomb HJ, et al. 2009b].
In addition to providing an under-count of work-related injuries and illnesses, additional limitations of currently-available sources of occupational injury and illness data hamper health and safety research efforts, including inconsistency over time and geographic regions, incomparability between data sources, a lack of detailed industry or occupational identifiers, a lack of post-injury experience data, a lack of appropriate denominator data, and a lack of data access and linkage [The Center for Construction Research and Training 2007].
Construction occupational safety and health research challenges also stem from the organization of work in the industry. A large proportion of construction workers are
9
Workers in the construction industry face frequent change between work projects and employers. A worker may be employed on a particular project for a few days (e.g. painting a house) to a few years (e.g., work on a large commercial project) and then move on to a new project. Even within a single project, a worker may be responsible for several different assignments and is often required to be mobile on the worksite. Over the course of the
construction project, the worksite itself changes, both physically and in terms of other workgroups on site. All of these characteristics can present challenges to the collection of exposure and outcome data.
Several approaches have been taken to address research needs in the construction industry while overcoming some of the challenges described. Cross-tabulations of various injury characteristics (often based on American National Standards Institute (ANSI) or Occupational Injury and Illness Classification System (OIICS) coding), including injury mechanism, nature of injury, body part, and source from which energy was transferred, has been used to gather a more detailed understanding of circumstances surrounding construction industry injuries [Chiou SS, et al. 2000, Hsiao H and Stanevich RL 1996, Lipscomb HJ, et al. 1997, Lipscomb HJ, et al. 2003a, Lipscomb HJ, et al. 2003d]. While informative, this approach is still rather crude. For example, for an injury with a mechanism of fall from elevation, the source of injury is coded as the object to which the person fell (i.e., floor). In terms of informing injury prevention efforts, knowledge of whether the worker was handling materials and the type of surface from which (s)he was working may be more insightful. Also, use of broad categories in the cross-tabulations may still not provide information on noteworthy differences by construction trades.
10
is limited by inconsistencies in the types and amount of information recorded in the text fields. Even if narratives were complete in their ascertainment of event details, it is important to
recognize they only provide information on injury events. That is, they inherently lack information on the exposure of the population at risk to various hazards.
Active injury surveillance efforts have also been undertaken to better understand the injury experience, and particularly the post-injury experience, of construction industry workers. From 1999 through 2002, Lipscomb et al. conducted an active injury surveillance project in St. Louis, Missouri among workers in the United Brotherhood of Carpenters and Joiners of North America [Lipscomb HJ, et al. 2003a, Lipscomb, et al. 2003c, Lipscomb HJ, et al. 2003d]. Contractors agreed to report all OSHA-recordable injuries to the project office, and the local trust provided hours of time at risk for each worker, allowing for the calculation of injury rates.
Research staff contacted injured workers to participate in a telephone interview to gather details about their injury experience, and focus groups with injured workers provided contextual detail of the work done and safety practices in place. Visits to work sites at which the injuries occurred gave insight into safety measures in place on construction worksites. Despite its strengths, this research approach was costly and time-consuming, and the reporting of injuries to the project office was not always prompt.
To address the potential coverage of medical care associated with work-related
musculoskeletal conditions by sources other than WC, a recent study of Washington State union carpenters examined patterns over time in rates of musculoskeletal back disorders as captured through the WC and union-provided health insurance systems from 1989 through 2003 [Lipscomb HJ, et al. 2008b, Lipscomb HJ, et al. 2009a]. WC claim rates declined over the time period, while private health care utilization rates increased. Such ecologic findings support a lack of
11
insurance-based care systems, including cost-shifting from the WC system to both the union-provided health insurance system and the injured worker [Lipscomb HJ, et al. 2009b].
Construction workers involved in drywall installation
This research is focused on workers who install drywall - a sparsely-studied construction industry trade at high risk for work-related injuries. In 2005, drywall installers made up about 2.1% of workers in the construction industry [The Center for Construction Research and Training 2007]. Work tasks related to drywall installation, which can occur on residential or commercial worksites, are physically demanding and hazardous. Drywall installers must lift and carry drywall sheets from their location on the work site to the work area. Drywall sheets are made up of a layer of gypsum, usually 1/4 inch to 1 inch thick, between two layers of paper. They come in standard sizes, typically 4 feet by 8, 12 or 16 feet, and their weight typically ranges from 50 pounds to over 200 pounds per sheet, depending on the size and material. Drywall installers measure and cut the drywall using knives or saws prior to positioning it, so that it can
accommodate doorways, windows, other openings or fixtures, and electrical outlets. Finally, they lift, secure and hang the drywall sheets into place. Electrical screw guns are typically used to attach drywall sheets to a ceiling or wall.
Drywall installation work may take place while on an elevated surface (often with limited space), near unguarded openings, in cluttered work areas. Furthermore, work may occur in close proximity to workers in other trades and their materials, including electricians, framers or painters. For work at height, drywall installers may use assistive devices such as ladders or scaffolds. Assistive devices have been designed to transport and hold drywall sheets, such as dollies/carts, carriers, and lifts. A more detailed description of activities involved in drywall installation,
12
Drywall installers’ occupational safety and health
Construction workers involved in drywall installation are at high risk of work-related injury compared to their industry counterparts [Chiou SS, et al. 1997, Lipscomb HJ, et al. 2000]. Research of union carpenters in Washington State from 1989 through 1995 reported overall WC claim rates among drywall installers of 53.3 per 200,000 hours worked, 25% higher than rates of WC claims among all carpenters in the cohort [Lipscomb HJ, et al. 2000]. Compared to
carpenters in other types of work, drywall carpenters in this cohort have exhibited higher rates of sprains to the back, back/neck combined and ankle [Lipscomb HJ, et al. 1997], as well as overexertion-related back injuries [Lipscomb HJ, et al. 2008a, Lipscomb HJ, et al. 2008b].
Using injury data from BLS’ Supplementary Data System in conjunction with data from the US Department of Labor and Commerce, drywall installers had the fourth highest rate of work-related nonfatal injury (27.5 injuries per 100 workers) among all construction occupations [Hsiao H and Stanevich RL 1996]. In addition, in an analysis of drywall installers’ injuries with days away from work based on the BLS’ SOII, Chiou et al. (1997) estimated rates of 7.7 and 5.4 per 100 workers in 1992 and 1993, respectively. These rates were higher than those for all construction occupations combined [Chiou SS, et al. 1997].
13
In line with drywall installers’ job tasks, studies have consistently documented struck by/against, overexertion and falls as common mechanisms of injury among drywall installers [Chiou SS, et al. 1997, Chiou SS, et al. 2000, Hsiao H and Stanevich RL 1996, Lipscomb HJ, et al. 2003a, Lipscomb HJ, et al. 2008, Lipscomb HJ, et al. 2000, Lipscomb HJ, et al. 2003d, Lipscomb HJ, et al. 2003e]. However, these common injury characteristics are the same as those seen across the construction industry as a whole. Thus, simply knowing the event or exposure leading to injury may not be sufficient to inform effective targeted prevention efforts, since the work environment and job tasks likely differ by trade.
As noted, the elevated injury incidence among drywall installers may be attributed, in part, to their exposure to handling building materials, predominantly drywall [Chiou SS, et al. 1997, Chiou SS, et al. 2000, Lipscomb HJ, et al. 2003a, Lipscomb HJ, et al. 2000]. Drywall has been noted as contributing to a considerable proportion of overexertion injuries, but it also contributes to fall-related injuries. In a video analysis of drywall lifting techniques, Pan and Chiou (1999a) documented considerable biomechanical stresses incurred during drywall lifting [Pan CS and Chiou SS 1999a]. It is of note that these researchers considered drywall sheets of weights of 60, 80 and 100 pounds; drywall sheets of over 150 pounds are used on residential and
14
Research of worker characteristics associated with work-related injury among drywall installers is sparse but suggests patterns of injury by worker characteristics may vary by mechanism of injury. In a study of union drywall carpenters in Washington State from 1989 through 1995 [Lipscomb HJ, et al. 2000], struck-by injury rates decreased with increasing age and time in the union. Overexertion injuries were higher among workers in the latter years of their apprenticeship. Finally, the rate of falls increased with increasing age, a finding in contrast to that observed among construction industry workers overall [Shishlov KS, et al. 2010].
In the US, the size of drywall sheets has increased over time from 4-by-8 feet to 4-by-16 feet over the time period of this study. Larger sheets provide the advantage of potentially reducing the amount of taping, sanding and finishing work that needs to be performed (often by painters, not drywall installers). It is unclear how the change in sheet size has changed work patterns over time among installers. The heavier loads could increase their rate of injury if they are handling drywall sheets on their own. Such increased loads could also require a worker to use an assistive device or recruit assistance from co-workers if the larger size cannot be feasibly handled by one worker alone, thus distributing the load across more than one worker.
Summary of research needs
15
16
Figure 2.1. W Drywall ha Asse Asce Meas Lift d Carry Positi Carry Meas Apply Lift d Lift/ca Secu Secu a May rem b If attachin c Overhead
Work activities an anging activities
mble scaffold and nd scaffold/stilts sure for openings rywall to be cut a y drywall to be cu ion drywall to be y drywall to upper sure and cut dryw y glue to ceiling jo rywall to scaffold arry/hold drywall ure edges with dry
re sheets with dry
move temporary stai ng drywall sheets t d, if attaching dryw
nd common drywa
d tools at site s
at ground level ut at ground level
cut at ground lev r levela
wall oistsb
ing or ladderb to positionc ywall nails ywall screws
ir railings to facilitat o the ceiling all sheets to the ce
all lifting methods
el
te sheet size
eiling
s among drywall in
17 CHAPTER 3
RESEARCH DESIGN AND METHODS
Rationale and Overview
The goal of this study was to enhance the understanding of work-related injuries among construction industry workers involved in drywall installation. Using a combination of injury measures and epidemiologic techniques, this study addresses research needs specific to drywall installers’ occupational safety and health and overcomes some of the limitations of prior studies. The research addresses some specific goals set forth by NORA’s Construction Sector Council [NORA Construction Sector Council 2008], including the reduction of injuries associated with falls (Strategic Goal 1.0) and struck-by hazards (Strategic Goal 3.0), as well as to reduce the
incidence and severity of work-related musculoskeletal disorders among construction workers (Strategic Goal 7.0). It also addressed NORA’s call for research based on more detailed information than provided in national surveillance systems.
18
care covered through private health insurance was examined over time to inform the
understanding of potential care shifting between the WC and private health insurance systems.
Analyses of the surveillance data were supplemented with qualitative data gathered through interviews with substantive experts. Informed in part through direct observation of drywall workers on site, qualitative interview data provided information on the context from which the injury data arose. Interviews also provide an opportunity to share rate-based results with workers in the trade, including drywall workers, union local business agents, contractors and apprenticeship school trainers, thus supporting the NIOSH Research to Practice initiative [NORA Construction Sector Council 2008]. Despite the relatively routine nature of job tasks performed by drywall installers, understanding task-related exposures is problematic for these workers since they tend to work in small groups on frequently-changing worksites. Our current understanding of biomechanical stresses involved in lifting drywall sheets come from the laboratory setting [Pan CS and Chiou SS 1999a]. While informative, such data may not accurately reflect real-world work situations, in part through its failure to capture currently-used drywall sheets of 4-by-12 and 4-by-16 feet, how work is divided among workers, assistive devices that are used to aid in task completion, and organizational demands, such as working under time constraints. Thus, the interviews were designed to provide an understanding of drywall installers’ work practices and how such practices have changed over time.
19 Data Sources
Source cohort of members of the United Brotherhood of Carpenters and Joiners of Western Washington, 1989 - 2008
The main source of existing data for the analyses was a historical cohort of 26,591 carpenters who were members of the United Brotherhood of Carpenters and Joiners of Western Washington, a union in Washington State, between January 1, 1989 and December 31, 2008. This dynamic cohort was initially assembled in 1993 and has been updated on three occasions by researchers in the Division of Occupational and Environmental Medicine at Duke University Medical Center in Durham, North Carolina. The research team has been assisted over the years by the Safety and Health Assessment and Research Program (SHARP) at the Washington State Department of Labor and Industries in collaboration with the Carpenters Trusts of Western Washington (CTWW).
The source cohort was comprehensive in nature, not only in its 20-year time span but also in its available sources of data which include a union eligibility file, a union membership file, WC claims, and health care data for work-related and non-work-related conditions. Each of these elements is described in more detail below. Cohort data were linked at the individual-level and contain blind identifiers, assigned originally by the CTWW, for analyses. Each data source contained data from January 1, 1989 through December 31, 2008.
20
(Workers are allowed to save up hours to cover future times in which they may not be able to work, such as when there is not an adequate amount of available work, or when they are out due to disability or sickness [Lipscomb HJ, et al. 2009b].) The source cohort was restricted to individuals who worked at least three months of union hours.
Washington State union membership file: These data were also provided by the CTWW. Data available for each union member included: date of birth, gender, date of union initiation and union local affiliation.
Workers’ compensation claims file: These data were provided by the
Washington State Department of Labor and Industries and included information on work-related injuries and illnesses for which a WC claim was filed: injury date, total days lost from work, costs (for wage replacement, health care, impairment), body part affected, nature of the injury, type of event or exposure causing the injury, and source of the injury. These last 4 variables utilized an ANSI-based coding scheme from 1989 through June 2005 and an Occupational Injury and Illness Classification System (OIICS) coding scheme for July 2005 through 2008. In Washington State, an injured worker receives lost time payment after (s)he misses three days of work for the injury. Some of the WC claims were from companies that self-insure for WC coverage; these claims are only coded (ANSI/OIICS) in the Washington State Department of Labor and Industries system if they resulted in paid lost time away from work.
21
Work-related medical care files: These data were also provided by the
Washington State Department of Labor and Industries. They capture outpatient and hospital care received for work-related injuries captured in the WC claims data file. Data include diagnoses coded using International Classification of Disease, 9th revision (ICD-9) codes, procedures coded using CPT codes, provider specialty, place of treatment and associated costs. Medical care claims were not consistently available for injuries to workers with self-insured employers unless the injury resulted in paid lost time.
Non-work-related medical care (covered through union-provided health insurance): These data were provided by the CTWW. Data elements were similar to those contained in the work-related medical care file.
Direct observation of construction site drywall work
Three site visits were made to commercial construction work sites in Washington State to directly observe drywall carpenters at work and contextualized the research. Identification of sites and coordination of visits were made possible through a business agent from the union local specializing in drywall installation. Field notes were hand-written to document what was
22
Key informant interviews
Key informant interviews with five substantive experts in Washington State were
conducted to gather information on industry- and trade-specific trends over time and work-related exposures, thus providing a context from which the injury rate data arose. Potential participants with a comprehensive understanding of work practices over time were asked to participate voluntarily as part of the site visits. As such, the participants were an informed convenience sample. The interviewees had a range of experience from 20 to more than 40 years in the trade, and they included former drywall installers currently serving in supervisory, job assignment or training roles. Interview participation was designed to be anonymous to the best extent possible. No efforts were made to link participants to workers in the cohort data. There was no interest in asking workers directly about personal injury experiences or in collecting any personal identifiers.
Interviews followed primarily a structured guide (Appendix) but were guided in part through the Washington State construction site visits. Questions addressed drywall installation work exposures, task and safety training, perceived work risks, injury prevention approaches, injury experiences (including reporting, health care seeking behavior and return-to-work), and management support. Of particular interest was gathering information on changes in work practices over time. Notably, the interviews included sharing results of the rate-based findings with drywall carpenters, supporting the NIOSH Research to Practice initiative to share and translate research findings, as highlighted by the NORA Construction Sector Council [NORA Construction Sector Council 2008].
Outcomes
23
contributing factor. Additional analyses further restricted work-related injuries to those affecting the back and resulting from overexertion. These injuries were considered to provide a
comparable comparison to health care utilization for diagnoses of musculoskeletal conditions of the back as covered by union-provided health insurance. A description of each of these outcomes is provided below:
Work-related injury
All injuries and illnesses captured in the WC claims data during a month in which a worker contributed time at risk (i.e. > 0 union hours worked that month) were considered. Individual workers were allowed to contribute more than one injury per month. Defined using ANSI/OIICS codes, injury details include body part or site affected, nature of the injury, event or exposure preceding the injury and primary/secondary sources involved in the injury.
The WC claims contain, as described by the Washington State Department of Labor and Industries, “injuries” and “illnesses” – terms typically used to describe adverse outcomes of an acute or chronic nature, respectively. In this study, we refer to all of these outcomes as “injuries.” Work activities can contribute to acute injuries at a point in time as well as disorders (illnesses) from cumulative exposure to lesser loads over a period of time. However, this distinction lacks clarity. For example, a worker may experience an overexertion injury attributed in part to a peak exposure after years of cumulative trauma, or a worker may develop a chronic condition (illness) following an acute injury event. Both types of scenarios could end up as a reported and accepted claim in the WC data used in this study, given the condition was determined to be work-related.
Work-related injury with paid day(s) away from work
24
missing three days of work as a result of the injury. For cases not yet closed, the most currently available data were used. Individual workers were allowed to contribute more than one work-related injury with paid day(s) away from work per month.
Work-related injury related to drywall material
This outcome was defined as a work-related injury (defined above) in which drywall material was identified as a contributing factor in the injury event. Such contribution of drywall material was defined based on available ANSI/OIICS primary and secondary source code information as well as an analysis of injury event narratives. Individual workers were allowed to contribute more than one work-related injury related to drywall material per month. A more detailed description of the definition of this outcome is provided in this Chapter’s “Narrative text analyses” as well as in Chapter 4.
Some analyses of the outcomes mentioned thus far were restricted to work-related injuries (overall or with paid lost time) within specific mechanisms of injury, notably falls from elevation, falls on the same level, overexertion/bodily reaction and struck by/against, defined using ANSI/OIICS codes assigned to the injury.
Work-related overexertion back injuries
25
Health care utilization for musculoskeletal back diagnosis
Health care utilization for diagnoses of musculoskeletal conditions of the back was based on the primary ICD-9 diagnosis code assigned to each claim. In the health care records, several claim lines can exist for any given diagnosis. For the proposed analyses, utilization was defined in a way that allowed, for each carpenter, one visit per provider per day. Only claims which occurred during a month in which the carpenter was eligible for insurance (regardless of whether hours were worked) were examined. There was no upper limit on the number of visits per month for a given worker. A more detailed description of the definition of this outcome is provided in Chapter 6.
Time at risk
For analyses of outcomes of work-related injuries, individual worker-hours as a union carpenter were used as the measure of time at risk for an injury. All hours worked during a given month were considered time at risk for any injury occurring during that month. For analyses of health care utilization for musculoskeletal back diagnoses, time at risk was defined as worker-months of insurance eligibility.
Explanatory variables
26
Predominant type of work performed
In this cohort of Washington State union carpenters, the union local is the unit to which predominant type of work performed was assigned. Each local was assigned by an industrial hygienist to one of several categories based on the predominant type of work the local’s
members perform. Type of work categories include drywall, heavy commercial, light commercial, millwrighting, piledriving, cabinet/fixture work and residential. The predominant type of work performed by a given local was allowed to change over time. For analyses, this variable was dichotomized by whether the assigned predominant type of work performed by the local was drywall carpentry (yes, no). In Washington State, carpenters who do drywall installation work must lift, carry, hold and install drywall on residential and commercial work sites. Their work does not include drywall finishing tasks, such as taping or sanding. All analyses were stratified initially by predominant type of work.
Calendar time
An emphasis of this research was the examination of outcomes (previously described) over time. This variable was categorized as calendar years (e.g., 1989, 1990, 1991) for most analyses. Calendar years were grouped for some analyses (e.g., 1989-1992, 1993-1996).
Gender
27 Age
Carpenters in the source cohort covered a wide range of ages (17 to 76 years, mean 35 years). Age was provided in its continuous form in the cohort data and categorized for analyses involving the calculation of injury rates and rate ratios. Age was treated as a time-varying variable, with time at risk accumulating in the appropriate age strata for workers. Age was missing for 586 (2.4%) members of the source cohort.
Time in the union
Carpenters who have little or no experience prior to their entry into a Washington State carpenters’ union are considered “apprentices.” An apprentice must receive standard three to four years of classroom and on-the-job training to receive “journeyman” status. Although not a direct measure of these distinct stages of a carpenter’s career (e.g., a carpenter may enter the union with or without carpentry experience), time in the union was categorized in a way that acknowledged these stages in order to make meaningful comparisons between them. It was treated as a time-varying variable, with time at risk accumulating in the appropriate strata over the study period.
Statistical approach
Description of the dynamic study cohort
28
worker-hours at risk and months of eligibility for union-provided health insurance were calculated overall and by year, age, gender and time in the union, stratified by predominant type of work.
Calculation of work-related injury rates
Using the number of union worker-hours as the time at risk (denominator) and a particular work-related injury outcome (e.g., overall, paid lost time, mechanism-specific) as the numerator, crude incidence rates, rate ratios and 95% confidence intervals (CI) of work-related injury were calculated assuming a Poisson distribution. Poisson regression models, which can incorporate both the time at risk contributed by each subject and changes in covariate values over time [Checkoway H, et al. 1989], have been used in previous analyses of this cohort, and they have provided a suitable fit to the data. Stratified by the predominant type of work performed (drywall installation versus other type of carpentry), injury rates and injury rate ratios were calculated over calendar time, as well as by injury and worker characteristics. As is common in literature of work-related injuries among construction workers, rates were expressed as the number of injuries per 200,000 worker-hours.
The general form of the Poisson model used for modeling injury rates is:
ln (Number of events / Time at risk) = β0 + β1X1 + . . . + βjXj,
where β0 is the natural log of the rate in the group with all exposure variables at their
referent level, and X1 through Xj denote exposure variables (or groups of exposure variables, e.g.,
29 This model can also be expressed as:
ln (Number of events) = ln (Time at risk) + β0 + β1X1 + . . . + βjXj,
where ln (Time at risk) is the “offset.” In the modeling of work-related injury outcome rates, the time at risk was measured in worker-hours.
Examination of rates of injury over time in which drywall material was a contributing factor
Sheets of drywall have increased in size and weight over the study time period. We assumed such changes could affect rates of injury in which drywall material was a contributing factor without having any effect on rates of injury in which drywall material was not a contributing factor. In contrast, we assumed there were also changes over time (e.g., reporting criteria) that would affect all injuries, regardless of whether drywall material was a contributing factor in the injury event. In analyses examining trends over time in the rate of injuries in which drywall material was a contributing factor, it was of interest to control for any changes over the 20-year time period that would affect all work-related injuries.
Poisson models were constructed separately for each of the three common mechanisms of injury (i.e., struck by/against, overexertion, falls):
ln (Rate of drywall material-related injuries / Rate of injuries not related to drywall material) = β0 + βiXi,
where βi and Xi represent coefficients and values of indicator variables for calendar time,
30
rather than the value of this ratio itself. In the absence of a change that would affect drywall material-related injuries only (e.g., increasing drywall sheet size, weight) or injuries related to other sources only, this ratio of the rate of drywall material-related injuries to the rate of injuries resulting from other sources was assumed to be constant over time. The offset for the model was specified as the natural log of the product of worker-hours times the rate of injuries not related to drywall material, or simply the natural log of the number of injuries not related to drywall material, as the identical values of worker-hours cancel out [Breslow and Day 1987].
Calculation of health care utilization rates
Rates, rate ratios and 95% CIs of private health care utilization for musculoskeletal back conditions were estimated using negative binomial regression models, with worker-months of insurance eligibility as the time at risk. The general form of the negative binomial regression model used for modeling injury rates is similar to that of the Poisson regression model, with the addition of a parameter to relax the assumption of the standard Poisson regression model that the variance is equal to the mean. These models are particularly useful in working with rate data that are over-dispersed, as they provide (larger) standard errors to reflect this additional variation. Generalized estimating equations (GEE) were used to account for correlation within subjects [Liang KY and Zeger SL 1986]. The exchangeable correlation matrix, which assumes the average within worker correlation is the same, was chosen to adjust the model for the repeated measurements per worker.
As anticipated based on previous analyses of health care utilization data from this cohort [Lipscomb HJ, et al. 2009b], this approach was appropriate given the data were skewed due to a large proportion of the study cohort who never sought care and multiple claims existed for
31
Examination of rates of health care utilization for a musculoskeletal back diagnosis by the number of and time since a work-related overexertion back injury
As part of the examination of the relationship between rates of musculoskeletal outcomes captured in union-provided private health insurance claims data to those captured in WC claims over time among drywall carpenters, rates of private health care utilization were examined by the number of work-related overexertion back injuries and time since a work-related overexertion back injury.
Previous analyses of union carpenters in Washington State highlighted a dramatic decline in health care utilization and costs for musculoskeletal back disorders from 1993 to 1995 [Lipscomb HJ, et al. 2009a, Lipscomb HJ, et al. 2009b] – a pattern which likely reflects
Washington State’s implementation of the Medicare resource-based relative value scale
(RBRVS) system as part of an effort to control health care costs [Kominski GF, et al. 1999]. We restricted these analyses to 1995 and later to capture only the period of time after the RBRVS was fully implemented.
Multivariate regression modeling
After the calculation of crude overall and stratified injury outcome rates and rate ratios, analyses focused on the calculation of adjusted rate ratios and 95% confidence intervals [Nizim A 2000]. Initial multivariate models examining patterns of work-related injury or health care
32
Previous research based on the full cohort of union carpenters from which our study cohort was derived suggests patterns in injury rates over calendar time varied across categories of worker age and time in the union, with younger workers and workers with fewer years in the union exhibiting more marked reductions in rates of work-related injury over time [McCoy AJ, et al. In press]. These findings were supported in the study cohort of drywall carpenters as well. However, when the data were stratified by injury mechanism, or focused on outcomes of (a) work-related injury with paid lost time or (b) work-related injury in which drywall material was a contributing factor, many of the models including calendar time as an effect measure modifier did not converge. The decision was made to not include calendar time in multivariate regression models. Calendar time was not suspected to be either an effect measure modifier or confounder of the relationship between gender and work-related injury.
Each model’s goodness of fit was assessed comparing the models’ Pearson’s chi-square to its degrees of freedom. For models with a value of Pearson’s chi-square divided by degrees of freedom of <0.67 or >1.5, the standard errors were scaled to correct the under-dispersion or over-dispersion, respectively.
Analyses were performed in SAS version 9.1.3 [SAS Institute Inc. 2002-2004]. For assessment of collinearity among explanatory variables, the HESSWGT= option in PROC GENMOD was used to compute values for diagonals of a weight matrix to inform a weighted regression and assessment of the condition of the information matrix using PROC REG. Poisson and negative binomial regression models were performed in PROC GENMOD, specifying link=log and appropriate distribution (i.e., Poisson, negative binomial). The CLASS statement was used to incorporate indicator variables for the explanatory variables of interest. Scaling of the standard errors used the PSCALE option. For generalized estimating equations, the REPEATED
33
Narrative text analyses
To identify injuries in which drywall material was suspected to be a contributing factor, a manual review and keyword search of text descriptions of drywall carpenters’ injuries available in the WC claims data was performed. First, we sought to confirm ANSI/OIICS-code-defined drywall material-related injuries. This goal employed a manual review of injury text descriptions. Only those descriptions which strongly suggested a separate source of injury were considered not related to drywall material. Then, we identified injuries related to drywall that were not captured based on ANSI/OIICS source codes. Injury text descriptions were searched for keywords such as “sheetrock,” “sheet rock,” and “drywall.” The list of words used in the search was based on commonly-used words in the text descriptions of injuries already identified and confirmed as drywall material-related based on ANSI/OIICS source codes. Injuries were flagged as potentially having drywall material as a contributing source if they contained one or more of the keywords. A manual review of all flagged injuries was performed to confirm whether drywall material was a contributing source based on the full injury narrative.
34
characteristics of and circumstances surrounding these work-related injuries. ANSI/OIICS codes assigned to the claims were compared to information gathered through the injury narratives.
Categorization of injuries by whether drywall material was a contributing source was performed in SAS version 9.1.3. For the coding of further injury event details, data extraction forms and linked data management tables were created in Microsoft Access [Microsoft Corporation] for each injury mechanism analyzed. Coded data were then imported in SAS version 9.1.3 [SAS Institute Inc. 2002-2004] for generation of descriptive statistics.
Site visits
Analyses of hand-written field notes from the three construction site visits were performed with the goal of contextualizing the research. Notes were reviewed and typed into a word
processor following each observation day, providing a time for additional reflection and recall. This process allowed us to highlight and group common comments in the field notes, and it assisted in refinement of the key informant interview guides.
Key informant interviews
Analyses of key informant interview data were also conducted with the goal of contextualizing the results based on quantitative data. Written notes from key informant
35
nodes not specified directly in the key informant interview guides were developed as they arose during the analysis, given they provided insight into the context.
36 CHAPTER 4
WORK-RELATED INJURIES AMONG UNION DRYWALL CARPENTERS IN WASHINGTON STATE, 1989-2008
Overview
Drywall installers are at high risk of work-related injury. From an epidemiologic perspective, these workers are challenging to study. We identified worker-hours and workers’ compensation claims for a 20-year (1989-2008) cohort of 24,830 Washington State union carpenters. Work-related injury rates were examined over time and by worker characteristics, stratified by type of work (drywall installation, other carpentry). Drywall installers’ overall rate of work-related injury, 33.1/200,000 worker-hours, was nearly 20% higher than that of other
carpenters. Drywall material contributed in one-fifth of injury events. Common mechanisms were struck by/against, overexertion and falls. Declines in work-related injury rates were observed over time. When controlling for trends affecting all injuries, the rate of overexertion injuries in which drywall material was a contributing factor declined over time. In contrast, the rate of struck by/against injuries in which drywall material was a contributing factor increased. In this 20-year cohort, drywall installers’ work-related injury rates exceeded those of other carpenters. Drywall material contributed to a substantial proportion of injury events. Patterns of risk over time varied by common injury mechanisms.
Introduction
37
between two layers of paper, drywall now holds nearly the entire market share for interior finishing materials in North America [Ferguson MR 2002]. Drywall sheets were initially manufactured as 4’ wide, 8’ long and 3/8” thick, but a variety of sizes and types exist today. Standard sheet lengths of 8’, 10’, 12’ and 16’ and thicknesses of 3/8”, 1/2” and 5/8” are available, some with a lighter-weight counterpart. Materials resistant to dents, mold and sound provide additional building options. Larger sheet dimensions reflect the desire to minimize finishing time, in keeping with building design trends. For example, when the number of homes built with 9’ ceilings increased in the 1990s, 4.5’ wide sheets became available to avoid two horizontal seams on walls.
Drywall installers have high rates of work-related injury relative to their construction counterparts [Chiou SS, et al. 1997, Lipscomb HJ, et al. 2000], and their injury incidence is typically attributed to the lifting, carrying and cutting of large sheets of drywall and fastening them in place [Chiou SS, et al. 1997, Chiou SS, et al. 2000, Dement JM and Lipscomb H 1999,
Lipscomb HJ, et al. 2003a, Lipscomb HJ, et al. 2000].
38
survey of perceived hazards during drywall installation, ceiling installation work was rated by drywall hangers as the most hazardous task in terms of physical stress, potential for falling and being struck by/against an object [Pan CS, et al. 1999b].
Despite the widespread use of drywall in modern construction, comprehensive descriptive epidemiology of the injuries associated with drywall installation is lacking. In
particular, there remains a gap in the understanding of drywall installers’ injury experiences over time when known changes in the industry have occurred. Using data from a well-defined retrospective cohort of union carpenters in Washington State, the purpose of this study was to describe the work-related injury experience among construction industry workers engaged in drywall installation over a 20-year period, from 1989 through 2008, with an emphasis on identifying injury patterns over time and high-risk subgroups of workers.
Methods
Cohort data