Paige E Ottmar. Overloaded in the ICU: Measuring Information Overload in Critical Care Physicians at UNC Hospital. A Master’s Paper for the M.S. in I.S degree. April, 2019. 108 pages. Advisor: Saif Khairat, PhD, FAMIA
This study describes a questionnaire and simulation study of physicians working in the Intensive Care Unit at University of North Carolina Health Care. The questionnaires were employed to determine physicians’ overall perceived feelings of information overload, satisfaction, and usability of Electronic Health Records, as well as to determine if differences exist between groups. The simulation study was conducted to determine physiological signs of information overload and its effect on task performance.
Twenty-five physicians completed the questionnaires and the simulation study. Overall, physicians reported high levels of perceived information overload, with males reporting significantly higher overload than females. Additionally, pupillometry data suggested that almost all physicians experienced information overload at least once during the
simulation study. Though information overload did not affect accuracy, results suggest that it made physicians significantly less efficient. Future studies are needed on the gap between subjective and objective measures of information overload.
Headings:
Health care – Information overload
Information overload – Electronic Health Records Electronic health records – Management
OVERLOADED IN THE ICU: MEASURING INFORMATION OVERLOAD IN CRITICAL CARE PHYSICIANS AT UNC HOSPITAL
by Paige E Ottmar
A Master’s paper submitted to the faculty of the School of Information and Library Science of the University of North Carolina at Chapel Hill
in partial fulfillment of the requirements for the degree of Master of Science in
Information Science.
Chapel Hill, North Carolina April 2019
Approved by
Table of Contents
Chapter 1: Introduction ... 3
1.1 Chapter Overview ... 3
1.2 Overview of Electronic Health Records... 3
1.3 Cognitive Load Theory ... 5
1.4 Studies on EHR and Information Overload ... 8
1.5 Master’s Paper Overview ... 9
Chapter 2: Literature Review ... 12
2.1 Chapter Overview ... 12
2.2 Identification of Literature ... 12
2.3 Definitions of Information Overload... 13
2.4 Symptoms of Information Overload ... 18
2.5 Measurement of Information Overload ... 19
2.6 Reasons behind Information Overload ... 23
2.7 Electronic Health Records ... 30
2.8 Results of EHR Information Overload ... 36
2.9 Current State ... 39
2.10 Paper Objectives ... 41
Chapter 3: Methods ... 42
3.1 Chapter Overview ... 42
3.2 Data Collection ... 42
3.3 Potential Data Quality Issues ... 48
3.4 Data Analysis ... 48
3.5 Implications and Impacts ... 51
Chapter 4: Results ... 51
4.1 Chapter Overview ... 52
4.2 Participant Overview ... 52
4.3 Subjective Measures ... 53
4.4 Objective Measures ... 65
Chapter 4: Discussion ... 76
4.5 Chapter Overview ... 76
4.7 Suggestions for Reducing Information Overload... 83
4.8 Study Limitations ... 85
4.9 Chapter Conclusion ... 86
Chapter 5: Conclusion and Future Work ... 87
1.1 Chapter Introduction ... 87
1.2 Conclusion ... 87
1.3 Suggestions for Future Research ... 88
1.4 Chapter Conclusion ... 89
Chapter 1: Introduction
1.1
Chapter Overview
This chapter introduces the master’s paper at hand, which is a quantitative analysis of critical care physicians’ information overload as a result of Electronic Health Records (EHR) use. The rest of this chapter will provide background information for the study, including an overview of EHRs, information overload, and gaps in current
literature. It will then move on to explain the current study’s objectives and primary research questions before briefly outlining upcoming chapters.
1.2
Overview of Electronic Health Records
Technology, 2018; Evans, 2016). This is likely due to the Health Information Technology for Economic and Clinical Health (HITECH) Act that was enacted in 2009, which
worked to incentivize the adoption and usage of EHR systems by providing additional payments to providers or hospitals for implementing EHR systems (Center for Disease Control and Prevention, 2017).
Overall, EHR systems have provided significant benefits to both patients and providers, with features such as clinical decision support, computerized patient order entry, and patient health information exchange (Menachemi & Collum, 2011). These tools have been linked to better quality indicators, lower mortality rates, and fewer patient complications (Menachemi & Collum, 2011).
1.2.1 Problems with EHR Systems
Despite these benefits, EHRs can be a significant source of frustration for physicians, as evidenced by the fact that EHR satisfaction scores have been steadily dropping. According to a study of physicians conducted by the Stanford University School of Medicine, 61% of respondents in 2010 said they were “very satisfied” or “satisfied” with their EHRs. However, this dropped to 34% in 2014, falling even further to 18% in 2018 (Lazdins, 2018).
In fact, EHR usage has been named one of the biggest contributors to physician burnout (Collier, 2017). Physicians complain about being overwhelmed by the sudden explosion in patient data—and they consider most of the data to be either information that isn’t useful for clinical decision-making (Bresnik, 2017). Lloyd Minor, dean of the
EHRs have transformed how health care is documented in the U.S., but for all the information we've now captured digitally, we are rarely wiser as a result. Insights that could lead to better patient care or new medical discoveries remain buried within piles of disconnected data (Bresnik, 2017).
1.2.2 EHRs and Information Overload
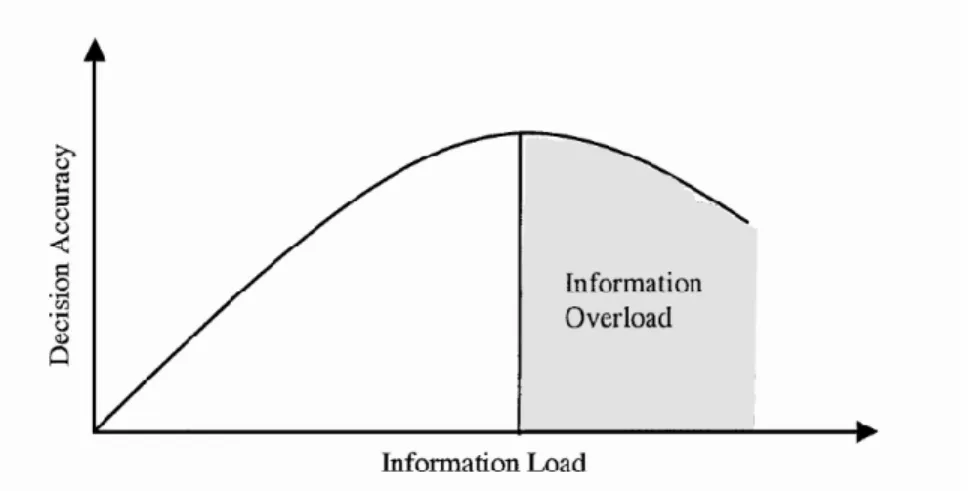
While physicians now have access to massive amounts of patient information, their abilities to process this information have remained constant (Harry et al., 2018). This can lead to information overload, where a user has literally received too much information (Eppler & Mengis, 2003). When this happens, the individual’s cognitive load—the total amount of mental activity imposed on working memory in any one instant—is at its maximum (Harry et al., 2018). Researchers have found that the performance of individuals—quantified as the quality and accuracy of decisions—
positively correlates with the amount of information an individual receives, but only up to a certain point. If further information is received, performance rapidly declines as one is unable to integrate the information into the decision-making process. This can lead to confusion and difficulty remembering prior information (Eppler & Mengis, 2003).
Research has suggested that this could be the case for physicians, as one study found that missed test results in a patient’s EHR may be due to information overload in primary care physicians (Singh, Spitzmueller, Peterson, Sawhney, & Sittig, 2013). Now that EHR systems have been almost universally adopted, attention now must be geared towards improving their usability by presenting data in a way that is clear, helpful, and intuitive (Bresnik, 2017).
1.3
Cognitive Load Theory
helpful for understanding information overload, as it outlines how humans filter, process, store, and retrieve information necessary for decision-making (Harry et al., 2018). Under this theory, users first gather new information through various means (seeing, reading, etc.) and store it in the long-term memory. When this memory needs to be retrieved (such as for diagnosing and providing clinical care), it is taken from the long-term memory and processed in the working memory. The physician is also simultaneously processing information from the environment (e.g. the patient) through working memory to aid in decision-making. A key insight from this is that information—both new and existing— must be processed through the working memory (Harry et al., 2018). According to cognitive load theory, working memory is an unlimited resource when dealing with existing information but limited when working with novel information. As a
consequence, when an individual is overloaded or distracted by unnecessary information, the ability to integrate new information or alter stored information becomes limited (Harry et al., 2018). This could have direct implications on physicians’ ability to learn, adapt, and provide adequate patient care.
1.3.1 Subcategories of Cognitive Load
where a surgeon must go to multiple locations to acquire the materials for a procedure, imposes unnecessary extraneous load.
When extraneous load increases, it demands more working memory, reducing physicians’ ability to absorb complex information, such as a patient interaction (Harry et al., 2018; O’Shea, 2016). This type of cognitive load is the greatest contributor to
information overload; however, it can be reduced through techniques such as
standardization and simplification to free up working memory for physicians and allow them to process more clinical information (Harry et al., 2018).
Finally, germane cognitive load is the load devoted to the processing and
construction of schemas. People construct new schemas in working memory that are then integrated into long-term memory. These schemas represent learning; they can be
retrieved, added to, and used for future problem solving. As medical expertise expands through clinical experience and training, schemas change so that tasks can be handled more efficiently. Cognitive load theory is ultimately about diverting cognitive processing power towards this germane cognitive load by reducing the other two, allowing a
physician to become a more efficient and effective learner over time (O’Shea, 2016). Since intrinsic cognitive load cannot readily be reduced, this study will focus on extrinsic cognitive load in physicians. According to cognitive load theory, reducing this should reduce their overall cognitive load and help to prevent information overload.
1.3.2 Split-Attention and Redundancy Effects
to acquire and synthesize the information necessary for a clinical encounter (Harry et al., 2018). Common examples of this are when physicians must access multiple parts or pages of a single EHR, which requires extensive scrolling and clicking through multiple pages. The second contributor is the redundancy effect, when the same information is presented in multiple ways (Harry et al., 2018). Physicians frequently receive
notifications of the same information repeatedly in the name of patient safety by
providing multiple checkpoints. Though well-intentioned, these notifications increase the amount of extraneous “noise” for physicians, making it difficult for them to process other data while interrupting their work flow. The argument that patient safety necessitates these multiple notifications does not consider the impact of these notifications on other critical data pieces the physician is trying to process (Harry et al., 2018).
1.4
Studies on EHR and Information Overload
similar to emergency and primary care providers (Chuang, Tseng, Lin, Lin, & Chen, 2016). As it is suggested that burnout itself can be detrimental to patient safety (Chuang et al., 2016), this physician population needs additional studies.
1.5
Master’s Paper Overview
With this background on information overload, the rest of this chapter will describe the objectives and research questions guiding this master’s paper. Methods will be briefly discussed in this section, but one should refer to Chapter 3 for more detailed information on the methods of data collection and analysis.
1.5.1 Objectives and Research Questions
For this paper, the first objective is to determine whether information overload is occurring among critical care physicians at UNC Hospital. The second objective is to study whether information overload is related to physician demographics, such as age, gender, the number of hours a week they interact with an EHR system, number of years they’ve used the EHR system, and their position at UNC Hospital (resident, fellow, or attending). Another objective is to correlate subjective measures of information overload with objective measures, as demonstrated by performance and physiological data
captured during simulated patient cases. Finally, these data points will be synthesized to determine recommendations that could decrease the likelihood of these physicians experiencing information overload.
R2: What is the relationship between subjective and objective measures of information overload?
R3: What recommendations can be made to decrease the likelihood of physicians experiencing information overload?
1.5.2 Methods Overview
In order to accomplish this, data was used from a 2018 study of 25 critical care physicians who primarily work in the ICU of UNC Hospital. This study was approved by the University of North Carolina at Chapel Hill Institutional Review Board. Subjective measures of information and cognitive load were measured through the NASA Task Load Index (NASA-TLX), the Questionnaire for User Interface Satisfaction (QUIS), and the System Usability Scale (SUS). These scales are often used in tandem as a subjective workload assessment tool that allows researchers to perform assessments on users across a wide range of applications on various subscales, including mental demand, satisfaction, and usability (Whitfield, 2003).
For the objective measures, performance and physiological data generated from simulated patient cases was used. Four test medical records of fictional yet realistic patient cases were created by a content expert, and physicians wore eye-tracking
information overload in critical care physicians and make recommendations that could reduce extrinsic load and therefore the likelihood of experiencing information overload.
1.5.3 Outline of Master’s Paper
Chapter 2: Literature Review
2.1
Chapter Overview
This literature review chapter expounds upon the concept of information overload and how it relates to physicians using EHR systems. The first part of this literature review focuses on the definitions of information overload and how it has evolved over time in domains outside of healthcare. After the concept of information overload has been solidified, the symptoms and causes of information overload are discussed, as well as how information overload has been measured. The focus then shifts to information overload in the healthcare setting before centering on EHR systems, including causes of information overload and its potential implications for both physicians and patients.
As was mentioned in the previous chapter and will be elaborated upon in this literature review, there is a paucity of research on the contribution of EHR systems to information overload. The research that has been conducted does not focus on critical care physicians working in the ICU. This literature review will conclude with specifying current gaps in the literature and clarifying how this proposed study fits into this space.
2.2
Identification of Literature
The two main techniques for identifying relevant literature for this literature review were backward chaining and citation searching. First, a Google Scholar search for “information overload literature review” was used in order to find an appropriate
additional resources and original research studying information overload in domains outside of healthcare, primarily marketing, accounting, and information systems. This technique was used primarily for researching definitions, causes, and symptoms of information overload.
After completing the backward-chaining technique, citation searching as also identified by Bates (1989) was used to find studies focusing on information overload in healthcare organizations that cited the Eppler & Mengis (2003) literature review. This was used primarily for focusing on information overload for physicians. However, there were no studies on information overload and EHR usage that cited this study. Because of this, an additional PubMed search of “EHR and information overload” was used to find research of information overload in the context of these systems. From this, the Koopman et al. (2015) study on physician information needs and the EHR was identified and used as a jumping-off point for an additional citation search for studies related to information and physician usage of EHR. These studies will be heavily referenced in the following sections of this chapter.
2.3
Definitions of Information Overload
In everyday language, information overload is the state of having received too much information (Eppler & Mengis, 2003). Within the research community, information overload is often synonymous with cognitive overload, sensory overload, and
communication overload, though for the purpose of this literature review, the term “information overload” will be used exclusively. The focus of the research on
amount of information an individual receives up to a certain point. If further information is received beyond this tipping point and their cognitive load reaches its maximum, performance degrades, forming an inverted U-shape (see Figure 1). It is hypothesized that this is because the individual is unable to integrate this information into the decision-making process. This can often lead to confusion, stress, and difficulty remembering prior information (Eppler & Mengis, 2003). Further elaboration on the definitions of information overload will be discussed in the following sections.
Figure 1: The information overload inverted U-curve (Eppler & Mengis, 2003)
2.3.1 Classic Definition of Information Overload
time. However, at both an individual and an organizational level, interventions can be implemented to either reduce the amount of information that is being processed or increase information-processing ability (Gailman, 1974). Information-processing
requirements vary by situation, as Tushman and Nadler state that information-processing requirements are directly related to the amount of uncertainty faced (the difference between the amount of information needed to complete a task and the amount of information the individual has) (1978). There are multiple dimensions that affect task uncertainty, which are expounded upon below.
2.3.1.1 Dimensions of Task Uncertainty
Three major dimensions affect uncertainty: task complexity, environment
characteristics, and task interdependence (Tushman & Nadler, 1978). Galbraith suggests that various tasks can differ in their level of complexity, which likely leads to differences in predictability and therefore varying levels of uncertainty (1974). For example, tasks that are routine are less uncertain and individuals generally have a script or mental schema as to how these tasks are completed. This then requires less information processing capacity than tasks that are less familiar.
The third dimension of uncertainty is the task environment (Tushman & Nadler, 1978). While there are many potential dimensions that can affect the environment, Duncan found that the stability or dynamicity of the environment (in terms of how it is perceived by the individual) is a major determinant of environment uncertainty (1972). This dimension is broken into two separate subdimensions: the degree to which change occurs and the frequency of these changes. The more dynamic the environment is and the more often it changes, the greater the uncertainty (Duncan, 1972). This is likely because stable environments set expectations for what will occur and therefore standard
procedures can be implemented. But if an environment changes rapidly, these procedures are less likely to be effective (Tushman & Nadler, 1978). For example, a hospital unit that continually changes procedures and equipment to keep up-to-date with the current medical literature and advances is more dynamic than a supply-chain unit in a large organization that has been operating under the same standard operation procedures for the past decade. Because of this, the hospital unit likely faces greater uncertainty and the employees could be more susceptible to information overload.
2.3.2 Evolved Definitions of Information Overload
will be at a lower risk of information overload. A different definition of information overload was put forth by Keller and Staelin (1987). Similar to the classic definition put forth by Galbraith in 1974, this definition is different from previous iterations because they determined that not only is the amount of information crucial to information overload, but the characteristics of the information itself plays a role.
Their conceptual model stated that increasing the quantity of information
increases decision effectiveness, but only up to a certain point. After this point is reached, increasing the quantity of information while holding quality constant generally decreases decision effectiveness. On the other hand, increasing the quality of information while holding quantity constant generally increases decision effectiveness. Therefore, Keller and Staelin state that decision effectiveness is a function of both quantity and average quality of information provided (1987). This is the first definition of information overload that includes both qualitative and quantitative dimensions. Schneider (1987) builds upon this conceptual model to include various information attributes as dimensions of quality, such as the level of novelty, ambiguity, uncertainty, intensity, and complexity. These characteristics can either contribute to overload or reduce it, depending on how they are utilized and integrated. Currently the Schneider (1987) definition of information overload is most-used in the field of information science, and for that reason it will be used for the rest of this literature review and subsequent master’s paper.
information, but the quality of the information being input into the EHR needs to be high. Though definitions of information overload may have changed over time, its symptoms have generally remained unchanged. The next section of this literature review will focus on the effects of information overload.
2.4
Symptoms of Information Overload
Research suggests that information overload can have a significant effect on both mental and physical health. For one, information overload has been found to lead to cognitive strain and stress (Ruff, 2002). In one workplace survey, 25% of employees said they experienced significant stress due to the volume of information in their office. Additionally, psychologist David Lewis has stated that information overload can lead to Information Fatigue Syndrome (IFS), a term he coined for the mental and physical maladies that can be due to information overload in the workplace (Lewis, 1996). This includes symptoms such as depression, poor concentration, and burn out (Lewis, 1996).
Beyond the mental and physical symptoms, information overload can lead to lower levels of performance in the workplace, likely due to its impact on decision-making quality. Information overload has found to lead to greater tolerance of error in the
decision-making process, the inability to use information to decide, inefficiencies in decision-making, and greater difficulties in identifying and selecting relevant information (Ruff, 2002). Overall, there is wide consensus that information overload leads to
predictions were also less accurate (Chan, 2001). Researchers hypothesize this is because the person omits important data due to the overload of short-term memory (Lewis, 1996). Information overload also interferes with learning and creative problem solving, likely because the high extrinsic cognitive load prevents adequate germane cognitive load. In one study, having access to too much information prevented venture capitalists from making accurate adjustments to their evaluation process, which in turn impeded learning (Zackaruis & Meyer, 2000). These symptoms of information overload have been reported across different types of studies that measured information overload in different ways. These methods will be elaborated upon in the next section.
2.5
Measurement of Information Overload
Just like there are multiple definitions of information overload, there are many approaches as to its measurement. In reviewing the literature, it appears that the
measurement of information is generally context-specific in that measures are dependent upon the topic domain and the information being presented (Akorfu, 2013; Eppler & Mengis, 2003). However, there have been three major avenues for measurement: subjective measures, physiological measures, and performance-based measures (Rubio, Diax, Martin, & Puente, 2004; Eppler & Mengis, 2003). These three paths will be elaborated upon below.
2.5.1 Surveys and Questionnaires
(Rubio et al., 2004). Surveys often focus on either cognitive load or the presence of information overload symptoms. The first rating scale measure of cognitive load was introduced in the early 1990s by Fred Paas who created a mental effort rating scale (Sweller, 2018). This continues to be one of the most popular measures of cognitive load. Another popular tool is the NASA task load index (NASA-TLX), a tool that measures a user’s subjective mental workload across six dimensions (mental demand, physical demand, temporal demand, performance, effort, and frustration) (NASA, 2006). A final tool that is often used is the Subjective Workload Assessment Technique (SWAT) that focuses on mental effort load, psychological stress, and time load (Rubio et al., 2004). However, SWAT has been found to be less sensitive than the NASA-TLX, especially for low mental workloads (Nygren, 1991).
Now that research is starting to focus on information overload as it relates to information technology, the scope of questionnaires has widened to incorporate usability studies in order to measure the cognitive load imposed by the interface of a system (Longo, 2018). A significant correlation has been found between system usability and cognitive load, which suggests that these are two overlapping constructs that can be jointly studied and employed (Longo, 2018).
Though there are many standardized usability questionnaires, some of the popular include the Computer System Usability Questionnaire (CSUQ), the Questionnaire for User Interface Satisfaction (QUIS), and the System Usability Scale (SUS) (Lewis, 2018; Sauro & Lewis, 2016). The CSUQ is a 19-item questionnaire on a seven-point Likert scale that produces four scores: an overall scale, a system usefulness scale, an
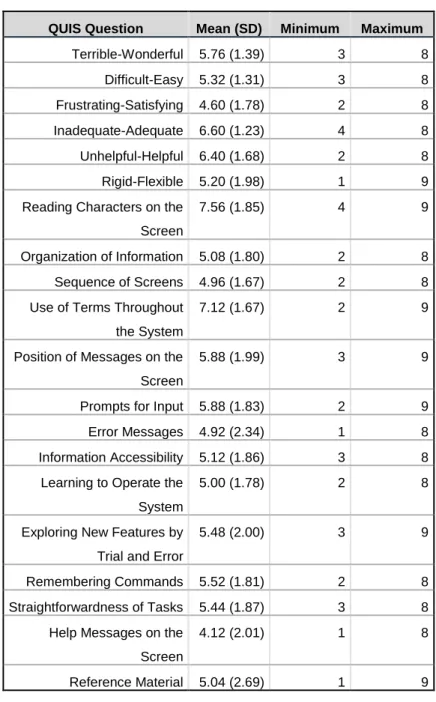
2016). The QUIS is a 21-item questionnaire that uses a 10-point Likert scale and measures the overall system satisfaction while also measuring specific interface factors such as screen visibility, terminology, and system information (Chin, Diehl & Norma, 1988; Garcia, 2007). Of the three usability questionnaires mentioned, the SUS remains the most popular, accounting for over 40% of all usability studies (Garcia, 2007). This is a 10-item questionnaire that uses a five-point Likert scale to measure perceived usability of a system (Garcia, 2007; Lewis, 2018).
2.5.2 Physiological Measures
Though eye tracking and pupillometry (the measurement of pupil dilation) may seem like a relatively new phenomenon, physiological measures such as pupil dilation have been used to measure information overload since the 1960s. Peavler (1974) studied pupillary patterns as a test of the hypothesis that pupil dilation is partially due to a task-related anxiety component. He found that information overload resulted in an increase in the dilation pattern followed by a levelling of dilation, suggesting a momentary
suspension of processing effort. He also found significant correlations between individual differences in pupil size and memory recall suggesting a relationship between the two indicators (Peavler, 1974). A more recent study also found this to be the case, with participant pupil dilations decreasing throughout tasks, suggesting that information overload was occurring (van der Wel & Steenbergen, 2018).
in tasks requiring short-term retention of digits (1966). Though pupillometry has
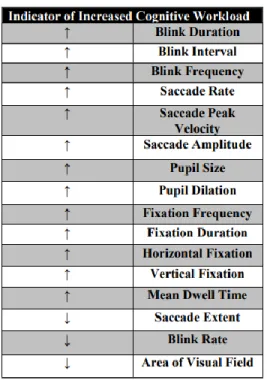
historically only been used in auditory tasks to control for confounding variables such as screen brightness, newer technology has allowed for these external factors to be mitigated (Klingner, 2010). Pupil diameter and eye fixations are captured by an eye tracker and two metrics are tested in response to task difficulty: the change in pupil diameter with respect to inter- or intra-trial baseline and the rate and magnitude of fixations (Krejtz et al., 2018). It has been found in multiple studies that inter-trial change in pupil diameter and fixation magnitude appear to adequately discriminate task difficulty and therefore cognitive load (Krejtz et al., 2018; Coral, 2011). In fact, there are many eye-related measurements that can either decrease in increase in relation to cognitive workload, which are shown in Figure 3.
Figure 3: Relationship between pupillometry measurements and cognitive load
2.5.3 Performance Measures
Finally, the performance on task-related measures are often used to measure cognitive load and therefore information overload on the assumption of cognitive load theory that performance will be hampered once information overload occurs (Haji, Rojas, Childs, de Ribaupierre, & Dubrowski, 2015). The term “performance” can take on many forms and is usually context-specific, though it is usually measured through accuracy and efficiency. Studies described earlier in this section have touched upon the impact that information overload can have on performance, such as accuracy of decision-making (e.g. Zackaruis & Meyer, 2000; Chan, 2001). Though subjective measures such as those described earlier are typically used to assess information overload, few studies have attempted to combine subjective and objective (i.e. performance) measures to determine correlation. One study of medical students found that task performance decreased in response to task complexity, mirroring mental effort ratings and other subjective measures of cognitive load (Haji et al., 2015).
Since information overload can influence both feelings and outcomes, it is
important to include both subjective and objective measurements. This may be even more important in health care where information overload could have significant impacts on both physician and patient health. Once information overload is confirmed and measured, then the reasons behind the problem can be addressed. Though these reasons are complex and nuanced, they will be highlighted in the next section.
2.6
Reasons behind Information Overload
tasks to be completed by the person, organizational design, and how any information technology is used (Eppler & Mengis, 2003). Usually information overload emerges not because of one factor but due to a combination of all five. In studies that have focused on determining these factors, researchers have usually produced testable models of
information overload. In most cases, in order to do this, researchers operationalize the five causes of information overload as independent variables. They then utilize surveys to correlate causes and feelings of information overload by taking the common symptoms of information overload and rewriting them into survey questions.
All five causes influence the two fundamental variables of information overload: the information processing capacity (IPC) and the information processing requirements (IPR). The IPC is defined as the individual’s ability to gather, synthesize, and disseminate information properly over a certain period, while the IPR represents the information required to make a decision. These five pillars that cause information overload will be briefly broken down below.
2.6.1 Information Attributes
As mentioned previously, Keller and Staelin (1987) first argued that not only quantity but also quality of the information provided can contribute to information overload. Schneider (1987) suggested that other traits of information—including novelty, intensity, and ambiguity—could lead to a greater vulnerability of experiencing
result of a failure on the part of organizations to focus on high-value information from the user standpoint.
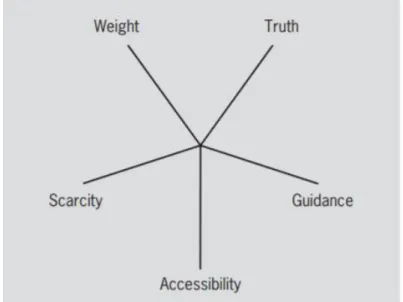
Simpson and Prusak (1995) created a value-added model that proposed five elements that can make up the value of information: truth, guidance, scarcity, accessibility, and weight. A diagram of these five elements can be seen in Figure 4. Overall, Simpson and Prusak (1995) contend that it is the responsibility of information providers—both technology and people—to use these information traits to add value to information. Successfully doing so not only reduces the quantity of information provided by the user by reducing unnecessary information but also ensures that it is of higher quality.
Figure 4: The five elements of information value (Simpson & Prusak, 1995)
2.6.2 Personality Traits
information without differentiating between the capacity of individuals (Galbraith, 1974; Tushman & Nadler, 1978). However, more recent studies have found that individual differences in IPC can be due to age, skills, and level of expertise.
Owen (1992) suggested that individual differences may lead to different
thresholds for information overload and proposed that individual-specific traits such as processing skills could act as moderators of an individual’s IPC or act as some other form of interference that could affect decision-making quality. For one, processing ability appears to be affected by aging, with processing ability increasing from childhood to adulthood but then reaching a peak and decreasing in later years. Additionally, a number of environmental factors can affect processing abilities, both between individuals and within individuals over time. These can include food intake, temperature, and even time of day (Owen, 1992).
There is also some evidence that information processing is in fact a skill. Not only does this skill vary between individuals, but also research has suggested that this skill can be honed and improved over time. Spelke, Hirst, and Neisser (1976) tested this by
measuring two individuals’ attentional and processing capacities over time. Their results suggested that performance depends upon the individual’s knowledge about the task and situation at hand as well as with one’s skills for coping with them. However, they found that the individuals’ processing capacities improved over time. So, while skills may vary between individuals and therefore lead to individual differences, it’s possible for
capacities to increase over time.
developed from past experiences and training that the individual is able to use to make a decision or perform a task. In a study of information overload in tax accountants,
Snowball (1980) suggested that expertise can play a role in mitigating the effects of information overload. He theorized that this is because individuals who are completing complex tasks or making decisions using complex data tend to resort to simpler, less-demanding procedures when further information is provided above their information threshold (Snowball, 1980). Some researchers agree that when this happens, individuals’ domain expertise and prior knowledge becomes more important, thereby lessening the importance and usage of the information given. This was first noted in an early study by Bruner, where he stated, “the more complex or ambiguous the stimulus, the more the perception is determined by what is already ‘in’ the subject and the less by what is in the ‘stimulus’ (1957)”.
2.6.3 Tasks & Processes
concentration of the individual (Speier et al., 1999). As mentioned earlier, this split-attention effect was found to occur in physicians when they were using EHR systems (Harry et al., 2018).
2.6.4 Organizational Design
2.6.5 Information Technology and Its Uses
Finally, information technology (IT) and its use (and often misuse) have rapidly become a major reason behind information overload since the 1980s. The development and deployment of new information and communication technologies, especially the internet, are universally seen as a major cause of information overload (Bawden, 2001). In a 1999 study of scientists, the majority determined that IT has simultaneously led to problems with information overload but also provided the tools for users to cope with it (Bawden, 2001)!
Unsurprisingly, one reason behind the increase in the occurrence of information overload for the group of scientists was that individuals had easier access to a large quantity of information (Bawden, 2001). This meant that individuals had to be more selective in their usage of information, which can negatively affect both IPR and IPC. Beyond information quantity, IT can lead to information overload due to the diversity of information. Not only do individuals receive more information, but it’s more likely that they come from varying perspectives. This can lead to increased difficulty for the user as he/she attempts to fit the varying information perspectives into a general cognitive framework (Bawden, 2001).
technology are that it is instant and efficient for the user (Spacey, 2017). On the other hand, pull technology (such as a Google search) waits for user input before providing information. This is the more traditional information retrieval model and allows for the user to specifically request which information is wanted but can also lead to the
individual not receiving information that may otherwise be needed if the user doesn’t specifically ask for it (Spacey, 2017). Pushing selected pieces of information can increase the uptick in necessary information and reduce the information retrieval time, but
consequently this increases the amount of potentially useless information and can lead to frequent interruptions (Edmunds & Morris, 2000; Spacey, 2017). Therefore, this leads to a tradeoff in the precision and recall.
Information technology can thus potentially increase the individual’s IPC while at the same time increasing the IPR. As EHR systems employ both push (through
checkpoints and pop-ups) and pull (through user searching and scrolling) technology, both of these factors need to be considered when looking at information overload for physicians. The specificities of information overload due to EHR systems will be discussed in the following section.
2.7
Electronic Health Records
popular in the United States being Cerner (used by 23.73% of hospitals) and Epic (used by 22.14% of hospitals) (Livernois, 2018). UNC Hospital, the subject of this study, currently uses Epic and has been operating under this vendor since 2014 (S. Khairat, personal communication, October 2, 2018).
Researchers have been encouraged by the high percentage of EHR usage, stating that the digitalization of patient records could improve access to clinical information and prevent errors that could lead to patient harm (Landi, 2017). With this integrated patient record that provides up-to-date medical knowledge and provider reminders, proponents believed that this would reduce faulty decision-making due to a lack of provider
information or the omission of necessary steps (Landi, 2017). This was especially relevant when patient records were largely written by hand, which lead to errors due to missing pages, illegible handwriting, and handwriting speed (Stausberg, Koch, Ingenerf, & Betzler, 2003).
Though electronic patient records have found to be of higher quality than paper-based, research has suggested that not only might these systems not be as successful in preventing errors as previously hoped, but they may actually be generating new errors (Stausberg et al., 2003; Ash, Berg, & Coiera, 2004). These researchers argued that— outside of technical hardware and software bugs—the errors found were largely the result of a mismatch between the functions of an EHR system and the real-life demands and cognitive workflows of physicians (Ash, Berg, & Coiera, 2004).
communication and coordination process errors (Ash, Berg, & Coiera, 2004). For one, researchers state that the impracticality of the system interfaces makes navigating an EHR system take a significant amount of time for providers. Though interfaces can vary widely by vendor, some systems have interfaces that are outdated, with no windows, no graphic navigation aids, and many lines of identical-looking text (Ash, Berg, & Coiera, 2004). In such cases, even when the information is there, it could be exceedingly hard to find. Because of this, researchers discuss two potential problems: EHR systems that have human-computer interfaces that are not suitable for health care system workflow and that EHR systems can cause information overload by overemphasizing structured and
complete information entry or retrieval (Ash, Berg, & Coiera, 2004). These issues will be delved into in these next sections.
2.7.1 Overemphasis on Structured Formats
Not only can task interruption lead to juxtaposition error, but as mentioned earlier, it can lead to higher a higher susceptibility of information overload. This, combined with the overemphasis the EHR places on structured information entry, can lead to extremely high levels of information overload for physicians. Unsurprisingly, physicians need immediate access to patient data. But simultaneously, they need to be able to record a maximum amount of patient information in the EHR in a minimum amount of time and in such a way that is both useful to other providers who may access the record later and to coders who will be accessing the diagnoses code for billing purposes. Studies have shown that in this type of setting, concise, unconstrained, free-text communication is most
effective for coordinating work around a patient as it allows for more nuanced, relevant,
and in-depth information (Ash, Berg, & Coiera, 2004). However, most of the fields in the
EHR system do not allow free-text entry. Instead, the EHR requires physicians to mostly
enter data in structured formats such as drop-down menus or radio buttons, and generally
these fields are forced answer, meaning a physician cannot move on until an option is
selected. This can be helpful for administrative and billing purposes due to the forced
specificity and lack of grammar or spelling errors (Ash, Berg, & Coiera, 2004). However,
these formats are generally more time-consuming for physicians to complete and read on
top of generally being less relevant to the patient case at hand (Youn, Burge, Kumar,
Wilson, & Ortiz, 2018). When the relevancy of the provided information to the task is lessened through the structuring of the information, and/or when the time spent writing or
reading this information increases significantly, the information ends up being less useful
Researchers found during several observational studies that the overly-structured
data entry led to a loss of provider cognitive function (Ash, Berg, & Coiera, 2004). Many
physicians have reported a loss of overview of the task due to having to go to many
different fields to find information, using many different screens to enter patient details,
and having redundant information (Ash, Berg, & Coiera, 2004). Rather than helping the
physician build a cognitive pattern to understand the complexities of the case through
germane cognitive load, such systems overload the physicians with details at odds with
the cognitive model he/she is trying to develop.
2.7.2 Fragmentation
As mentioned previously, the need to switch between different screens can result
in a loss of overview for physicians. Paper-based patient records used to include an order
list, problem list, vital signs graphs, and medication lists all on a single large sheet of
paper, allowing providers to get a brief overview of a patient in one fell swoop without
turning the page. Initial EHRs were developed to look like paper charts, with tabs of
different sections that were found in paper notes such as progress notes, vital signs, and
labs (Marquez, 2017). This may have been a strategy to help facilitate the transition from
paper to electronic records. But this splitting up of information works against physicians’
abilities to acquire, maintain, and refine a mental overview of the case, as they can lose
information that was being maintained in their short-term memory while switching from
one tab to another. Some physicians who were interviewed by researchers reported that
they felt insecure about identifying emerging problems because the activity of clicking
through the different screens fragmented the cognitive structures they were constructing
In a study of primary care physicians’ usage of EHR, it was found that physicians
found the patient dashboard to be easier to navigate and a better source of information
than navigating to different tabs on the chart (Koopman et al., 2015). The patient
dashboard is an EHR-generated single screen that provides information such as the active
problem list, current medications, allergies, recent vital signs, and recent laboratory
results. These physicians reported that they often printed out this patient dashboard and
referred to it while looking at other tabs in the patient chart as a way to reduce navigation
and demands on their working memory. They also used this printed dashboard as a means
for writing notes, calculations, and checklists by hand (which is then occasionally transcribed into the patient’s chart). However, they noted that this also led to them
encountering redundant information that they believed led to additional clutter (Koopman
et al., 2015). This could lead to physicians potentially missing important information
when trying to sift through data that is irrelevant to the task at hand. This, combined with
the overly-structured format of the data, only increases the risk of experiencing
information overload.
2.7.3 Overcompleteness
EHR vendors can also mistake completeness for efficacy. In several instances, physicians stated that systems that automatically produced standard, “complete” reports
actually reduced the physicians’ perceived usability of these reports or patient discharge
instructions due to the high number of standard, pre-programmed phrases that are used
(Ash, Berg, & Coiera, 2004). Though these standard templates were originally produced
in order to save time by keeping physicians from typing often-used phrases, physicians
general to be useful and can lead to decreased readability. Therefore, these reports
actually end up being of lower value to providers. Related to this is the fact that EHR
systems can lure users into using poor recording practices such as copying and pasting
notes or reports, which can exacerbate the data overload problem by making it easy for
physicians to include too much information.
In a study of primary care physicians, physicians expressed that clinic visit notes
included in the EHR have become more structured, lengthy, and complex over time. In
fact, they perceived billing, quality improvement measures, and avoiding malpractice to
be the biggest drivers of current clinical note construction, which is concerning as these do not support the physicians’ information needs for high-quality patient care (Koopman
et al., 2015). When interviewed, these physicians expressed frustration and distress about
the disconnect between the current state of clinical documentation and their needs, stating
that the layout of documentation in the EHR creates confusion and adds an additional
level of cognitive demand to an already-challenging task (Koopman, et al., 2015). The
results of this increased cognitive demand will be discussed in the following section.
2.8
Results of EHR Information Overload
2.8.1 Physician Burnout
As mentioned previously, physicians have access to a large amount of
information. Additionally, now that information is not confined by storage limits like
paper records, information that might have been discarded in the past is now retained
(Thomas & Rosenman, 2006). Studies have found that this increase in information due to
EHR is highly correlated with physician burnout and inversely correlated with job
satisfaction (Thomas & Rosenman, 2006). Of over 6300 surveyed physicians across
various specialties, 66.9% said that the amount of information in the EHR hindered their
efficiency (Shanafelt, Dyrbye, Sinksy, Hasan, Satele, Sloan, & West, 2016). Relatedly, over 50% of physicians said that the amount of information contained in a patient’s
record caused them stress during clinical encounters (Shanafelt et al., 2016). In a 2018
study, physicians noted EHR systems as the number one cause of burnout. When asked
how EHR systems could be improved to reduce their burden, the top two responses were
to increase user-friendliness and reduce unnecessary information, suggesting that
information overload could be at play (Landi, 2018).
Global studies have found that 30% of physicians are experiencing burnout,
though some surveys have found this number to be as high as 46% (Drummond, 2015).
Burnout can lead to many undesirable consequences for both patients and physicians,
including lower patient satisfaction, lower quality of care, higher medical error rates,
higher physician turnaround, and even physician suicide (Drummond, 2015). Because of
2.8.2 Workarounds
Though workarounds may not seem to directly impact patient care as much as
physician burnout, they do have the possibility of leading to negative consequences.
When systems like EHRs remain in practice but are not conducive to clinical workflow,
workarounds—ad-hoc approaches to bypass these issues—are developed. Workarounds
allow users to live with the system while avoiding some of the unintended demands of
the EHR. These are especially utilized in conditions where physicians are under a high
time pressure. In a qualitative study of physicians in the emergency department, usability,
data presentation, and task issues were the top reasons given behind utilizing
workarounds (Ash, Berg, & Coiera, 2004). Most notably, physicians expressed that they
often devised workarounds when they experienced interface-related challenges such as
malalignment with workflows, irrelevant interface clutter, and inconsistent and confusing
placement of interface elements (Ash, Berg, & Coiera, 2004). Task-related workarounds
were driven by factors related to the tasks performed while using the EHR, including
workload, time pressure, job content, and cognitive load (Ash, Berg, & Coiera, 2004).
Though these workarounds may be more efficient and less frustrating for
providers, they have the possibility of leading to patient safety issues. Missing,
incomplete, or incorrect information could lead to incorrect information being put in a patient’s chart, which could snowball into medication or treatment errors. Additionally,
2.8.3 Patient Safety
Recently, researchers have tried to study the relationship between information
overload and patient care. In one study, over half (55.6%) of primary care physicians
reported in a survey that the EHR system as currently implemented made it possible for
them to miss test results in a patient’s chart. Almost a third of these physicians (29.8%) stated that they had missed test results in a patient’s chart that led to delays in the
patient’s care (Blijleven, Koelemeijer, Wetzels, & Jaspers, 2017). Additionally, these
physicians who had reported symptoms of information overload regarding EHR systems
were more likely to report that they had personally missed test results. On the other hand,
perceived ease of use of EHR was associated with a lower likelihood of reporting both
these metrics (Blijlevel et al., 2017). This suggests an association between EHR usability
(as measured by ease of use) and patient safety in the context of missed test results.
Because of this, EHR usability needs to become a focus of the redesign process in order
to decrease the likelihood of experiencing information overload.
2.9
Current State
Though many physicians have stated that they are overloaded with information
from EHRs and have called for their re-engineering, little progress has been made in the
way of implementing the three suggestions discussed in the previous sections.
Additionally, there is a paucity of research focused exclusively on physician information
overload solely as a result of EHRs, instead focusing on information from multiple
sources (such as EHR and other health IT, clinical journals, and conferences). The few
studies that have focused on this topic were mostly qualitative studies where physicians
to either under or over-reporting of information overload due to this subjective measure.
Additionally, though some studies have looked at how information overload could
interfere with patient care, this is again usually through subjective measures such as
self-reporting.
There is also a lack of information overload studies across various demographics
and physician specialties. As mentioned earlier, research is split as to whether there are
gender differences in information overload. To date, there have been no studies on EHR
and information overload differences between genders. As females now make up 40% of critical care specialists and growing, it’s important to determine whether there are gender
differences in information overload in order to mitigate these effects (Chuang et al.,
2016). Additionally, even though studies have found that information overload increases
with age and decreases with expertise, no studies have focused on correlations between
information overload and either age or level of clinical expertise regarding EHR systems.
Finally, as mentioned in the previous chapter, most research regarding both EHR
systems and information overload focus on either primary care or emergency medicine
physicians, likely because they experience high patient volumes and exhibit high levels
of burnout. However, ICU patients generate some of the most data due to the high level
of care required over a longer period of time. Because these physicians must interact with
many data points and are working with critically ill patients, it’s imperative that EHRs
facilitate physician decision-making instead of acting as a barrier by increasing extrinsic
2.10
Paper Objectives
The aim of this master’s paper is to fill in these gaps in the current research, first
by focusing on tying together subjective and objective measures of information overload
to see whether there is a difference in perceived and realized information overload.
Included in this will be determining whether there are differences in information overload
by gender, age, and expertise. Expertise is broken down into technological expertise—
operationalized as number of years using Epic and the number of hours per week using
Epic—and clinical expertise, as defined by their position in the hospital (either resident,
fellow, or attending physician). Additionally, another goal is to tie these measures of
information overload with clinical outcomes to see if information overload is potentially
leading to errors in patient care. Finally, the final goal is to suggest potential strategies for
re-engineering the EHR for these physicians in a way that reduces information load by
effectively structuring information fields and flow of information in a way that mirrors
their clinical workflow. The specific methods for data collection and analysis for this will
Chapter 3: Methods
3.1
Chapter Overview
This chapter will outline the data collection and data analysis plan for the master’s paper, including the participant group, the methods employed, and the measures analyzed. Finally, this chapter will conclude with a summary of the study’s anticipated impacts and implications.
3.2
Data Collection
The data used for this study were collected between October 2017 and April 2018 by researchers at the Carolina Applied Informatics Research Lab (CAIR) and was
approved by the University of North Carolina at Chapel Hill Institutional Review Board. Permission to use this raw dataset was granted by the Principal Investigator of CAIR, of which the author is a member. Further elaboration on the participants and data collection methods will be discussed.
3.2.1 Participant Group
because UNC Hospital implemented Epic four years ago. Participant demographics will be discussed fully in Chapter 4.
3.2.2 Study 1: Questionnaires
Participants were asked to complete three separate questionnaires: the NASA Task-Load Index (NASA-TLX), the Questionnaire for User Interface Satisfaction (QUIS), and the System Usability Scale (SUS). An overview of these questionnaires is given below and can also be found in Section 2.5.1. These questionnaires were utilized to measure different aspects of EHR usability, satisfaction, and information overload. As studies have found that usability and cognitive load are highly correlated constructs (Longo, 2018), it is necessary to study both of these aspects to determine if there is an interplay in regards to EHR usage.
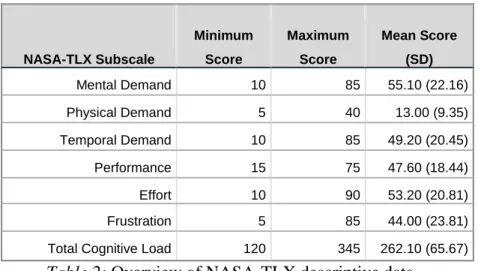
The NASA-TLX was used to measure the mental workload of participants and for the purpose of this study is a substitute for cognitive load. Therefore, participants with higher NASA-TLX overall workload rating are more likely to be experiencing
information overload. The QUIS was administered to measure participants’ acceptability and satisfaction with different features of the EHR, including the sequence of screens, organization of information, and straightforwardness of tasks. Finally, the SUS was given in order to measure the participants’ perceived usability and effectiveness of the EHR. These questionnaires will be fully explained in the following sections.
3.2.2.1 NASA-TLX
The NASA-TLX is a commonly used and validated tool for measuring and
Originally created by Sandra Hart in the 1980s at the NASA Ames Research Center, it is a two-part evaluation procedure that is considered to be the gold standard in measuring subjective workload (AHRQ, 2005). The NASA-TLX rates performance across six dimensions to determine an overall workload rating:
1. Mental demand: how much thinking, deciding, or calculating was required to perform the task.
2. Physical demand: the amount and intensity of physical activity required to complete the task.
3. Temporal demand: the amount of time pressure involved in completing the task. 4. Effort: how hard the participant had to work to maintain their level of
performance.
5. Performance: how successful the participant was in completing the task.
6. Frustration level: how insecure and discouraged the participant felt during the task (NASA, 2018).
Participants were asked to complete the NASA-TLX after completion of the simulation study. For the first part of the questionnaire, participants were instructed to rate their perception on a twenty-step bipolar scale. A score from 0 to 100 (rounded to the nearest half-point) is then determined for each subscale (NASA, 2018; AHRQ, 2005; Rubio et al., 2015).
The second part of the TLX employs a paired comparisons procedure to create an individual weighting of these subscales. This involves presenting 15 pairwise
potential sources of between-rater variability: differences in workload definition between the raters and differences in the sources or workload between the tasks (AHRQ, 2005). The number of times a dimension is more relevant is the weighting of that dimension scale for a given task for that participant. A workload score from 0 (low) to 100 (high) is obtained for each subscale by multiplying the subscale weight by the participant’s dimension scale score, summing across scales, and dividing by 15 (the total number of paired comparisons) (NASA, 2018; Rubio et al., 2015). A prior healthcare study suggests that a subscale score greater than or equal to 55 signifies overwork (Chera, Mazur, Jackson, Taylor, Mosaly, Change, Deschesne, LaChapelle, Hoyle, Saponaro, Rockwell, Adams, & Marks, 2014). The full questionnaire can be found in Appendix A.
3.2.2.2 QUIS
3.2.2.3 SUS
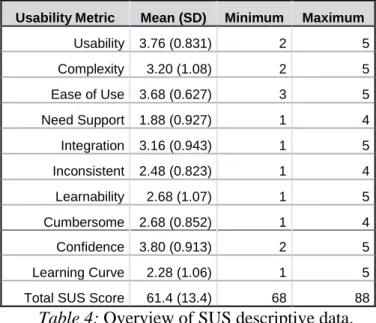
Originally created in 1986 by John Brooke, the SUS is known to be a reliable and validated tool for measuring the usability of a system and is considered to be an industry standard (Usability.gov, 2018). The SUS is a 10-item multiple choice questionnaire where participants respond on a five-point Likert scale (ranging from 1 = Strongly agree
to 5 = Strongly disagree) and measures the interface’s effectiveness (how well the
interface functions), efficiency (how fast someone can use it), and satisfaction (how much the user likes or dislikes using it) (Garcia, 2013).
To score a participant’s response, first for each of the odd-numbered questions, 1 is subtracted from the score. For each of the even-numbered questions, their value is subtracted from 5. These new values for each question are added together and this total is multiplied by 2.5, for a final usability score up to 100. A SUS score above a 68 is
considered above average (signifying better usability) (Usability.gov, 2018). See Appendix C for the full SUS.
3.2.3 Study 2: Simulation Study
• Case 1: a 44-year-old female with multisystem organ failure. Participants were
instructed to review clinical documentation, manage medications, and respond to consultations.
• Case 2: a 60-year-old female with acute hypoxic respiratory failure. Participants
had to review clinical documentation and flowsheets, evaluate changes and mechanical ventilation, and analyze microbiology data.
• Case 3: a 25-year-old male with sepsis. Participants were asked to assess
flowsheets, laboratory data, antibiotics, and fluid management.
• Case 4: a 56-year-old male trauma patient with postoperative heart failure and
volume overload. Participants had to identify weight trends during previous visits and manage IV fluids and medications (Rand et al., 2018).
For this part of this study, participants used Tobii Pro Glasses© 2, which captured eye movements, glances, pupil measurements, and fixation time. Standardized usability software (TURF©) was used to measure the number of mouse clicks, mouse click
location, amount of time per screen, total time to complete each case, and the flow of tabs visited in the EHR in order to assess performance in terms of efficiency (such as time spent on task).
Participants were given one hour to work through the patient test cases in the EHR training environment. For each case, participants were asked between four and six questions about the patient. Each response was scored as followed:
• Incorrect answer = 0
• Partially-correct answer = 0.5
The score for each question for each case was totaled to determine each participant’s cumulative score as an additional measurement of performance (in terms of accuracy). The highest possible score was 21. Refer to Appendix D for a list of questions
administered to participants about these test patients.
3.3
Potential Data Quality Issues
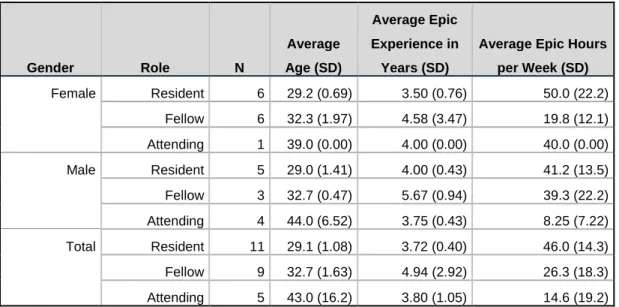
There is the possibility of data quality issues. For one, it is possible that the data generated by these participants are not representative of the critical care physicians at UNC Hospital. Though there was a relatively even gender split and age range, there is little variation in the number of years of Epic experience between physicians.
Additionally, there is likely a high correlation between age and role of the physician due to the nature of medical training. Though steps will be made to control for age when assessing by role, it may not be possible to completely determine main significant relationships.
Additionally, it is possible that the questionnaires lack construct validity in that they are not truly measuring facets related to information overload. There is also the possibility of confounding factors—such as screen brightness or other external
distractors—that could affect pupil dilation during the simulation task. Relatedly, there is the possibility that the patient test cases do not accurately mirror clinical decision-making in the ICU, though a content expert developed the tests cases. With this in mind, the data analysis process will be discussed.
3.4
Data Analysis
demographics (gender, age, role, and experience). Then cross-questionnaire analyses were conducted to determine if there were relationships between mental workload, usability, and satisfaction. Together, these measures are considered to be the subjective measures of information overload.
After this is completed, the results from the simulation study were included as the objective measures of information overload. Data such as time to complete each task (i.e. patient test case), number of mouse clicks, total simulation score, pupil dilation, and screen visits were all taken into consideration and analyses determined whether there was a relationship between a participant’s subjective and objective measurements of
information overload. All data analysis was completed using SPSS (Version 22.0). More in-depth information about the analysis process and methods is included in the following sections.
3.4.1 Subjective Data
week, and Epic experience and participant scores. Partial correlations were used to determine variable main effects.
After analyzing each questionnaire separately, cross-questionnaire analyses were conducted to determine if there were correlations across measures. Specifically, a Pearson correlation was conducted to determine if there were correlations between participants’ NASA-TLX, QUIS, and SUS measures, focusing on correlations between the NASA-TLX/QUIS and NASA-TLX/SUS to determine if there were potential relationships between system usability and features with the subjective workload of participants.
3.4.2 Objective Data
From herein, objective data will be broken down into performance data and eye-tracking data. Performance data includes the accuracy (in terms of correct answers) and efficiency (in terms of time, mouse clicks, and screens visited) throughout the simulation task. These data were assessed both by case and for the task as a whole.
3.4.2.1 Performance Data
mouse clicks, or visited a greater number of tabs on the EHR, suggesting that they were less efficient at the task at hand. Additionally, Pearson correlations were used to test for correlations between the questionnaires and the performance data by participant to determine if there was relationship between mental workload, usability, and/or the EHR interface and the percent correct answers. Data analysis will be conducted using IBM’s SPSS, Version 22.0.
3.5
Implications and Impacts
The outcomes of this study are anticipated to have direct impacts on the critical care physicians at UNC Hospital by drawing attention to Epic EHR usage. The overall goal is to provide value to this group of physicians by determining if information overload is occurring, demographics that could lead to increased susceptibility, and suggesting concrete, data-driven solutions to reduce their extrinsic cognitive load and prevent information overload from occurring.
It is anticipated that this study will find that physicians are experiencing
Chapter 4: Results
4.1
Chapter Overview
This chapter will detail the results of the study outlined in Chapter 3 of this master’s paper. First, participant demographics and other descriptive data will be provided. Then the study will focus on the subjective and objective measures of information overload. The objective measures will be further broken down into the performance and eye-tracking measures.