A MURINE MODEL OF THE ACUTE RESPONSE OF BONE TO A MARROW ABLATING DOSE OF IONIZING RADIATION IN PEDIATRIC ACUTE LYMPHOBLASTIC LEUKEMIA TREATMENT
Angelica B. de Rosa
A thesis submitted to the faculty at the University of North Carolina at Chapel Hill in partial fulfillment of the requirements for the degree of Master of Science in the Joint Department of Biomedical Engineering in the School of Medicine.
Chapel Hill 2014
iii ABSTRACT
Angelica B. de Rosa: A Murine Model of the Acute Response of Bone to a Marrow Ablating Dose of Ionizing Radiation in Pediatric Acute Lymphoblastic Leukemia Treatment
(Under the direction of Ted A. Bateman)
Acute lymphoblastic leukemia (ALL) survivors experience chronic health conditions from treatment, including osteoporosis. ALL radiation therapy is known to induce bone resorption, but animal models for this loss do not exist.
Five-week-old C57Bl/6 mice were either irradiated with 8 Gy X rays or kept as non-irradiated controls. Bones were collected at 2, 4, and 6 days post-irradiation. MicroCT and finite element analysis assessed microarchitectural and structural parameters. Serum osteocalcin and TRAP-5b levels were quantified.
At 2 days post-irradiation, osteocalcin and trabecular bone volume fraction (BV/TV) were elevated in irradiated mice compared to controls. By 6 days, BV/TV, connectivity density, and trabecular stiffness declined, while TRAP-5b levels and cortical volume and stiffness increased.
v
ACKNOWLEDGEMENTS
Thank you to the Bateman Lab for all your help and support, especially Dr. Anthony G. Lau for your extensive help with finite element modeling of bone and mentorship through graduate school, Dr. Sheila Rao-Dayton for your expertise with ELISAs, Eric W. Livingston for your patience and help with all things lab-related and µCT, and Dr. Ted A. Bateman for giving me a chance at a graduate education and believing that good engineers can also learn biology. Thank you also to my family and the future Dr. Christopher J. Payne for your unending love and support. This research was funded by the Initiative for Maximizing Student Diversity, the North Carolina Space Grant, and the National Institutes of Health.
vi
TABLE OF CONTENTS
LIST OF TABLES ... xi
LIST OF FIGURES ... xii
LIST OF ABBREVIATIONS ... xiv
CHAPTER 1: INTRODUCTION ... 18
Significance ... 20
Significance of the Effects of Total Body Irradiation ... 20
Application to Acute Lymphoblastic Leukemia ... 21
Analysis of Bone ... 22
Improving Quality of Life ... 23
A Comprehensive Report ... 24
CHAPTER 2: GENERAL BONE BIOLOGY AND PHYSIOLOGY ... 25
Introduction ... 25
Bone Anatomy... 25
Cortical and Trabecular Bone ... 26
Composite Material ... 29
Bone Marrow ... 29
Bone Cells ... 32
Osteoblasts ... 32
Osteocytes... 35
Osteoclasts ... 38
Bone Remodeling ... 40
Bone Remodeling Process ... 41
Molecular Markers ... 44
Bone Formation ... 45
Bone Resorption ... 46
Hematopoiesis ... 47
CHAPTER 3: OSTEOPOROSIS ... 51
Introduction ... 51
Defining Osteoporosis ... 51
Detecting Bone Loss ... 54
Age Related Bone Loss ... 56
Radiation-Induced Osteoporosis ... 57
Current Treatments ... 60
Pediatric Treatments ... 63
CHAPTER 4: ALL AND RADIATION THERAPY ... 65
viii
Acute Lymphoblastic Leukemia ... 65
Chemotherapy ... 69
Radiation Therapy ... 71
Allogeneic Hematopoietic Stem Cell Transplantation ... 73
Treatment Effects ... 75
General Effects of ALL Treatment ... 75
Treatment Effects on Bone ... 77
Radiation Effects on Bone ... 78
BMT Effects on Bone ... 79
Chemotherapy Effects on Bone ... 80
CHAPTER 5: THE ACUTE RESPONSE OF BONE TO A MARROW ABLATING DOSE OF IONIZING RADIATION IN YOUNG SUBJECTS ... 82
Introduction ... 82
Metrics and Motivation ... 82
A Word About Animal Models ... 84
Hypotheses and Goals ... 85
Overall Goals ... 85
Goals of the Radiation Therapy Model ... 86
Methods ... 88
Results ... 90
ix
Cortical Bone Microarchitecture ... 91
Trabecular Bone Microarchitecture ... 95
Biomarkers of Bone Turnover ... 101
Finite Element Analysis ... 103
Discussion ... 110
Decreased Body Mass ... 110
Changing Microarchitecture ... 110
Elevated Biomarkers ... 113
Functional Compensation ... 114
Increased Bone Mass Before Decline ... 116
Sources of Variation ... 118
Comparison Limitations ... 119
CHAPTER 6: CONCLUSIONS ... 122
CHAPTER 7: IMPROVEMENTS AND FUTURE WORK ... 124
Introduction ... 124
Improvements ... 124
Histology ... 124
Corresponding Dose ... 125
Increase Group Size ... 125
x
LIST OF TABLES
Table 1: Bone formation and resorption markers ... 45
Table 2: Three types of ALL, percentages of total ALL patients, and characteristics ... 67
Table 3: ALL Treatment phases, durations, agents used, and purpose. ... 69
Table A. 1: Body mass. ... 131
Table A. 2: Cortical microarchitectural parameters (µCT) ... 132
Table A. 3: Trabecular microarchitectural parameters (µCT) ... 133
Table A. 4: Serum chemistry (ELISA) ... 134
Table A. 5: Whole bone structural parameters (FEA) ... 134
Table A. 6: Cortical bone structural parameters (FEA) ... 135
xii
LIST OF FIGURES
Figure 1: Standard anatomy of a long bone. ... 26
Figure 2: Cross section depicting the cortical shell and trabecular network. ... 27
Figure 3: Microscopic structure of bone ... 28
Figure 4: Normal conversion of red bone marrow to yellow bone marrow ... 30
Figure 5: Endochondral ossification ... 32
Figure 6: Scanning electron micrograph of an osteoblast ... 33
Figure 7: Stages of the osteoblast lifecycle. ... 34
Figure 8: Osteocyte morphology ... 36
Figure 9: Osteocyte stages and life cycle ... 37
Figure 10: Osteoclast morphology ... 39
Figure 11: Osteoclast lifecycle and derivation. ... 39
Figure 12: Bone remodeling process ... 41
Figure 13: Bone remodeling compartment ... 42
Figure 14: Mineral deposition during bone remodeling ... 44
Figure 15: Blood cell generation ... 48
Figure 16: Normal and osteoporotic vertebrae ... 52
Figure 17: Body mass of irradiated and non-irradiated groups ... 91
Figure 18: µCT images of cortical bone ... 92
Figure 19: Cortical bone volume ... 93
Figure 20: Cortical thickness ... 93
Figure 21: Cortical porosity ... 94
xiii
Figure 23: µCT images of trabecular bone ... 96
Figure 24: Trabecular bone volume fraction ... 97
Figure 25: Volumetric bone mineral density ... 98
Figure 26: Trabecular thickness ... 99
Figure 27: Trabecular number ... 99
Figure 28: Trabecular separation ... 100
Figure 29: Connectivity density ... 101
Figure 30: Serum osteocalcin levels ... 102
Figure 31: Serum TRAP-5b concentrations ... 102
Figure 32: Finite element images of whole bone and cortical bone ... 103
Figure 33: Whole bone volume as determined by FEA. ... 104
Figure 34: Whole bone stiffness as determined by FEA ... 105
Figure 35: Whole bone efficiency as determined by FEA ... 105
Figure 36: Cortical bone volume as determined by FEA ... 106
Figure 37: Cortical stiffness as determined by FEA ... 107
Figure 38: Cortical efficiency as determined by FEA ... 107
Figure 39: Trabecular bone volume as determined by FEA. ... 108
Figure 40: Trabecular stiffness as determined by FEA ... 109
xiv
LIST OF ABBREVIATIONS
6-MP mercaptopurine
ALL acute lymphoblastic leukemia BALP, BSAP bone specific alkaline phosphatase
BMD bone mineral density
BMI body mass index
BMT bone marrow transplantation BMU bone multicellular unit
BRC bone remodeling compartment
BV/TV trabecular bone volume fraction
CLP common lymphoid progenitor cell
CMP common myeloid progenitor cell CNS central nervous system
ConnD connectivity density
CtBV cortical bone volume
CtPo cortical porosity CtTh cortical thickness
CTX C-terminal crosslinking telopeptide of type I collagen
CY cyclophosphamide
DXA dual x-ray absorptiometry
xv
FGF fibroblast growth factor
FRAX Fracture Risk Assessment Tool G-CSF granulocyte colony stimulating factor GMP granulocyte macrophage progenitor cell GVHD graft-versus-host-disease
GVL graft-versus-leukemia
GVT graft-versus-tumor
Gy Gray
HRCT high resolution computed tomography HSC hematopoietic stem cell
HSCT hematopoietic stem cell transplant IGF insulin-like growth factor
IL interleukin
IRR irradiated
M-CSF macrophage colony stimulating factor MDCT multi-detector computed tomography MEP megakaryocyte/erythroid progenitor cell microCT, µCT microcomputed tomography
MRI magnetic resonance imaging
MSC mesenchymal stem cell
MTX methotrexate
NK natural killer cell
xvi
NTX N-terminal crosslinking telopeptide of type I collagen
OC osteocalcin
OPG osteoprotegerin
P1CP procollagen I carboxyl terminal propeptide P1NP procollagen type 1 N-terminal propeptide pMOI polar moment of inertia
pQCT peripheral quantitative computed tomography
PTH parathyroid hormone
QCT quantitative computed tomography QUS quantitative ultrasound
RANK receptor activator of nuclear factor (NF)-kappa-B RANKL receptor activator of nuclear factor (NF)-kappa-B ligand RUNX Runt-related transcription factor
Sv Sieverts
SZ sealing zone
TBI total body irradiation
TbN trabecular number
TbSp trabecular separation TbTh trabecular thickness TGF transforming growth factor
TNF tumor necrosis factor
xvii vBMD volumetric bone mineral density
VCR vincristine
18
CHAPTER 1: INTRODUCTION
Bone is a dynamic substance that is constantly adapting to its environment. Bone will strategically increase or decrease in mass and microarchitecture to accommodate growth, external loading, or chronic conditions. This is possible through the work of osteoblasts, which build bone and are more active during growth and development, and osteoclasts, which resorb bone and are more active when bone loss occurs. Osteoblast and osteoclast activity can be detected through several biomarkers, including osteocalcin (OC), procollagen type I N-terminal propeptide (P1NP), and bone specific alkaline phosphatase (BSAP) for osteoblasts, and tartrate-resistant acid phosphatase (TRAP-5b), N-terminal cross-linking telopeptides of type I collagen (NTX), and deoxypyridinoline for osteoclasts. Their cell numbers and surface area can also be visualized and quantified using histology, and their effects can be measured through microcomputed tomography (µCT) as microarchitectural parameters and finite element analysis (FEA) as structural parameters.
19
including reduced bone mineral density (BMD) and increased fracture rate in bone (McClune et al., 2011).
Reduced BMD and osteoporosis are common side effects of radiation exposure (Oeffinger et al., 2006). Osteoporosis occurs when bone resorption exceeds formation, and is characterized by reduced bone strength, mass, and density. Patients typically undergo dual-energy x-ray absorptiometry (DXA) or quantitative computed tomography (QCT) scans periodically to assess BMD, microarchitecture, and overall bone health. This information helps clinicians craft patient-specific recovery regimens, which may include calcium and vitamin D supplements, pharmacological intervention, exercise regimens, and lifestyle changes with the goal of increasing BMD and reducing fracture risk.
Although BMD is commonly measured alone, it is not an all-inclusive determinant of fracture risk. Microarchitectural parameters such as trabecular number and connectivity density are also important to maintain the mechanical contribution of the cancellous region. These parameters can be combined with computer modeling to assess fracture risk more accurately.
20
to make informed decisions to provide the best care possible for ALL treatment patients and survivors.
Significance
There are several motivations to focus on ALL patients, radiation therapy, and bone as the context for this study. Many cancer patients receive radiation therapy, making a cancer model an appropriate choice to study the biological effects of radiation. Most patients
diagnosed with ALL are cured and experience chronic conditions related to cancer therapy, with osteoporosis and increased fracture risk contributing to reduced quality of life (Rueegg et al., 2013).
Significance of the Effects of Total Body Irradiation
Radiation therapy is needed during treatment for an estimated 50-60% of all cancer cases (Beyzadeoglu et al., 2010; Zeman et al., 2014). Clinical radiation therapy is known to damage bone and increase fracture risk, although the increase in risk associated with standard fractionation is not well characterized (Baxter et al., 2005). Interacting factors, such as
immunosuppressants, physical inactivity, and nutritional deficiencies are acknowledged in addition to radiation as the main causes of bone loss associated with ALL treatment (Mussa et al., 2010) and make it difficult to establish a scientific basis for total body irradiation (TBI) (Barrett, 1999). Our goal is to characterize one of these main causes of treatment-related bone loss, irradiation, and its effects on bone in a mouse model.
21
electrolyte wasting, nutritional deficiencies, steroid and chemotherapeutic drug use,
radiotherapy, and treatment-induced endocrine dysfunctions (Mussa et al., 2010). Radiation compromises bone marrow and depletes stem cell populations, increasing the risk of fracture (Green et al., 2012). For example, the risk of pelvic fracture is known to increase after pelvic exposure to irradiation, and is associated with up to a 20% higher mortality rate than in people who did not receive this type of clinical irradiation (Baxter et al., 2005). Therefore, prevention of damage during radiation therapy will improve bone injury recovery later on (Cao et al., 2011).
Application to Acute Lymphoblastic Leukemia
In the United States, about 13 new cases of leukemia are diagnosed each year for every 100,000 people, and over 1.1 million people live with or are in remission from leukemia, lymphoma, and myeloma, all of which use radiation therapy (Green & Rubin, 2014). For children, about 45 new cases of leukemia per million people per year (Imbach, 2011b), ALL appearing most frequently (Pui et al., 2008). Survival rates for ALL are estimated between 80-90% (Pui et al., 2008) and improving, allowing clinical focus to shift to reducing severe acute and late effects of treatment (Pui & Evans, 2006). Thus, the number of investigators for long-term effects of leukemia and its treatment is growing and becoming part of clinical trial development, with the goal of optimizing therapy intensity, efficacy, and short- and long-term health effects (O'Brien & Lacayo, 2008). One of the most prominent effects to be mitigated is treatment-related bone loss, which results in an almost doubled fracture rate for ALL survivors (Mussa et al., 2010).
22
Hodgkin’s lymphoma and nasopharyngeal cancers, and prophylactic radiotherapy is used to prevent metastases or recurrences in leukemias and small cell lung cancer (Beyzadeoglu et al., 2010). Total body irradiation is used especially in leukemia to eradicate leukemic cells, suppress the immune system, and clear space for bone marrow transplantation (Beyzadeoglu et al., 2010). Scientifically, the effects of clinical radiation are not easy to establish because other factors, such as graft-versus-host disease (GVHD) and bone marrow transplantation (BMT), affect treatment outcome, and patient treatment is the top priority (Barrett, 1999). For example, over 50,000 people worldwide can undergo BMT in a year, primarily due to leukemia (Green & Rubin, 2014).
Analysis of Bone
Osteoporosis is the most common bone disease, and its prevalence and associated fractures are expected to increase due to aging populations (Damilakis et al., 2010; Shuler et al., 2012). In the U.S., about 1.5 million osteoporotic fractures occur each year (Shuler et al., 2012). Over 970,000 hip fractures are expected in the European Union alone (Damilakis et al., 2010) and 6.26 million hip fractures are expected worldwide by 2050, compared to 1.66 million worldwide in 1950 (Shuler et al., 2012). The financial burden of osteoporotic fractures is also expected to increase, with direct care costs related to osteoporotic fractures estimated up to 18 billion dollars per year in 2002, and expected to double or triple by 2040 (Shuler et al., 2012).
23
fracture at another location (Shuler et al., 2012). Patients who do not achieve an optimal peak BMD are more likely to suffer from osteoporotic fractures later in life (McClune et al., 2011). Therefore, addressing bone health early in life can help optimize BMD and thus reduce fracture risk (McClune et al., 2011).
Osteoporosis and increased fracture risk are acknowledged as results of radiation exposure and stem cell transplantation related to cancer treatment. Long-term survivors of hematopoietic stem cell transplantation are at risk for reduced bone mineral density,
osteoporosis, and fracture (McClune et al., 2011) that contributes to morbidity and mortality (Schimmer et al., 2000). Osteoporosis and osteopenia are pathological long-term
complications of radiation treatment (Green & Rubin, 2014; Willey et al., 2008). Bone loss causes reduced bone strength and increased fracture risk (Green & Rubin, 2014; Willey et al., 2011), and associated fractures are difficult to treat (Green & Rubin, 2014). X-ray based imaging techniques are also being used more frequently due to low doses of radiation absorbed, with DXA use growing to over 2 million scans in the U.S. alone by 2002
(Damilakis et al., 2010). With an increasing number of bone scans performed, optimization and justification of radiation exposure becomes necessary to ensure radiation doses are kept as low as reasonably achievable (Damilakis et al., 2010).
Improving Quality of Life
Health-related quality of life is becoming increasingly important for childhood cancer survivors, who experience a lower quality of life compared to their unafflicted siblings and often report musculoskeletal problems (Rueegg et al., 2013). In fact, chronic health
24
1990) and a high cure rate for leukemia already exist; therefore quality of life of those who are cured can and must be addressed (Tucci & Aricò, 2008). Complex treatments, large expenses, and toxic side effects can all be mitigated (Pui et al., 2008), and preventative measures, risk-targeted follow-up, and interventions may also help improve the quality of life for childhood cancer survivors (Rueegg et al., 2013).
More cancer patients are undergoing radiation therapy, so maintaining bone
architecture to prevent long-term risk of fracture from treatment is of increasing importance (Green & Rubin, 2014). Findings about the inflammatory response may be applicable to other conditions in bone, whether inflicted by radiation, chemotherapy, or other
perturbations. Identification of when osteoblasts and osteoclasts are active in children and their mode of action has potential to mitigate long-term skeletal effects of medical
procedures affecting bone by providing appropriate targets for preventative and treatment therapies.
A Comprehensive Report
This manuscript is written with the intention of continued work in the refinement of a murine model for human radiation treatment. Inasmuch as it is undesirable and inhumane to withhold additional treatments from persons who receive radiation therapy, it is important to be aware of and understand confounding factors that occur necessarily in the clinical setting. Therefore, although the model aims to represent the effects of radiation on bone most
25
CHAPTER 2: GENERAL BONE BIOLOGY AND PHYSIOLOGY Introduction
Bone has three main functions: structural support of the body, mineral storage to maintain blood pH values, and blood and immune cell formation. We will discuss mainly load-bearing bones such as long bones in the leg (femur and tibia) and the vertebrae in the spine. Due to their load-bearing function, fracture risk is greatest in these bones, especially with aging or radiation treatment. BMD and bone mineral content, measures of bone mass or the amount of bone present, serve as partial indications of bone strength (Burr & Akkus, 2014). However, microarchitecture must be considered as well. Bone marrow is also the site of blood cell formation, or hematopoiesis, including immune cells. Here we will discuss bone anatomy and the juvenile skeleton; the three bone cells osteoblasts, osteoclasts, and
osteocytes; normal bone remodeling, and hematopoiesis. Bone Anatomy
26
covering the outer surface of bone that aids in formation and nutrition. The endosteum is the membrane that covers the inner surface of the bone. Each section serves its own function critical to structural support and cell generation.
Figure 1: Standard anatomy of a long bone. (Drawing by Humphries, 2011)
Cortical and Trabecular Bone
The two main types of bone organization on the macro-scale are cortical and trabecular bone (Figure 2). Cortical bone, also called compact bone, is dense and forms the outer shell of bones, especially the skull, shafts of long bones, and vertebrae (Burr & Akkus, 2014; Hadjidakis & Androulakis, 2006). It composes 80% of the adult skeleton by weight and has a porosity of 5-10%, which together provides compressive strength and resistance to torsion and bending (Buck & Dumanian, 2012; Christenson, 1997; Hadjidakis &
27
Trabecular bone, also called cancellous or spongy bone, is made up of thin
interconnected struts that direct load forces to the stronger outer cortical bone. It composes 20% of the adult skeleton but has between 50-90% porosity (Buck & Dumanian, 2012; Christenson, 1997; Hadjidakis & Androulakis, 2006) and provides mechanical support by allowing deformations and absorption of loads (Buck & Dumanian, 2012) without
significantly increasing the weight of the bone. The thickness and number of trabeculae will optimize according to the location and direction of loading, and loss of connectivity or trabecular number reduces bone stiffness and strength up to three times more than reducing trabecular thickness (Burr & Akkus, 2014). Due to its greater surface area compared to cortical bone, trabecular bone has higher rates of bone turnover for structural remodeling and maintaining metabolic equilibriums (Christenson, 1997; Hadjidakis & Androulakis, 2006).
Figure 2: Cross section depicting the cortical shell in the proximal femur and supporting trabecular network. Note the visible trabecular tension and compression lines. A) Actual cross-section of a proximal femur (from GeoScienceWorld). B) Illustration of compression and tension lines visible in an actual cross-section of a proximal femur (University of Cambridge).
28
2014). Microscopically, bone is organized into osteons that are composed of concentric lamellae organized around Haversian canals, the channels through which nerves and blood vessels run (Figure 3). In bone cross sections, the Haversian canals typically appear as dark, circular holes. The lamellae around the Haversian canals can sometimes be visualized by the deposition line, but canaliculi, the smaller dots circling the Haversian canal that contain osteocytes, are more visible signs of lamellar boundaries (Burr & Akkus, 2014). The outermost boundary of a lamella where bone resorption stopped is known as a cement line. Cement lines act as natural barriers to microcrack propagation, maintaining structural integrity of the osteon on the microscale (Burr & Akkus, 2014).
Figure 3: Microscopic structure of bone. Note the concentric lamellae, canaliculi, and Haversian canals. (From http://s1.hubimg.com/u/7534464_f520.jpg)
29 Composite Material
Bone is composed of approximately 65% mineral or inorganic matrix by weight, 25% organic material, and 10% water (Burr & Akkus, 2014). Structurally on the nano-scale, it is a mineralized cross-linked collagen matrix (Burr & Akkus, 2014).
The organic phase of bone is secreted by osteoblasts and provides ductility and resilience (Burr & Akkus, 2014). It is composed primarily (90%) (Christenson, 1997; Hadjidakis & Androulakis, 2006; Teitelbaum, 2000) of type I collagen organized into fibers (Burr & Akkus, 2014) but also contains glycoproteins, proteoglycans, and growth factors (Buck & Dumanian, 2012), including bone morphogenetic proteins. The mineral phase of bone is dispersed throughout the collagen fibers, and the crystals are oriented in the same direction (Hadjidakis & Androulakis, 2006).
Mineral composes 50-70% of the bone matrix (Bellido et al., 2014). It acts as storage for the body’s supply of calcium, phosphorus, magnesium, and sodium (Buck & Dumanian, 2012). The mineral phase of bone provides strength, stiffness, and compressive resistance to the material (Buck & Dumanian, 2012; Burr & Akkus, 2014) and is composed primarily of carbonated apatite (hydroxyapatite) organized into plate-like structures (Burr & Akkus, 2014; Teitelbaum, 2000). Calcium is a major component of bone and provides strength and
stiffness. Calcium ions are also used in blood clotting, muscle contraction, and enzyme reactions (Burr & Akkus, 2014).
Bone Marrow
Bone marrow exists inside bones among the trabecular network, encased by the cortical shell. It contains capillaries and cells, including stem cells, stromal cells,
30
myeloid cells (Paessler & Bourne, 2011). Stromal cells, which include fibroblasts and adipose cells, secrete proteins, adhesion molecules, and regulatory products required for hematopoiesis, stem cell survival, and osteogenesis (Paessler & Bourne, 2011).
During growth and development, the bone marrow cavities of the long bones contain mostly red marrow (Burr & Akkus, 2014; Guillerman, 2013). Red marrow is indicative of hematopoiesis, while yellow marrow is indicative of fat. By adulthood, much of the bone marrow cavity is filled with yellow fat (Burr & Akkus, 2014; Guillerman, 2013). Red
marrow is highly vascularized and active in hematopoiesis, with the number of hematopoietic cells reducing with age (Guillerman, 2013). Yellow marrow is composed mostly of
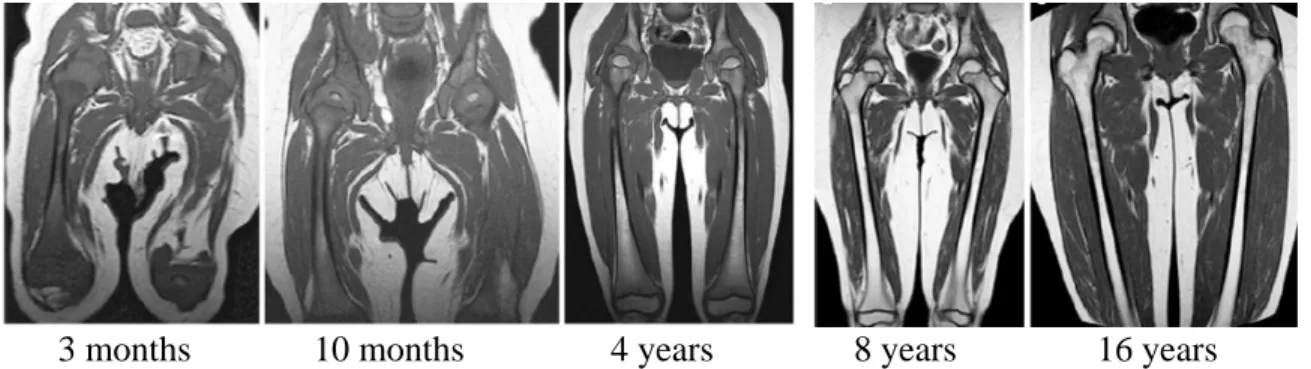
adipocytes and has little to no vasculature or hematopoietic activity (Guillerman, 2013). Conversion from red marrow to yellow marrow begins around the time of ossification of the epiphyses and occurs distal to proximal, diaphyseal to metaphyseal, and central to peripheral (Guillerman, 2013). Figure 4 below illustrates the conversion of red marrow to yellow marrow through adolescence using MRI images.
Figure 4: Normal conversion of red bone marrow to yellow bone marrow through childhood and adolescence. Shown from left to right are MRI images of the femur taken at 3 months, 10 months, 4 years, 8 years, and 16 years of age. (Adapted from Guillerman, 2013)
31 Juvenile Skeleton
The juvenile skeleton differs from the adult skeleton in 3 main ways: 1) it is not fully fused, 2) it has a thick periosteum, and 3) it is porous and flexible (Humphries, 2011). At birth about 460 centers of ossification exist that eventually fuse to form the 206 bones in the adult skeleton, and bones that are not completely done forming are present between birth and adulthood (Humphries, 2011). The embryonic skeleton is composed of woven bone, a
flexible but weak matrix of disorganized collagen fibrils and mineralization, which is replaced with organized lamellar bone before adulthood (Buck & Dumanian, 2012). The periosteum is thicker in young bones because it is involved in growth and repair (Humphries, 2011) and contains osteoprogenitor cells before skeletal maturity (Buck & Dumanian, 2012). Young bone is more porous because it contains more Haversian canals and collagen than adult bones, resulting in greater flexibility, elasticity, and strength (Humphries, 2011).
Long bones form from a cartilage template in a process called endochondral
ossification (Figure 5) (Buck & Dumanian, 2012; Humphries, 2011) . They mineralize from the center of the diaphysis toward the ends, forming a hollow bone marrow cavity and
32
Figure 5: Endochondral ossification. Long bones are formed from a cartilage template that mineralizes and lengthens from the center of the diaphysis toward the epiphysis. (Drawing by Humphries, 2011)
Bone Cells
Bone is made up of three main types of cells. Osteocytes reside within the bone structure itself and monitor internal health. Osteoblasts are bone forming cells, and
osteoclasts resorb bone. Osteoblasts and osteoclasts are key components in bone remodeling. Osteoblasts
33
proteins to form osteoid during bone formation (Bellido et al., 2014; Hadjidakis & Androulakis, 2006).
Figure 6: Scanning electron micrograph of an osteoblast cultured on a titanium film. (From http://www.scielo.br/img/revistas/rmat/v12n1/a18fig03.jpg)
34
Figure 7: Stages of the osteoblast lifecycle. Osteoblasts are formed from osteoprogenitor cells that derive from mesenchymal stem cells. Once the osteoid has been laid, osteoblasts either become lining cells, osteocytes, or undergo apoptosis. (Figure adapted from Marie, 1998; Triffitt & Oreffo, 1998, and bioscience.org)
Osteoblast proliferation, differentiation, and activities are regulated by a number of pathways and proteins. Wnt signaling pathways influence mesenchymal stem cells to follow osteoblastic pathways, stimulate differentiation of preosteoblasts, and inhibit osteoblastic apoptosis (Bellido et al., 2014). The helix-loop-helix family of transcription factors proliferate osteoblast progenitors (Bellido et al., 2014) and may increase osteoblast
differentiation (Marie, 1998), and AP-1 family of transcription factors are expressed during proliferation (Bellido et al., 2014). Bone morphogenetic protein (BMP) signaling pathways control osteoblast differentiation (BMP-2, -3, and -7), promote bone matrix protein synthesis, and induce apoptosis at the end of the lifecycle (Bellido et al., 2014; Marie, 1998).
Osteoblasts can stimulate bone matrix protein synthesis and the proliferation of osteoblast precursor cells by producing fibroblast growth factor (FGF), insulin-like growth factor (IGF), and transforming growth factor beta (TGF-β) (Marie, 1998). TGF-β also inhibits bone
35
& Oreffo, 1998). Runt-related transcription factor 2 (RUNX2) and osterix promote mineralization. Osteoblasts can also produce receptor activator of nuclear factor kappa-B ligand (RANKL), interleukin 1 (IL-1), tumor necrosis factor alpha (TNF-α), IL-6, and macrophage colony stimulating factor (M-CSF), which may increase osteoclastogenesis and bone resorption (Bellido et al., 2014; Despars & St-Pierre, 2011; Marie, 1998). RANKL expression is upregulated by IL-1, IL-6, parathyroid hormone (PTH), and vitamin D (Bellido et al., 2014). IL-1 is a major stimulator of bone resorption (Triffitt & Oreffo, 1998).
Osteoblasts are also influenced by Wnt pathways to secrete osteoprotegerin (OPG), a protein in the TNF receptor family that inhibits osteoclastogenesis by binding to RANKL (Bellido et al., 2014).
Osteocytes
36
Figure 8: Osteocyte morphology. A) Depiction of osteocytes in an osteon, lacunae and fine canaliculi organized perpendicular to a Haversian canal. B) Osteocytes form a network among each other, bone marrow, and other bone surfaces through connecting dendrites. (Adapted from Bellido et al., 2014)
The osteocyte lifecycle has four stages: formative, steady-state, resorptive, and
degenerative (Aarden et al., 1994) (Figure 9). Osteocytes are derived from osteoblasts, and in the formative phase the osteoblast commits to the osteocyte lineage and becomes embedded in the secreted osteoblastic matrix (Aarden et al., 1994). Next comes the steady-state phase devoid of most metabolic activity (Aarden et al., 1994), followed by maturation and the resorptive phase in which the osteocyte may be capable of bone resorption (Aarden et al., 1994; Bonewald, 2011). Indeed, osteocytes are capable of remodeling their perilacunar matrix (Bonewald, 2011). The degenerative phase in which the osteocyte deteriorates precedes cell death (Aarden et al., 1994).
37
Figure 9: Osteocyte stages and life cycle. Osteocytes are derived from osteoblasts that have been embedded in the forming bone matrix. They monitor the bone matrix and signal remodeling in response to mechanical and hormonal stimuli. (Figure adapted from Bonewald, 2011)
Osteocytes secrete M-CSF and RANKL, which are proteins that promote
osteoclastogenesis and osteoclast survival (Bellido et al., 2014). M-CSF causes osteoclast differentiation by binding to its receptor on osteoclast precursor cells (Bellido et al., 2014). RANKL binds directly to its receptor on osteoclasts to stimulate activity (Bellido et al., 2014). It promotes precursor fusion, attachment to bone surfaces, and stimulation of
resorption (Bellido et al., 2014). Osteocytes also secrete OPG, a protein in the TNF receptor family that inhibits osteoclastogenesis (Bellido et al., 2014). OPG binds to RANKL,
38 Osteoclasts
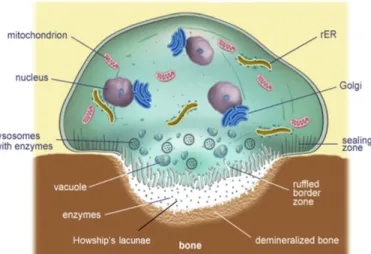
Osteoclasts are multinucleated cells that resorb bone (Figure 10), although they can only resorb mineralized bone (Buck & Dumanian, 2012). They have several Golgi
complexes, transport vesicles, and mitochondria and lysosomal enzymes for resorbing and processing bone (Hadjidakis & Androulakis, 2006). The sealing zone (SZ) is the
circumferential region of bone-cell interface composed of podosomes, which are filamentous actin structures of F-actin, alpha-actin, vinculin and talin proteins (Teitelbaum, 2000) that allow osteoclasts to adhere to bone (Bellido et al., 2014; Boyle et al., 2003; Teitelbaum, 2000). Once attached, the cell polarizes and creates a ruffled border (RB) (Hadjidakis & Androulakis, 2006; Teitelbaum, 2000), which resorbs bone through the use of an H+ -adenosine triphosphate (H+-ATPase) mediator and a process similar to exocytosis (Teitelbaum, 2000). The RB secretes hydrolytic enzymes (Bellido et al., 2014) such as hydrogen ions, TRAP, and pro-cathepsin K (pro-CATK) (Boyle et al., 2003; Hadjidakis & Androulakis, 2006) to acidify and dissolve bone (Bellido et al., 2014; Hadjidakis &
39
Figure 10: Osteoclast morphology. Note especially the multiple nuclei, sealing zone, ruffled boarder, and Howship’s lacuna. (Adapted from oerafrica.org)
Osteoclasts are derived from the hematopoietic monocyte/macrophage line (Bellido et al., 2014; Boyle et al., 2003; Buck & Dumanian, 2012; Teitelbaum, 2000) (Figure 11). M-CSF causes monocytes to develop into preosteoclasts (Teitelbaum, 2000). These
preosteoclasts cluster and fuse together under the influence of M-CSF and RANKL, which are secreted by osteoblasts and osteocytes (Bellido et al., 2014; Boyle et al., 2003). The protein beta-catenin is also known to directly control osteoclastogenesis and bone resorption (Bellido et al., 2014). Osteoclasts then resorb bone and may detach and move to a new site of bone degradation (Teitelbaum, 2000), or undergo apoptosis (Bellido et al., 2014).
40
OPG, receptor activator of nuclear factor kappa-B (RANK), RANKL together are known to regulate osteoclast function (Boyle et al., 2003). RANK is a member of the TNF receptor superfamily (Teitelbaum, 2000) and is required for osteoclast differentiation, activation, and bone resorption (Boyle et al., 2003). RANKL is a polypeptide member of the TNF superfamily that binds to and activates RANK on osteoclasts (Boyle et al., 2003; Teitelbaum, 2000), and can prolong survival of mature osteoclasts (Boyle et al., 2003). RANKL is also expressed by T-lymphocytes (Teitelbaum, 2000). OPG is produced by osteoblasts and binds to RANKL to inhibit osteoclastogenesis (Bellido et al., 2014; Boyle et al., 2003; Teitelbaum, 2000). Calcitonin is also known to be active in osteoclast regulation (Buck & Dumanian, 2012), and IL-6, IL-1β, and TNF-α are known pro-resorption cytokines (Despars & St-Pierre, 2011).
Together, osteoblasts, osteoclasts, and osteocytes are responsible for one remodeling.
Bone Remodeling
Bone remodeling is a term defined by Harold Frost in 1990 (Frost, 1990) to identify the process by which bone is restored or renewed in response to loading, microdamage, cell death, or blood mineral homeostasis (Allen & Burr, 2014; Hadjidakis & Androulakis, 2006). It is characterized by a coupled response of bone resorption and bone formation on an
41 Bone Remodeling Process
The remodeling cycle consists of five stages: activation, resorption, reversal, formation, and quiescence (Allen & Burr, 2014; Hadjidakis & Androulakis, 2006) (Figure 12).
Figure 12: Bone remodeling process. Mechanical or molecular stimuli initiate the activation phase, which results in the resorption of bone by osteoclasts. After resorption, the reverse occurs and osteoblasts lay down new osteoid that will later mineralize to become bone. When mineralization is complete, bone lining cells monitor the remodeled resting bone. (Adapted from Allen & Burr, 2014. Image by Dorothy Fatumnbi)
The bone remodeling process begins with activation. In most cases, bone remodeling is triggered by osteocyte signaling prior to apoptosis (Allen & Burr, 2014). When an
42
Unaffected osteocytes produce antiapoptotic signals, such as OPG, to prevent their resorption and constrain remodeling to affected regions (Allen & Burr, 2014).
Bone resorption begins after activation. Mature osteoclasts form and signal bone lining cells to retract from the surface, forming a bone remodeling compartment (BRC) within which bone remodeling takes place (Figure 13) (Allen & Burr, 2014). Podosomes in the SZ allow osteoclasts to adhere to the exposed surface of bone. Osteoclasts then acidify the enveloped region by producing protons from carbonic anhydrase and secreting them through the RB, and internalize the degraded bone. This results in a resorption lacuna (Figure 10) (Bellido et al., 2014).
Figure 13: Bone remodeling compartment. Lining cells retract at the onset of the bone remodeling process to create an enclosed space in which bone remodeling takes place. Note osteoblasts and osteoclasts, and their precursor cells, at work in the BRC. (From Bellido et al., 2014)
During the reversal phase, osteoclast activity ends and bone formation begins (Allen & Burr, 2014). Macrophages prepare the bone surface for bone formation and signal
43
2006). Any remaining collagen fragments are removed, and the cement line matrix is laid down (Allen & Burr, 2014).
When reversal is complete, bone formation may be triggered by osteoblastic
chemoattractants or growth factors, such as TGF-β, which is released during bone resorption and stimulates bone formation (Marie, 1998). Osteoblasts then secrete the organic phase of bone, namely type 1 collagen and other matrix proteins, to form osteoid and serve as a template for mineral hydroxyapatite deposition (Allen & Burr, 2014; Bellido et al., 2014; Hadjidakis & Androulakis, 2006). Mineralization occurs, and soluble calcium and phosphate in the organic matrix become solid calcium phosphate crystals (Buck & Dumanian, 2012). Osteoblasts then either die by apoptosis or become osteocytes or lining cells (Allen & Burr, 2014).
44
Figure 14: Mineral deposition during bone remodeling. Primary mineralization saturates bone up to 70% of its limit within 3 weeks. Secondary mineralization accumulates the remaining 30% over the next months or years (Burr & Akkus, 2014).
At the end of the remodeling cycle is the quiescence phase in which bone rests as it accumulates mineral (Allen & Burr, 2014).
Molecular Markers
The following table summarizes molecular markers of bone formation and resorption that can be detected in blood serum or urine (Allen & Burr, 2014). Key molecules are
45
Table 1: Bone formation and resorption markers that can be detected in urine or blood serum. *Osteocalcin is produced primarily by osteoblasts but also by osteoclasts to a much lesser extent. (Adapted from Allen & Burr, 2014 and Christenson, 1997)
Bone Formation
Biomarkers of bone formation indicate organic matrix formation in bone and osteoblast activity (Christenson, 1997).
Osteocalcin (OC, or the Gla protein) is the most abundant noncollagenous protein in the bone matrix (Christenson, 1997). It enhances calcium binding and controls mineral deposition and is overexpressed in cancer and some autoimmune diseases (Burr & Akkus, 2014). It is produced by osteoblasts during active matrix secretion, and a small amount is normally released into the circulation (Christenson, 1997). Along with ALP, OC reflects the rate of bone formation (Allen & Burr, 2014; Bellido et al., 2014) when formation and
46
(Christenson, 1997). Osteocalcin is specifically expressed by osteoblasts late in the
differentiation pathway in the presence of mineralized bone matrix (Triffitt & Oreffo, 1998). Alkaline phosphatase (ALP) is a glycoprotein and potential Ca2+ (calcium ion) carrier (Burr & Akkus, 2014). It hydrolyzes pyrophosphate, an inhibitor of calcium phosphate and mineral deposition (Burr & Akkus, 2014; Christenson, 1997). It is produced by osteoblasts during active matrix secretion and may be clipped off the osteoblastic membrane
(Christenson, 1997). ALP, along with osteocalcin, also reflects the rate of bone formation (Allen & Burr, 2014; Bellido et al., 2014; Christenson, 1997).
Procollagen I extension peptides are produced by osteoblasts from collagen fragments that are cleaved during collagen synthesis (Allen & Burr, 2014; Christenson, 1997), yielding procollagen I amino terminal propeptide (PINP) and procollagen I carboxyl terminal
propeptide (PICP) (Christenson, 1997). Bone Resorption
Biomarkers of bone resorption indicate a degradation of type I collagen and osteoclast activity (Christenson, 1997).
TRAP is a lysosomal enzyme expressed and secreted by osteoclasts between the sealing zone and bone matrix during bone remodeling (Bellido et al., 2014; Christenson, 1997). It may be involved in dephosphorylizing bone sialoprotein and osteopontin, which are used in generating reactive oxygen species used in matrix degradation (Bellido et al., 2014). Bone acid phosphatase can be inhibited by L (+) tartrate, so most analyzed specimens are treated with (+) tartrate to make them tartrate resistant (hence, TRAP) (Christenson, 1997).
47
for RANKL, which decreases osteoclastogenesis (Plotkin & Bivi, 2014). OPG can be used to gauge bone resorption (Plotkin & Bivi, 2014).
Collagen fragments, including N-terminal and C-terminal crosslinking telopeptides of type I collagen (NTX-I and CTX-I, respectively), are released from the bone matrix during resorption and can be detected in urine and serum (Allen & Burr, 2014; Christenson, 1997). The formation of these fragments is specific to bone due to osteoclastic metabolization of type I collagen in bone that does not occur in other tissues (Christenson, 1997). Crosslinks such as pyridinoline and deoxypridinoline are also released from the matrix during resorption (Allen & Burr, 2014; Christenson, 1997).
Hematopoiesis
48
Granulocytes and macrophages are part of the innate immune system and engulf and digest pathogens (Staal et al., 2011).
Figure 15: Blood cell generation. All blood cells derive from hematopoietic stem cells, which can differentiate into lymphoid cells (natural killer cells, B-cells, T-cells) or myeloid cells (macrophages, basophils, eosinophils, neutrophils, platelets, and red blood cells). (Adapted from Domen et al., 2011, image by Terese Winslow 2001)
HSCs are located in the bone marrow cavity, with hematopoietic reconstitutive HSCs near the endosteum and long-term reconstitutive HSCs in hypoxic marrow regions (Despars & St-Pierre, 2011). Mesenchymal stem cells (MSCs) that produce osteoblasts, chondrocytes, and other skeletal cells are located in oxygen-rich areas of the bone marrow (Despars & St-Pierre, 2011).
Many proteins affect hematopoiesis and influence terminal differentiation. RUNX1 is important for the definitive production of erythroid, myeloid, and lymphoid cells
49
CCAAT/enhancer binding protein alpha (C/EBPα), while lymphoid cell lines are promoted by the combination of PU.1, Ikaros, and transcription factor E2A (Murre, 2009). B-cells are promoted by early B-cell factor (EBF) and paired box protein Pax5, which suppress the T-cell lineage, and E2A (Murre, 2009). T-T-cells are promoted and matured by E2A and Notch signaling proteins, as well as the transcription factor GATA-3, zinc finger protein Gfi-1, DNA-binding transcription factor TCF1, and Ikaros (Murre, 2009). Kit ligand from stromal cells is also required for stem cell homeostasis (Jagannathan-Bogdan & Zon, 2013).
Cell signaling from osteoblasts and osteoclasts may also influence hematopoiesis. Wnt signaling and BMPs may be important in hematopoiesis, and osteoblasts may interact with HSCs in the bone marrow (Jagannathan-Bogdan & Zon, 2013). Increased osteoblast activity increases the HSC population in the bone marrow, while decreased osteoblast numbers and bone loss cause HSCs to relocate outside of the bone marrow (Despars & St-Pierre, 2011). Adhesion molecules and matrix protein secretion by osteoblasts can regulate HSC function through cell-to-cell interactions (Despars & St-Pierre, 2011). Osteoclast
precursors and mature osteoclasts contribute to the retention of HSCs in the marrow (Despars & St-Pierre, 2011). RANKL activates osteoclasts and results in hematopoietic progenitor cell migration to the blood, while calcitonin inhibits osteoclast function and reverses this
mobilization (Despars & St-Pierre, 2011). Summary
50
51
CHAPTER 3: OSTEOPOROSIS Introduction
Osteoporosis is a condition of low bone density and microarchitectural deficits that greatly increases fracture risk (Damilakis et al., 2010; Sebestyen et al., 2012; Shuler et al., 2012; Weilbaecher, 2000). It can be caused by hormonal imbalances, diseases, treatments, lifestyle choices, or a combination of them (Green & Rubin, 2014). No cure currently exists, making prevention the best treatment option. In ALL patients, premature osteoporosis and low bone density are largely a result of disease treatment, particularly radiation,
chemotherapy, and disuse from bed rest (Green & Rubin, 2014; Schimmer et al., 2000; Weilbaecher, 2000). Radiation is believed to be the main source of acute bone loss
(Weilbaecher, 2000). In this section we will explore the normal pathology of osteoporosis and focus on radiation-specific mechanisms. We will also present standard treatments and treatment regimens accepted for pediatrics.
Defining Osteoporosis
52
alone (Shuler et al., 2012) and over 70 million people worldwide at risk (Boyle et al., 2003). Osteoporosis is considered a silent disease because it is often detected only after a low-energy fracture (Shuler et al., 2012), and patients are susceptible to spontaneous bone fractures (Teitelbaum, 2000).
Osteoporosis and osteopenia, a pre-osteoporotic condition, result from an uncoupling of bone formation and resorption, with the resorption rate greater than formation (Shuler et al., 2012; Weilbaecher, 2000), and can result from reduced bone formation or accelerated bone resorption (von Scheven, 2007). Trabecular plates of bone are lost with increased bone resorption, resulting in reduced bone strength, mass, and density (Shuler et al., 2012). Trabecular thinning occurs over time until the struts become so thin that the remodeling unit causes a disconnection (Allen & Burr, 2014). Trabecular struts cannot be reconnected once disconnected, as this would require de novo formation to create woven bone bridges (Allen & Burr, 2014). Therefore, high rates of bone remodeling are a greater risk factor for fracture than low rates of bone remodeling (Allen & Burr, 2014), and osteoporotic bones are more fragile than non-osteoporotic bones (Shuler et al., 2012). Fractures occur most commonly in patients with osteopenia (Shuler et al., 2012) and areas rich in trabecular bone, such as the vertebrae, wrist, and hip (Damilakis et al., 2010) (Figure 16).
Figure 16: Normal and osteoporotic vertebrae. Osteoporotic bone has a thinner cortical shell and thinner or fewer trabeculae than healthy bone. (Image from
53
Maximizing peak bone mass is critical to minimizing fracture risk later in life, and low childhood growth rate (height and weight) can be a significant predictor of hip fracture later in life (Khosla, 2013). Peak bone density is reached around 20-25 years of age, and the overall outcome of osteoporosis depends on this peak bone mass and the rate of bone loss (Haddy et al., 2001; Khosla, 2013; Mandel et al., 2004; Putman & Gordon, 2014). During puberty, total bone strength increases linearly, and 25-50% of peak adult bone mass can be achieved (Khosla, 2013). Bone formation-inhibiting sclerostin decreases at the onset of puberty, and cortical thickness increases at the end of puberty (Khosla, 2013).
54
only valid between the ages of 40 and 90, not applicable to pharmacologically managed patients, does not account for fracture-related risk factors such as falls and biochemical markers, and does not account for dose response effects (Shuler et al., 2012).
Detecting Bone Loss
Bone density and other parameters can be assessed through several X-ray and non-X-ray imaging and bone turnover detection techniques. The most commonly used technique DXA, which produces T-scores used to determine osteoporotic status (Shuler et al., 2012). A low energy x- ay scans the site of interest, usually the proximal femur or lumbar spine, and calculates bone density based on the amount of X-ray transmission through the tissue (Schimmer et al., 2000). Areal bone mineral density can be obtained in a short time while maintaining image quality using fan-beam DXA (Damilakis et al., 2010), but it cannot separately analyze trabecular and cortical bone (Khosla, 2013). DXA has an effective dose of less than 0.01 mSv for a peripheral scan, 0.0052 mSv for a 5-year-old child whole body scan, and 0.0042 mSv for an adult whole body scan (Damilakis et al., 2010).
Other X-ray methods for skeletal quantitative assessment include quantitative computed tomography (QCT), multi-detector CT (MDCT), peripheral QCT (pQCT), high resolution CT (HRCT), radiographs, and single energy absorptiometry (Damilakis et al., 2010; Shuler et al., 2012). QCT has high spatial resolution, can detect structural
55
with a low radiation dose (less than 0.01 mSv) and can assess bone morphology in vivo and obtain trabecular number, thickness and separation, and cortical porosity and thickness (Damilakis et al., 2010). HRCT can image the texture of trabecular bone but provides a much higher dose of radiation than a typical X ray at about 3 mSv (Damilakis et al., 2010). Spinal radiographs are commonly used for vertebral fracture identification due to lower radiation doses than CT scans, good tissue contrast, and ability to characterize bone density but cannot assess 3D architecture and can have a false negative rate of up to 45% (Damilakis et al., 2010; Shuler et al., 2012).
Non X-ray imaging techniques include ultrasound and magnetic resonance imaging (MRI). Ultrasound can characterize bone density but does not produce a T-score value (Shuler et al., 2012). Quantitative ultrasound is smaller, cheaper, and more mobile than DXA while maintaining similar fracture risk assessment abilities but is difficult to maintain
calibration and quality control (Shuler et al., 2012). MRI can be used to characterize bone density and analyze 3D trabecular structures without the radiation exposure of QCT and may be developed to wider use in the future (Shuler et al., 2012). DXA, QCT, pQCT, and
ultrasound can be used to measure bone density in pediatric patients, although clinically, DXA is used the most (Sebestyen et al., 2012; von Scheven, 2007).
Bone turnover can be assessed using histomorphometry and immunoassays in adults (Christenson, 1997). Decreases in bone mass are associated with increases in biochemical markers of bone resorption (Khosla, 2013). Assays to monitor NTX, CTX, pyridinoline and deoxypyridinoline, and urinary calcium concentrations can be used to monitor bone
56
(Christenson, 1997). Serum and urinary biomarkers can also be used to measure bone turnover, including hydroxyproline, osteocalcin, calcium, alkaline phosphatase, and thyroid-stimulating hormone (Christenson, 1997; Schimmer et al., 2000).
Age Related Bone Loss
Bone mass is stabilized by fairly equal amounts of formation and resorption until age 35-40 (Mandel et al., 2004). After about age 40, bone resorption exceeds formation, and bone mass begins to decline (Mandel et al., 2004). About 40% of lifetime expected trabecular bone loss occurs by age 50 (Khosla, 2013). Decreases in trabecular bone and volumetric bone mineral density (vBMD) can occur as early as the 20s, with increased rate of loss during menopause for women (Khosla, 2013). Cortical vBMD is stable until it begins decreasing in mid-life for women and in the early 70s for men (Khosla, 2013). Women experience bone loss through decreases in trabecular number and increases in trabecular separation (Khosla, 2013). Men experience bone loss largely through a reduction in trabecular thickness (Khosla, 2013).
Fracture risk associated with BMD varies with age (Shuler et al., 2012). Older individuals have more apoptotic cells, shorter telomere lengths, increases in oxidative stress, and greater inflammatory microenvironments compared to younger subjects (Khosla, 2013). Human mesenchymal stem cells, which differentiate into osteoblasts, take 1.7 times longer to double in older subjects than young subjects (Khosla, 2013). Sclerostin levels are also known to increase with age (Khosla, 2013).
57
within the first 3 years of the onset of menopause, although it may increase the risk of breast cancer (Schimmer et al., 2000). In men, both estrogen and testosterone maintain bone formation, but estrogen protects against bone resorption much more than testosterone (Khosla, 2013). Total testosterone and estrogen levels decline with aging due to increased hormone binding globulin levels (Khosla, 2013).
Osteoporosis in women is related to estrogen deficiency (Khosla, 2013). Bone resorption increases and bone formation markers decrease significantly with acute estrogen deprivation (Khosla, 2013). Estrogen and androgens inhibit apoptosis in osteocytes and osteoblasts (Bellido et al., 2014) and suppress osteoclast formation and activity, increase transcription of IGF-1 and TGF-beta which stimulate osteoblast replication and bone matrix synthesis, and repress osteoblast transcription of RANKL, IL-6 and M-CSF which activate osteoclasts (Khosla, 2013; Weilbaecher, 2000). Postmenopausal women have more than 3 times the percentage of bone marrow cells expressing RANKL than premenopausal women (Khosla, 2013). Therefore, after menopause, women have a period of rapid bone loss due to estrogen decreases and increased bone remodeling (Allen & Burr, 2014).
Radiation-Induced Osteoporosis
58
radiation (Damilakis et al., 2010), but cancer patients can receive up to 2Gy doses of radiation delivered over several minutes for several days in a row (Willey et al., 2011). Hematopoietic stem cell transplantation (HSCT) patients, who often receive preparative radiation therapy, experience the most bone loss within 6 months of irradiation (Green et al., 2012).
Radiation exposure is followed by an acute increase in bone resorption and
subsequent reduced bone formation (Willey et al., 2011). Bone loss occurs in fewer than 10 days following radiation exposure (Green & Rubin, 2014) and can be observed within one week (Willey et al., 2011). TBI decreases growth hormone secretion, which may lead to hypogonadism and increased bone loss from reduced sex hormone production (Weilbaecher, 2000). Radiation also depletes bone marrow, allowing adipocytes to fill in rather than
hematopoietic repopulation (Green & Rubin, 2014). Vasculature within bone can be damaged, including the marrow cavity and Haversian systems (Willey et al., 2011). The amount of bone loss sustained depends on the absorbed dose, energy of radiation beam, fraction size, and age and developmental stage of the patient (Willey et al., 2011), but cumulative low doses (fractionation) may prevent bone architecture devastation while still maintaining efficacy for therapeutic applications (Green et al., 2012).
59
dramatic 20-40% reduction in trabecular bone and a minor reduction of cortical bone (Green & Rubin, 2014), and functional bone loss can be observed as early as 3 days post-irradiation (Kondo et al., 2009). Bone volume fraction (BV/TV) and trabecular number were found to be greatly reduced by 10-days post-irradiation, and trabecular separation increased (Green et al., 2012). Volumetric bone mineral density and mineral apposition rate have been observed to increase within a week of radiation exposure (Willey et al., 2010). Finite element analysis revealed an increase in compressive strength at 2 weeks post-irradiation, followed by a long term loss of strength (Wernle et al., 2010). Microarchitectural quality was still damaged at 8-weeks post-irradiation (Green et al., 2012).
Radiation can directly damage bone cells, enlarge resorption lacunae, and increase osteoclast number and activity without an increase in bone formation (Weilbaecher, 2000). It also promotes cell cycle arrest and apoptosis, inhibits osteoblast proliferation, and reduces collagen production (Willey et al., 2008). Bone marrow cell populations are greatly reduced 2 days post-irradiation, with recovery by 8-weeks (Green et al., 2012). Mesenchymal stem cell populations are reduced following irradiation (Willey et al., 2011), but hematopoietic stem cells are relatively radiation resistant (Green et al., 2012). Radiation can upregulate specific hematopoietic lineages, and its effects are dependent on the phenotypic cell population (Green et al., 2012). Younger mice have been found to repopulate marrow cell populations faster than older animals, as the number of cells in the bone marrow is reduced by over 60% by 2 days post-irradiation, with no recovery at 10-days but recovery in young mice by 8-weeks (Green et al., 2012).
60
long-term (McClune et al., 2011), but osteoblast numbers and bone formation are unchanged when acute bone loss occurs after radiation exposure (Willey et al., 2011). Irradiation reduces the number of osteoblasts, reduces osteoblast proliferation and differentiation, collagen production and matrix formation, and increases apoptotic sensitivity (Willey et al., 2011). Total body irradiation is also associated with a decrease in viable osteocytes and
hypogonadism, which can cause osteoporosis (Weilbaecher, 2000), although osteocytes are relatively radioresistant (Willey et al., 2011).
Osteoclast number and activity is rapidly elevated following clinical doses of irradiation, producing increased amounts of TRAP5b as early as 24 hours after irradiation (Willey et al., 2011). Osteoclasts are more active 3-days after radiation exposure, increasing in number and surface and producing more TRAP-5b, but osteoblastic and bone
microarchitectural changes are not yet present (Willey et al., 2011; Willey et al., 2008). Physiochemical processes that dissolve the bone matrix may also contribute to the rapid radiation induced bone loss (Green & Rubin, 2014). The occurrence of bone loss independent of hematopoietic cell availability or repair suggests cell-independent causes of bone loss such as physiochemical erosion are major causes (Green et al., 2012). A decrease in mineral composition of trabecular bone, altered collagen cross linking and altered
mineralized matrix have been observed within a week after irradiation (Green & Rubin, 2014), and changes in bone strength may be affected by both architectural and material properties (Willey et al., 2011).
Current Treatments
61
For adults, adequate calcium and vitamin D intake (Green et al., 2012; Haddy et al., 2001; McClune et al., 2011; Schimmer et al., 2000; Weilbaecher, 2000), regular weight bearing exercises (Haddy et al., 2001; McClune et al., 2011; Schimmer et al., 2000; Weilbaecher, 2000), avoiding tobacco (Haddy et al., 2001; McClune et al., 2011; Schimmer et al., 2000) and alcohol use (McClune et al., 2011), and avoiding carbonated beverages (Haddy et al., 2001; Schimmer et al., 2000) are all encouraged to improve BMD. Hormone replacement therapy may be appropriate if a hormone imbalance exists (Green et al., 2012; Haddy et al., 2001).
Antiresorptive agents are drugs that inhibit osteoclast activity and decrease bone resorption and thus overall loss (Haddy et al., 2001). However, when remodeling is suppressed, microdamage accumulates because it is not remodeled, and mechanical forces are more likely to cause fractures because increased mineralization and cross-linking make the tissue more brittle (Allen & Burr, 2014). Antiresorptive agents include bisphosphonates, calcitonin, teriparatide, estrogen receptor modulators, and hormone replacement therapy (McClune et al., 2011; Shuler et al., 2012; Weilbaecher, 2000). Raloxifene is an estrogen receptor modulator that is becoming widely used because it increases bone density without stimulating breast or endometrial tissue proliferation (Schimmer et al., 2000). Calcitonin inhibits osteoclasts and bone resorption (Haddy et al., 2001; Schimmer et al., 2000) but has not been shown to prevent bone loss (Schimmer et al., 2000). Only bisphosphonates have been shown to reduce or prevent steroid-induced bone loss (Schimmer et al., 2000; Weilbaecher, 2000). Bisphosphonates are administered for HSCT patients who are on
62
Bisphosphonates are antiresorptive agents and stable analogues of pyrophosphates, which bind to hydroxyapatite crystals to prevent calcification (Sebestyen et al., 2012).
Bisphosphonates reduce bone turnover by decreasing osteoclast activity, inhibiting osteoclast recruitment, and inducing osteoclast apoptosis (Green & Rubin, 2014; Schimmer et al., 2000; Sebestyen et al., 2012; Weilbaecher, 2000). They can also decrease bone formation by
inhibiting calcification and hydroxyapatite breakdown, reducing overall bone turnover (Green & Rubin, 2014; Sebestyen et al., 2012). Less than 5% of orally administered
bisphosphonates are absorbed by the body, but may last several years in the bone depending on the rate of bone remodeling (Sebestyen et al., 2012). They are generally well tolerated, but adverse effects include gastrointestinal reflux and development of flu-like symptoms
(Sebestyen et al., 2012). Bisphosphonates include etidronate, alendronate, risedronate, and zoledronate (Haddy et al., 2001; Sebestyen et al., 2012). Zoledronic acid (zoledronate) increases bone density but does not maintain bone mechanical properties (Green & Rubin, 2014), and risedronate can prevent radiation-induced bone loss (Green & Rubin, 2014; Willey et al., 2010).
Anabolic pharmacological agents (parathyroid hormone) enhance the production of bone mass (Shuler et al., 2012). Parathyroid hormone (PTH) increases bone resorption by stimulating osteoblasts to produce RANKL (Green & Rubin, 2014). PTH and zoledronic acid can increase BMD better than the bisphosphonate alone (Green & Rubin, 2014). PTH and vitamin D (calcitriol) regulate calcium balance by stimulating bone resorption and intestinal and renal calcium absorption (Putman & Gordon, 2014).
Nonpharmacologic interventions include fall prevention, balance and exercise
63
et al., 2012). Approximately 25% of the calcium ingested is absorbed (Putman & Gordon, 2014), so maintaining calcium intake of at least 1500 mg per day and vitamin D levels at high normal limits are major treatments for bone loss (Weilbaecher, 2000). Vitamin D is a prohormone whose metabolite calcitriol regulates calcium homeostasis (Putman & Gordon, 2014), and deficiencies in vitamin D and calcium increase parathyroid hormone production and bone loss (Schimmer et al., 2000).
Pediatric Treatments
As of 2007, there were no recommended guidelines for screening bone densitometry or treating low bone mass in children (von Scheven, 2007). There may be a correlation between BMD and bone fragility in children, but since DXA measurements are dependent on bone size, Z-scores may only be indicative of low bone density for chronologic age, not necessarily osteoporosis or osteopenia (von Scheven, 2007).
Current preventative measures and treatments include radiation dose reduction, calcium and vitamin D supplementation, and bisphosphonate use. Weight bearing exercise and whole body vibration can also increase bone mineral content, although no optimal exercise programs currently exist (von Scheven, 2007). Teriparatide (recombinant human parathyroid hormone) is not recommended for use in children (McClune et al., 2011; von Scheven, 2007), as it may cause osteosarcoma (von Scheven, 2007).
64
can be minimized by reducing image lengths to fit the child’s body, preventing exposure to radiosensitive organs, and using automatic exposure controls (Damilakis et al., 2010).
Calcium and vitamin D are considered safe agents, and supplementation is often a first step toward correcting reversible low BMD in children (von Scheven, 2007). Calcium supplements are most commonly available as calcium carbonate, with oral amounts limited to 500mg doses due to absorption limits (Putman & Gordon, 2014). The recommended daily calcium intake for infants less than 1 year is 260mg, for children age 1-5 years is 800mg, up to 1200mg for ages 6 to 10, and 1500mg over ten years old (von Scheven, 2007), with an upper limit of 3000 mg/day (Putman & Gordon, 2014). Vitamin D is also available as oral supplements (Putman & Gordon, 2014), and the recommended daily intake for children is 400-600 IU (Putman & Gordon, 2014; von Scheven, 2007). An inverse relationship between calcium intake and childhood bone fracture has been suggested in epidemiologic studies, and a direct relationship between serum vitamin D levels and bone mineral content or BMD has also been suggested (Putman & Gordon, 2014).
Oral bisphosphonates are an aggressive treatment in children (von Scheven, 2007) and are increasingly used to treat severely low BMD and osteoporosis, although there is no long-term safety and efficacy data (Ooi et al., 2012; von Scheven, 2007). They have been shown to substantially increase BMD, trabecular number (von Scheven, 2007), and reduce fracture rates (Ooi et al., 2012; von Scheven, 2007), preserve trabecular bone, and increase cortical area and thickness in children (Ooi et al., 2012). There are concerns that
65
CHAPTER 4: ALL AND RADIATION THERAPY Introduction
Leukemia is an uncontrolled expansion or proliferation of hematopoietic cells that cannot differentiate into mature blood cells (Sawyers et al., 1991). Acute leukemias are characterized by white blood cells that mature and function abnormally, and have high numbers in circulation (Sawyers et al., 1991). Therefore, blood cells must be destroyed, but it is nearly impossible as of yet to only eliminate cancer cells. Currently, treatment is to pretreat the patient with chemotherapeutic agents and irradiation (TBI) to completely destroy blood and bone marrow tissues (myeloablation) before stem cell transplantation (BMT, or HSCT) to replenish blood and immune cells (Domen et al., 2011). Acute lymphoblastic leukemia is the most common childhood cancer (Campana & Pui, 2014; Tucci & Aricò, 2008) and has a cure rate around 80%, or upwards of 1500 new child survivors in the U.S. each year (Haddy et al., 2001).
Acute Lymphoblastic Leukemia
66
originates in the bone marrow (Imbach, 2011b), and some may develop prenatally (Pui et al., 2008). They derive from hematopoietic stem cells or progenitor cells (Domen et al., 2011; O'Brien & Lacayo, 2008) and include tumorigenic genetic and epigenetic changes that give rise to cancer cell characteristics such as loss of programmed cell death, retention of
telomeres, and evasion of immune cells (Domen et al., 2011). Mutations for self-renewal and stage-specific developmental arrest occur in progenitor cells committed to the B- or T-cell lineages (Pui et al., 2008).
ALL in particular is a malignant disorder of lymphoid progenitor cells (Pui et al., 2008), and the most common childhood cancer (Campana & Pui, 2014; Tucci & Aricò, 2008). There are three main types of ALL, each with specific cell surface markers and defining chromosomal translocations (
Table 2). B-cell precursor ALL affects 70-80% of ALL patients and expresses cell