EXPANDING THE ELECTORATE:
THE EFFECTS OF PREREGISTRATION ON YOUTH TURNOUT
Caroline Linnea Carlson
A thesis submitted to the faculty at the University of North Carolina at Chapel Hill in partial fulfillment of the requirements for the degree of Master of Arts in the Department of Political
Sciences in the College of Arts and Sciences.
Chapel Hill 2019
Approved by: Christopher Clark
ii
ã 2019
iii ABSTRACT
Caroline Linnea Carlson: Expanding the Electorate: The Effects of Preregistration on Youth Turnout
(Under the direction of Christopher Clark)
iv
TABLE OF CONTENTS
LIST OF TABLES ... v
LIST OF FIGURES ... vi
INTRODUCTION ... 1
BACKGROUND AND EXPECTATIONS ... 3
METHOD AND RESULTS ... 7
CONCLUSION ... 22
v
LIST OF TABLES
vi
LIST OF FIGURES
Figure 1 – Voter Turnout, 18-23 Year-Olds ... 9
Figure 2 – Voter Registration, 18-23 Year-Olds ... 10
Figure 3 – Voter Turnout, 2008 General Election ... 11
Figure 4 – Voter Turnout, 2012 General Election ... 12
Figure 5 – Voter Turnout, 2016 General Election ... 12
Figure 6 – Voter Turnout, 2010 Midterm Election ... 13
Figure 7 – Voter Turnout, 2014 Midterm Election ... 14
Figure 8 – Predicted Probability of Voting in 2012 ... 18
Figure 9 – Predicted Probability of Voting in 2014 ... 19
1
INTRODUCTION
In the 2016 election, an estimated 23.7 million 18-29 year-old Americans voted – approximately half of those eligible in the United States. Though these voters made up about a fifth of total votes cast, their turnout rate paled in comparison to their older counterparts (who turned out at a rate of approximately 66%) (Fry 2016). These differences are not at all new – the age gap in electoral turnout has remained robust since 18-year-olds gained the right to vote in 1971. In 1972, for instance, about 55% of eligible 18-29 year-olds voted compared to 70% of those 30 and older. By 2012, turnout rates for these groups were 45% and 66%,
respectively.1 For years, political scientists have studied this trend, attributing it to various factors, such as limited access to voting-related resources and unfamiliarity with the electoral process (e.g. Burden et al. 2014; Gerber and Green 2000; Rosenstone and Hansen 1993).
Scholars have researched the effects of multiple electoral reforms on overall voter turnout, such as registration windows (Hanmer 2009; Knack and White 2000), voter
identification laws (Mycoff et al. 2009; Alvarez et al. 2007), and early voting periods (Burden et al. 2014; Herron and Smith 2014; Giammo and Brox 2010), but a more recent electoral reform – preregistration – has not been studied to the same extent as many of these other reforms. Preregistration refers to a procedure that allows individuals younger than 18 to register to vote so they are already recorded on voter rolls by the time they turn 18. One example of this is Oregon’s 2015 “motor voter” law, which made voter registration an opt-out process, automatically registering individuals 17 or older to vote when they obtained or
1 2012 report from the Center for Information and Research on Civic Learning and Engagement
2
renewed a driver’s license (Oregon Secretary of State). Currently, twenty states provide some form of preregistration, and they vary in 1.) the specific age required to be able to preregister (16 or 17) and 2.) whether preregistration is an opt-in or opt-out process (National Conference of State Legislatures). Efforts to pass preregistration laws appear specifically aimed at
increasing youth turnout: In 2004, when U.S. Representative Edward Markey (MA-04) introduced an amendment to the National Voter Registration Act, he argued that
pre-registration programs would “encourage civic engagement from young voters,” particularly because it would allow young people to “take care of the paperwork ahead of time” and not have any administrative barriers to overcome on Election Day (Markey 2004).2 Because preregistration’s goal is to encourage voting among young people by reducing the costs of registration, how effective are preregistration laws in increasing youth turnout?
Substantively, this research question is important because it has implications for democratic practice. Because voting tends to be habit forming (Aldrich et al. 2010; Meredith 2009; Plutzer 2002), it reinforces participation in the political process. And as voting becomes more of a habit, voters become more politically and civically minded (Jakee and Guang-Zhen Sun 2006; Lijphart 1997). Therefore, disengagement by a certain group of Americans could be seen as harmful to maintaining a politically active, democratic populace. Individuals who participate in the political system are typically more likely to be represented through policy (Griffin and Newman 2012; Quale Hill and Leighley 1994). Groups that vote more often (older, white, high income earners) are more likely to see their preferences represented through legislation. Young voters, therefore, often see their preferences ignored in favor of
3
those of older cohorts, even though they make up about 21% of the U.S. population (U.S. Census).
Although research suggests a wide array of factors explain voter disengagement (see Fieldhouse and Cutts 2012; Ulbig and Waggener 2011; Delli Carpini and Keeter 1996), analyzing the relationship between preregistration laws and youth turnout can provide additional context into how a specific institutional reform shapes the participation of young adults in the franchise. Though preregistration laws aim to increase youth turnout, some scholarship suggests that no single electoral reform can uniformly improve political
participation across groups (Springer 2014), and that some electoral reforms reduce political engagement (Burden et al. 2014). Indeed, Berinsky (2005) finds that electoral reforms meant to improve turnout (such as early voting and vote-by-mail) only increase socioeconomic inequalities in the voting population. Though this existing scholarship has found that electoral reforms do not always have their intended effects, it is still relevant to study the effects of preregistration, as existing research on this specific reform is limited.
This paper will explore the effects of North Carolina’s passage and removal of preregistration laws on youth turnout. I hypothesize that there will be lower turnout among young voters who did not preregister compared to those who did. I test this hypothesis by running logit models and predicted probabilities of turnout on access to preregistration. I find that young voters who preregistered were significantly more likely than others to turn out on Election Day. These findings could have policy-related implications for lawmakers
4 Background and Expectations
One of the first empirical studies on preregistration and turnout is McDonald and Thornburg’s (2010) analysis of preregistration efforts in Florida and Hawaii. The authors analyze statewide voter files and compare turnout rates among preregistered and non-preregistered voters. Those who were non-preregistered, on average, had turnout rates that were two to three percentage points higher than voters who were not preregistered. The analysis is limited in that it does not control for other variables that could affect turnout (such as race, income level, or education). As Hillygus and Holbein (2015) note, “individuals who are especially interested in politics might be both more likely to preregister and more likely to vote,” and these factors need to be addressed.
Hillygus and Holbein (2015) expand on McDonald and Thornburg’s (2010) findings by analyzing the impact of preregistration laws on turnout across years and states using a difference-in-difference and lag model. Relying on the Current Population Survey, they find a “13% increase in the probability of voting among 18-22 year-olds in states with
preregistration laws compared to states without preregistration” (Hillygus and Holbein 2015). Further, they leverage Florida’s voter file (which includes birthdates rather than just birth years) to identify young voters who were eligible to vote prior to Election Day. After running a regression discontinuity model, they find that offering preregistration had a positive,
statistically significant effect on the probability of voting (3%). Preregistration increased turnout consistently across subgroups (males vs. females, whites vs. minorities), but
5
turned 18 before Election Day). The authors attribute this result to preregistration: Marginal ineligibles were able to preregister during a politically salient time and vote in the following election.
Existing research on the calculus of voting can provide a framework for why we might expect preregistration to increase youth turnout in North Carolina. According to Downs (1957), an individual’s propensity to vote is a function of the costs and benefits of voting: If the benefits exceed the costs, the individual votes, and if it does not, the individual does not vote. Preregistration laws could increase turnout by reducing the costs of voting among young people.
A primary type of cost that could affect turnout – particularly among young voters – is information costs. Voters who are new to the political system are typically less likely than their older peers to have the information necessary to vote. As Plutzer (2002) notes, younger citizens have magnified costs of voting, as many of them “have never gone through the process of registration, may not know the location of their polling place, and may not have developed an understanding of party differences on key issues.” Highton (2004) expands on this argument, citing registration as the main cost of voting in America – an up-front cost that individuals new to the system must pay before participating in an election. Although
6
According to Hillygus and Holbein (2015), there are also distinct features of
preregistration laws that can increase turnout. In particular, preregistration removes a barrier to participation during the heightened salience of a political campaign (Hillygus and Holbein 2015). In other words, preregistration gives a 16 or 17-year-old who is ineligible to vote an opportunity to join the political system at a time when their interest in politics is high, such as during an electoral campaign. This theory is supported by Shino and Smith (2018), who find that the timing of registration – in near proximity to an election – can promote habitual voting. Once someone enters this political system as a preregistered voter, various factors can promote and reinforce turnout. First, research suggests that individuals who are registered to vote consider themselves participants rather than outsiders, and this identification could therefore increase one’s “efficacy, attentiveness, and participation in future elections” (Bryan et al. 2011; Hillygus and Holbein 2015). Second, Meredith (2009) and Plutzer (2002) find that political engagement tends to be habitual, so earlier admittance into a political system could promote further political engagement, such as voting in the next election. Third, after an individual is registered to vote and becomes part of this system, he is much more likely to be listed on party voter files and receive get-out-the-vote communications, which can further reinforce political participation (Hillygus and Shields 2008; Gerber and Green 2000; Verba et al. 1995). This effect of get-out-the-vote efforts on turnout can be particularly high for
minority voters in states with high descriptive representation (Clark 2014).
7
Civic education generally provides students with the skills needed to understand and follow politics as well as the bureaucratic requirements of registration and voting (Rosenstone and Hansen 1993; Wolfinger and Rosenstone 1980). High schools might also host registration drives, further exposing students to the political process (McDonald and Thornburg 2010).
Given this research on the calculus of voting as well as the reinforcing components of being involved in a political system, I develop the following hypothesis:
Hypothesis: Compared to individuals who did not have access to preregistration, those who did have access to preregistration will be more likely to vote in eligible elections.
In other words, exposure to a preregistration law should increase the probability of turning out to vote. Preregistered 16 and 17-year-olds, for instance, will be more likely to eventually vote than individuals in the same age group who did not preregister. Method and Results
This research attempts to expand on Holbein and Hillygus’s findings by studying how an institutional change in the political environment affects engagement of young voters in North Carolina. This state will be the focus of this research for a myriad of reasons. North Carolina’s unique history of preregistration laws offers an opportunity to study how the passage and removal of preregistration laws affect turnout rates: In 2009, the North Carolina General Assembly passed a bill allowing preregistration among 16 and 17-year-olds,
becoming effective on January 1, 2010. In September 2013, however, the state voted to eliminate preregistration as part of a larger package of election reforms.3 This sequence of events allows us to analyze how institutional changes shape electoral behavior of young
3 In July 2016, a federal appeals court struck down many provisions of this North Carolina voting law
8
voters within a state. North Carolina also lends itself well to analysis because the state maintains updated voter registration and history files containing birth years and registration dates. Finally, the state is typically a competitive battleground state, suggesting that voters might experience the heightened salience of political campaigns prior to each election.
I draw from the North Carolina Voter File and Voter History File. The Voter History File contains each instance a citizen voted in North Carolina since 1992. The Voter File contains individual-level variables, such as race, gender, and birth year. According to the North Carolina State Board of Elections, voters may be removed from this file if they remain inactive for two federal election cycles after being sent a confirmation mailing by the county (NCSBE Voter Registration FAQ). Voters may also be removed if they are no longer eligible to vote due to death, felony conviction, or lack of voter contact (NCSBE Voter Registration FAQ). Because North Carolina removes individuals from its registration files, data reflecting turnout rates might be inflated. Further, the data does not include other figures on voter participation (such as the total voting age population) because this information is not publicly available. Nonetheless, I use the Voter File and Voter History File to best approximate turnout across elections.
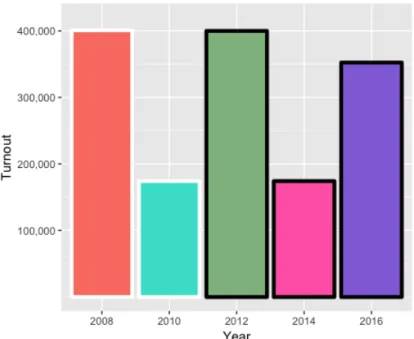
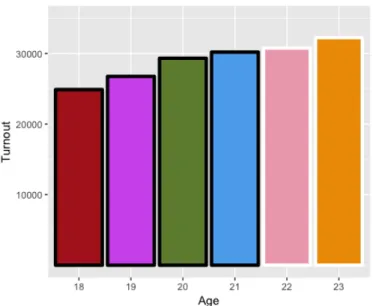
Figure 1 shows turnout among young people (18-23-year-olds) across elections in North Carolina (2008-2016). Bars with black borders indicate elections in which voters were eligible to preregister. The graph does not suggest any large effect of preregistration on turnout. Turnout in the 2008 and 2012 general elections and the 2010 and 2014 midterm elections, respectively, are similar, but there is a dip in turnout in the 2016 election relative to the two preceding general elections. This might be explained by the removal of
9
well as other political factors, such as candidate attitudes or get out the vote efforts.
Additionally, there may not be any noticeable effect of preregistration on turnout in 2012 and 2014 because these turnout totals include many individuals who were not eligible for
preregistration. For instance, in 2012, only 18 and 19-year-olds were eligible for
preregistration, while 20 to 23-year-olds were not, and in 2014, only 18 to 21-year-olds were eligible. Figures 3-7 provide a more detailed illustration of turnout across specific ages.
Figure 1: Voter Turnout, 18-23 year-olds.
Bars in bold indicate cohorts eligible for preregistration.
10
registrants from previous elections who became inactive were removed from the voter file. Next, we turn to voter turnout across specific age groups.
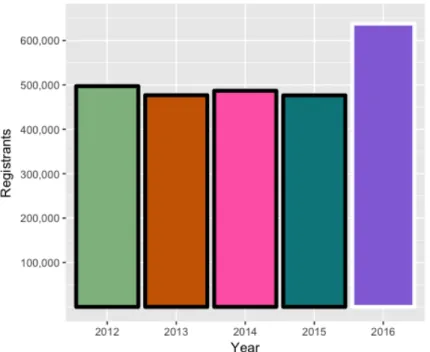
Figure 2: Voter Registration, 18-23 year-olds.
Bars in bold indicate cohorts eligible for preregistration.
11
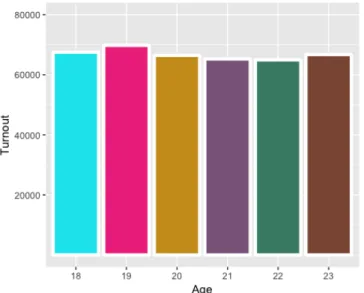
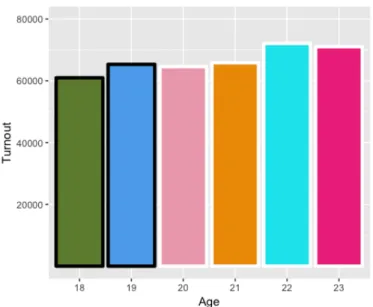
blue). In Figure 4, we see that eighteen and 19-year-olds in the 2012 election were exposed to the preregistration law, and they turned out in larger numbers than those 18 and 19-year-olds who were not eligible for preregistration in 2016. There were less 18 and 19-year-olds who turned out in 2012 than in 2008, however – when preregistration was not yet in effect. This may be due to voter mobilization efforts and candidate attitudes of young people in the 2008 campaign, among other factors (Keeter et al. 2008). In the 2016 general election (Figure 5), 20-23-year-olds were more likely than 18 and 19-year-olds to turn out, but this trend is not true for the 2008 and 2012 elections. This difference could possibly be attributed to the absence of preregistration for 20 to 23-year-olds during these elections.
12
Figure 4: Voter Turnout, 2012 General Election.
Bars in bold indicate cohorts eligible for preregistration.
Figure 5: Voter Turnout, 2016 General Election.
Bars in bold indicate cohorts eligible for preregistration.
13
groups who were exposed to preregistration and groups who were not. This is particularly interesting because 18 and 19-year-olds in the 2014 election would have been exposed to preregistration during a politically salient 2012 general election. Nonetheless, differences in turnout may become clearer once other factors variables, such as demographics, are
considered.
Figure 6: Voter Turnout, 2010 Midterm Election
14
Figure 7: Voter Turnout, 2014 Midterm Election
Bars in bold indicate cohorts eligible for preregistration.
Though histograms provide a general overview of voting trends across ages and years, I estimate logit models to predict youth turnout across each election between 2012-2016. These elections were selected because they were the only elections in which
15 Table 1: Voter Turnout in the 2012 General Election
Estimate Std. Error t value Pr(>|t|)
(Intercept) 1.220 0.068 17.911 9.62E-72
Age -0.030 0.002 -16.565 1.24E-61
Black 0.008 0.028 0.295 7.68E-01
Indian -0.144 0.062 -2.312 2.08E-02
Asian 0.006 0.049 0.127 8.99E-01
Mixed -0.023 0.018 -1.256 2.09E-01
Hispanic 0.018 0.019 0.906 3.65E-01
Preregistered 0.392 0.026 15.176 5.13E-52
16 Table 2: Voter Turnout in the 2014 Midterm Election
Estimate Std. Error t value Pr(>|t|)
(Intercept) 0.533 0.058 9.118 7.64E-20
Age -0.011 0.001 -8.122 4.60E-16
Black -0.017 0.018 -0.983 3.26E-01
Indian -0.118 0.050 -2.369 1.78E-02
Asian -0.040 0.032 -1.256 2.09E-01
Mixed -0.046 0.012 -3.931 8.45E-05
Hispanic -0.024 0.014 -1.758 7.87E-02
Preregistered 0.445 0.041 10.866 1.67E-27
17 Table 3: Voter Turnout in the 2016 General Election Coefficients:
Estimate Std. Error t value Pr(>|t|)
(Intercept) 0.604 0.079 7.634 2.27E-14
Age -0.010 0.002 -4.430 9.44E-06
Black -0.020 0.026 -0.776 4.38E-01
Indian -0.154 0.059 -2.619 8.82E-03
Asian 0.016 0.047 0.328 7.43E-01
Mixed -0.022 0.016 -1.334 1.82E-01
Hispanic 0.013 0.019 0.676 4.99E-01
Preregistered 0.491 0.022 21.893 3.03E-106
N=4,166,727
18
odds are 63% higher (exp(.491)=1.63). In line with my hypothesis, the results suggest that preregistered voters are more likely than non-preregistered voters to turn out.
Next, we consider the predicted probabilities of youth turnout. Figures 8-10 show predicted probabilities of voter turnout for voters aged 18-23, with red dashes indicating 95% confidence intervals for preregistered voters and dark blue dashes indicating 95% confidence intervals for all other voters:
19
Figure 9: Predicted Probability of Voting in 2014
20
Because of the large sample size (between 3 and 4 million voters across each election), confidence intervals are very tight. Some obvious trends across elections are 1.) predicted probabilities of turnout are much higher for preregistered voters than
non-preregistered voters and 2.) predicted probabilities of turnout seem to decrease with age. The results appear to support my hypothesis that preregistration would have a positive effect on turnout: Focusing first on the 2012 election, we see that the predicted probability of turnout among 18-year-olds is about 34% higher for preregistered voters than those who were not preregistered (90% vs 56%). This gap increases with age: For 23-year-olds, the predicted probability of turnout among preregistered voters is about 86%, while it is about 40% for other voters (a 46% gap). Generally, as age increases from 18 to 23, the predicted probability of turnout decreases across both groups. These findings are surprising given research that finds age has a positive effect on turnout (Highton and Wolfinger 2001; Highton 2000).
One possible explanation for this reduction in turnout across age could be the inaccessibility of preregistration for those aged 20-23 in the 2012 election. Because preregistration was made accessible for 16 and 17-year-olds in 2010, then 18 and 19-year-olds in 2012 would have been exposed to this reform. Older voters, however, were not exposed. Predicted probabilities for both groups, and especially for non-preregistered voters, would decrease with age.
In the 2014 election, we see similar relationships: Preregistered voters are more likely than non-preregistered voters to turnout, and turnout rates decrease with age. As age
increases from 18 to 23, the predicted probability of preregistered voters turning out
21
between preregistered and non-preregistered voters increased with age). Again, the difference in predicted turnout across groups supports my hypothesis. The negative relationship
between age and turnout here can again possibly be explained by the unavailability of preregistration for older voters. Since 22 and 23-year-olds in the 2014 election did not have access to preregistration, the general relationship between age and turnout (when
preregistration is controlled for) could be negative.
Finally, looking at the 2016 general election, the results seem to support my hypothesis. We again see that preregistered voters were more likely to turn out than non-preregistered voters. Among non-preregistered voters, as age increases from 18 to 23, the predicted probability of turnout decreases only from 89% to 87%. Meanwhile, among other voters, this probability decreases from 43% to 38%. Again, there is a negative relationship between age and turnout, though this negative relationship is not as large as in previous elections. Preregistration likely does not explain this trend, as 20 to 23-year-olds in 2016 were exposed to preregistration when they were 16 or 17-years-old. One possible explanation for this slight decrease, however, is the increased salience of a general election campaign for 18-year-olds in 2016. Unlike 18-year-olds in 2012 and 2014, 18 -year-olds in 2016 were not exposed to preregistration when they were 16 or 17-years-old, as the reform had been removed between 2014-2016. Their entrance into the political system in North Carolina therefore began when they turned 18, rather than 16 or 17 (Griffin and Newman 2012; Quale Hill and Leighley 1994). Because their entrance into the political system began at a
22 Conclusion
Though previous research has questioned the effectiveness of institutional reforms on turnout (Burden et al. 2014; Berinsky 2005), this study finds that preregistration generally has a positive effect on the likelihood of turnout in North Carolina. Unlike other studies on preregistration (Hillygus and Holbein 2015; McDonald and Thornburg 2010), this paper applies logit models and predicted probabilities to determine the effects of preregistration in North Carolina. Across elections between 2012 and 2016, preregistered voters were much more likely to vote than those who were not preregistered, with the effect of preregistration on turnout generally decreasing with age.
Although this research suggests a positive relationship between preregistration and turnout, the method does not imply a causal relationship. Preregistered voters, for instance, might be more likely to vote than non-preregistered voters simply because of higher political interest, so other mechanisms might be at play. Future research could address this issue by applying causal models to the data. Further, this study’s theory argues that preregistration is effective because it is supported by other institutions that promote engagement:
23
history data from other states to run a comparative analysis of preregistration’s impact on turnout across a series of elections.
Overall, this research demonstrates the significance of preregistration on electoral turnout. This study contributes to the existing literature by leveraging a specific electoral reform in North Carolina and controlling for factors that vary within a state (such as demographics and county-level variables), rather than running a broader, comparative analysis found in McDonald and Thornburg’s (2010) study. In practice, these findings may be pertinent to policymakers considering the implications of statewide electoral reforms on youth turnout.
24
REFERENCES
Aldrich, J., J. Montgomery, and W. Wood. 2010. “Turnout as a Habit.” Political Behavior 33(4): 535-563.
Alvarez RM and Antonsson EK. 2007. “Bridging Science, Technology, and Politics in Election Systems.” Bridge 37:6–10.
Berinsky, A. 2005. “The Perverse Consequences of Electoral Reform in the United States.” American Politics Research 33(4).
Bryan, C. G. M. Walton, T. Rogers, and C. S. Dweck. 2011. “Motivating Voter Turnout by Invoking the Self.” Proceedings of the National Academy of Sciences 108(31): 12653–12656.
Burden, B, D. Canon, K Mayer, and D. Moynihan. 2014. “Election Laws, Mobilization, and Turnout: The Unanticipated Consequences of Election Reform.” American Journal of Political Science 58(1): 95-109.
Clark, C. 2014 “Collective Descriptive Representation and Black Voter Mobilization in 2008.” Political Behavior 36(2): 315-333.
Delli Carpini, M. and S. Keeter. 1996. What Americans Know About Politics and Why It Matters. New Haven: Yale University Press.
Downs, A. 1957. “An Economic Theory of Political Action in a Democracy.” Journal of Political Economy 65(2): 135-150.
Fieldhouse, E. and D. Cutts. 2012. “The Companion Effect: Household and Local Context and the Turnout of Young People. The Journal of Politics 74(03): 856-869.
Fry, R. 2016. “Millennials Match Baby Boomers as Largest Generation in U.S. Electorate, But Will They Vote?” Pew Research Foundation.
Gerber, A. and D. Green. 2000. “The Effects of Canvassing. Telephone Calls, and Direct Mail on Voter Turnout: A Field Experiment.” American Political Science Review 94(3): 653-663.
Giammo, J. and B. Brox. 2010. “Reducing the Costs of Participation: Are States Getting a Return on Early Voting?” Political Research Quarterly 63(2): 295-303.
Griffin, J. and B. Newman. 2012. “Voting Power, Policy Representation, and Disparities in Voting’s Rewards.” Journal of Politics 75(1): 52-64.
25
Herron, Michael and D. Smith. 2014. “Race, Party, and the Consequences of Restricting Early Voting in Florida in the 2012 General Election.” Political Research Quarterly 67(3): 646-665.
Highton, B. 2000. “Residential Mobility, Community Mobility, and Electoral Participation.” Political Behavior 22(2): 109-120.
Highton, B. 2004. “Voter Registration and Turnout in the United States.” Perspectives on Politics 2(3): 507-515.
Highton, B. and R. Wolfinger. 2001. “The Political Implications of Higher Turnout.” British Journal of Political Science 31(1): 179-192.
Hillygus, D. and J. Holbein. 2015. “Making Young Voters: The Impact of Preregistration on Youth Turnout.” American Journal of Political Science 60(2): 364-382.
Hillygus, S. and T. Shields. 2008. The Persuadable Voter: Wedge Issues in Presidential Campaigns. Princeton: Princeton University Press.
Jakee, K. and Guang-Zhen S. 2006. “Is Compulsory Voting More Democratic?” Public Choice 129(1): 61-75.
Keeter, S., J. Horowitz, A. Tyson. 2008. “Young Voters in the 2008 Election.” Pew Research Center.
Knack, S. and J. White. 2000. “Election-Day Registration and Turnout Inequality.” Political Behavior 22(1): 29-44.
Lijphart, A. 1997. “Unequal Participation: Democracy’s Unresolved Dilemma.” American Political Science Review 91(1): 1-14.
Markey, J. 2004. U.S. Congressional Record, Volume 150, Number 103.
McDonald, M. and M. Thornburg. 2010. “Registering the Youth Through Voter Preregistration.” NYU Journal of Legislation and Public Policy 13: 551-570. Meredith, M. 2009. “Persistence in Political Participation.” Quarterly Journal of Political
Science 4(3): 187–209.
Mycoff, J. D., Wagner, M., and Wilson, D. 2009. “The Empirical Effects of Voter-ID Laws: Present or Absent?” PS: Political Science & Politics 42(1): 121-126.
26
North Carolina State Board of Elections. “Voter Registration FAQ.” Oregon Secretary of State. 2016. “Oregon Motor Voter Act FAQ.”
Plutzer, E. 2002. “Becoming a Habitual Voter: Inertia, Resources, and Growth in Young Adulthood.” American Political Science Review 96(1): 41–56.
Quaile Hill, K. and J. Leighley. 1994. “Mobilizing Institutions and Class Representation in U. S. State Electorates.” Political Research Quarterly 47(1): 137-150.
Rosenstone, S. and J. Hansen. 1993. Mobilization, Participation, and Democracy in America. New York: MacMillan Pub. Co.
Shino, E. and D. Smith. 2018. “Timing the Habit: Voter Registration and Turnout.” Electoral Studies 51: 72-82.
Springer, M. 2014. How the States Shaped the Nation: American Electoral Institutions and Voter Turnout, 1920–2000. Chicago: University of Chicago Press.
Ulbig, S. and T. Waggener. 2011. “Getting Registered and Getting to the Polls: The Impact of Voter Registration Strategy and Information Provision on Turnout of College Students.” PS: Political Science and Politics 44(3): 544-551.
U.S. Census. 2014. “Young-Adult Voting: An Analysis of Presidential Elections, 1964-2012.”
Verba, S., K. Schlozman, and H. Brady. 1995. Voice and Equality: Civic Voluntarism in American Politics. Cambridge: Harvard University Press.