Journal of Instrumentation
OPEN ACCESS
Commissioning of the vacuum system of the
KATRIN Main Spectrometer
To cite this article: M. Arenz et al 2016 JINST 11 P04011
View the article online for updates and enhancements.
Related content
Results of the first Cool-down of the KATRIN Cryogenic Pumping Section Carsten Röttele
-Background processes in the KATRIN main spectrometer
F.M. Fraenkle and KATRIN collaboration
-The Vacuum Chamber of a Tokamak Plasma Experiment (TFR)
Z. Sledziewski, M. Huguet, P. H. Rebut et al.
-Recent citations
A novel conical reflector and arc transition tube of turbomolecular pump
K. Sun et al
-Impact of a cryogenic baffle system on the suppression of radon-induced background in the KATRIN Pre-Spectrometer S. Görhardt et al
-The KATRIN superconducting magnets: overview and first performance results M. Arenz et al
-2016 JINST 11 P04011
Published by IOP Publishing for Sissa MedialabReceived:March 3, 2016
Accepted:March 25, 2016
Published:April 7, 2016
Commissioning of the vacuum system of the KATRIN Main
Spectrometer
The Katrin collaboration
M. Arenz,aM. Babutzka,bM. Bahr,cJ.P. Barrett,dS. Bauer,eM. Beck,f A. Beglarian,g J. Behrens,eT. Bergmann,gU. Besserer,hJ. Blümer,iL.I. Bodine,jK. Bokeloh,e J. Bonn,i,f,1 B. Bornschein,hL. Bornschein,iS. Büsch,kT.H. Burritt,j S. Chilingaryan,gT.J. Corona,l L. De Viveiros,cP.J. Doe,jO. Dragoun,mG. Drexlin,bS. Dyba,e S. Ebenhöch,iK. Eitel,i E. Ellinger,nS. Enomoto,jM. Erhard,bD. Eversheim,aM. Fedkevych,e A. Felden,i S. Fischer,hJ.A. Formaggio,d F. Fränkle,i,lD. Furse,d M. Ghilea,c W. Gil,iF. Glück,i
A. Gonzalez Ureña,oS. Görhardt,iS. Groh,bS. Grohmann,hR. Grössle,hR. Gumbsheimer,i M. Hackenjos,hV. Hannen,eF. Harms,bN. Haußmann,nF. Heizmann,bK. Helbing,nW. Herz,h S. Hickford,nD. Hilk,bB. Hillen,eT. Höhn,i B. Holzapfel,hM. Hötzel,bM.A. Howe,lA. Huber,i A. Jansen,iN. Kernert,iL. Kippenbrock,j M. Kleesiek,bM. Klein,bA. Kopmann,g
A. Kosmider,iA. Kovalík,mB. Krasch,hM. Kraus,bH. Krause,iM. Krause,bL. Kuckert,b B. Kuffner,iL. La Cascio,bO. Lebeda,mB. Leiber,iJ. Letnev,qV.M. Lobashev,r,1A. Lokhovr E. Malcherek,iM. Mark,i E.L. Martin,j S. Mertens,s,iS. Mirz,hB. Monreal,c K. Müller,i
M. Neuberger,k H. Neumann,hS. Niemes,hM. Noe,hN.S. Oblath,dA. Off,hH.-W. Ortjohann,e A. Osipowicz,qE. Otten,f D.S. Parno,j P. Plischke,iA.W.P. Poon,sM. Prall,eF. Priester,h P.C.-O. Ranitzsch,eJ. Reich,iO. Rest,eR.G.H. Robertson,jM. Röllig,hS. Rosendahl,e S. Rupp,hM. Ryšavý,mK. Schlösser,iM. Schlösser,h,oK. Schönung,hM. Schrank,i J. Schwarz,iW. Seiler,q H. Seitz-Moskaliuk,bJ. Sentkerestiová,mA. Skasyrskaya,r M. Slezák,mA. Špalek,mM. Steidl,iN. Steinbrink,eM. Sturm,hM. Suesser,hH.H. Telle,o,p T. Thümmler,iN. Titov,r I. Tkachev,r N. Trost,i A. Unru,qK. Valerius,iD. Vénos,m
R. Vianden,aS. Vöcking,i,e B.L. Wall,j N. Wandkowsky,i M. Weber,gC. Weinheimer,e C. Weiss,k S. Welte,hJ. Wendel,hK.L. Wierman,lJ.F. Wilkerson,lD. Winzen,eJ. Wolf,b,2 S. Wüstling,gM. Zacher,eS. Zadoroghnyr and M. Zbořile,m
1Deceased.
2016 JINST 11 P04011
aHelmholtz-Institut fuer Strahlen- und Kernphysik, University Bonn, Nussallee 14-16, 53115 Bonn, GermanybInstitute of Experimental Nuclear Physics (IEKP), Karlsruhe Institute of Technology (KIT),
Wolfgang-Gaede-Str. 1, 76131 Karlsruhe, Germany
cDepartment of Physics, University of California at Santa Barbara, Santa Barbara, CA 93106, U.S.A.
dLaboratory for Nuclear Science, Massachusetts Institute of Technology,
77 Massachusetts Ave, Cambridge, MA 02139, U.S.A.
eInstitut für Kernphysik, Westfälische Wilhelms-Universität Münster,
Wilhelm-Klemm-Str. 9, 48149 Münster, Germany
fInstitut für Physik, Johannes-Gutenberg-Universität Mainz, 55099 Mainz, Germany
gInstitute for Data Processing and Electronics (IPE), Karlsruhe Institute of Technology (KIT),
Hermann- von-Helmholtz-Platz 1, 76344 Eggenstein-Leopoldshafen, Germany hInstitute for Technical Physics (ITeP), Karlsruhe Institute of Technology (KIT),
Hermann- von-Helmholtz-Platz 1, 76344 Eggenstein-Leopoldshafen, Germany iInstitute for Nuclear Physics (IKP), Karlsruhe Institute of Technology (KIT),
Hermann-von-Helmholtz-Platz 1, 76344 Eggenstein-Leopoldshafen, Germany
jCenter for Experimental Nuclear Physics and Astrophysics, and Dept. of Physics, University of Washington,
Seattle, WA 98195, U.S.A.
kProject, Process, and Quality Management (PPQ), Karlsruhe Institute of Technology (KIT),
Hermann- von-Helmholtz-Platz 1, 76344 Eggenstein-Leopoldshafen, Germany
lDepartment of Physics and Astronomy, University of North Carolina, Chapel Hill, NC 27599, U.S.A.
mNuclear Physics Institute of the CAS, v. v. i., CZ-250 68 Řež, Czech Republic
nDepartment of Physics, Faculty of Mathematics und Natural Sciences, University of Wuppertal,
Gauss-Str. 20, D-42119 Wuppertal, Germany
oUniversidad Complutense de Madrid, Instituto Pluridisciplinar,
Paseo Juan XXIII, no1, 28040 - Madrid, Spain
pDepartment of Physics, Swansea University, Singleton Park, Swansea SA2 8PP, United Kingdom
qUniversity of Applied Sciences (FH) Fulda, Leipziger Str. 123, 36037 Fulda, Germany
rAcademy of Sciences of Russia, Institute for Nuclear Research,
60th October Anniversary, Prospect 7a, 117312 Moscow, Russia
sInstitute for Nuclear and Particle Astrophysics and Nuclear Science Division,
Lawrence Berkeley National Laboratory, Berkeley, CA 94720, U.S.A.
2016 JINST 11 P04011
Abstract: The KATRIN experiment will probe the neutrino mass by measuring the β-electronenergy spectrum near the endpoint of tritiumβ-decay. An integral energy analysis will be performed by an electro-static spectrometer (“Main Spectrometer”), an ultra-high vacuum vessel with a length of 23.2 m, a volume of 1240 m3, and a complex inner electrode system with about 120 000 individual
parts. The strong magnetic field that guides the β-electrons is provided by super-conducting solenoids at both ends of the spectrometer. Its influence on turbo-molecular pumps and vacuum gauges had to be considered. A system consisting of 6 turbo-molecular pumps and 3 km of non-evaporable getter strips has been deployed and was tested during the commissioning of the spectrometer. In this paper the configuration, the commissioning with bake-out at 300◦C, and the
performance of this system are presented in detail. The vacuum system has to maintain a pressure in the 10−11mbar range. It is demonstrated that the performance of the system is already close to these
stringent functional requirements for the KATRIN experiment, which will start at the end of 2016.
2016 JINST 11 P04011
Contents
1 Introduction 1
2 The KATRIN experiment 4
2.1 The Source and Transport Section 4
2.2 The Spectrometer and Detector Section 4
3 The vacuum system of the Main Spectrometer 7
3.1 The vacuum vessel 7
3.2 The vacuum pumps 9
3.3 The vacuum gauges 10
3.4 The in-beam valves 11
3.5 Vacuum and spectrometer operation 12
4 Simulation of the vacuum system 13
4.1 Simulation of hydrogen 14
4.2 Simulation of radon 15
5 Commissioning of the vacuum system and status after bake-out 16
5.1 Pump down and leak tests 16
5.2 Bake-out procedure 16
5.3 Vacuum performance after baking 19
5.4 Activation of the NEG pumps 21
5.5 Estimation of the outgassing rate 22
6 Preparations for first spectrometer measurements 23
6.1 Locating a leak in the beam-line valve 24
6.2 Argon venting of the spectrometer 25
6.3 Vacuum performance during spectrometer measurements 27
7 Conclusions 28
A Estimation of the RGA calibration constants 30
1 Introduction
The KArlsruhe TRItiumNeutrino experiment (KATRIN) is designed to determine the effective
mass of electron anti-neutrinos with an unprecedented sensitivity of 0.2 eV/c2 at 90% CL. This
2016 JINST 11 P04011
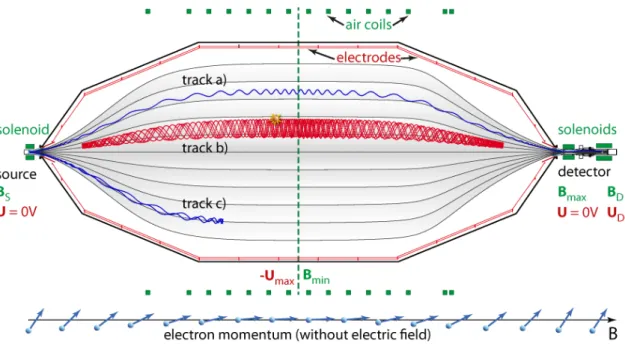
Figure 1. The principle of a MAC-E-Filter. The shaded area marks the magnetic flux tube connecting the
source with the detector. The dashed line at the center indicates the “analyzing plane” of the MAC-E-Filter, where the magnetic field is at its minimum Bmin and the electrostatic potential barrier at its maximum
(−Umax). Electrons, originating from the source, are magnetically guided against the electrostatic retarding
field towards the detector. Track a) is the trajectory of an electron with enough kinetic energy to overcome the retarding potential (cyclotron radius not to scale). The electron following track c) has less energy and is reflected back to the source. Track b) belongs to a magnetically trapped electron that has been created inside the MAC-E-Filter, for instance by a radioactive decay. The arrows at the bottom indicate the direction of the momentum of an electron relative to the guiding magnetic field line. The inhomogeneous field transforms transverse momentum into longitudinal momentum and back.
β-decay [1,2]. The analysis is focused on the last few eV below the 18.6 keV endpoint of the β -spectrum. An integrating, electrostatic spectrometer of MAC-E-Filter1type [3,4] can provide high energy resolution with a wide open solid angle acceptance for β-electrons, emitted isotropically in the tritium source. This technique has been successfully employed with different types of tritium sources in the Mainz and Troitsk experiments, which provide the most stringent, model-independent limits on the effective neutrino mass [5–8]:
m(ν¯e) = v
u
t 3
X
i=1
|Ue2i| ·mi2<2 eV/c2 (95%C.L.). (1.1)
The effective massm(ν¯e)is the incoherent sum of the three neutrino mass eigenstatesmi, weighted with the mixing matrix coefficientsUei [9].
The main features of a MAC-E-filter are illustrated in figure1. Theβ-electrons are adiabatically guided by strong magnetic fields from their point of origin in the tritium source (BS) through the
MAC-E-filter. The superconducting solenoids at both ends provide the magnetic guiding field. For the KATRIN Main Spectrometer additional air coils induce a weak guiding field at the center of
2016 JINST 11 P04011
the spectrometer, and compensate for distortions by the earth magnetic field, as well as fringe fieldsof the solenoids and residual magnetization. The electrons move along the field lines in cyclotron motions, allowing for an accepted solid angle of almost 2π. On their way to the central plane (“analyzing plane”) of the spectrometer, the magnetic field drops by several orders of magnitude to Bmin. Due to the slowly varying field, the transverse momentum of the cyclotron motion is
adiabatically transformed into longitudinal momentum, parallel to the field lines. In short, the
magnetic adiabatic transformationtransforms the isotropically emitted β-electrons at the source
into a broad, parallel beam of electrons at the center of the MAC-E-filter.
With both ends at ground potential and a high negative electric potential at its center (−Umax),
the MAC-E filter works as an electrostatic high-pass energy filter, reflecting all electrons with energies below the retarding potential (figure 1, track c). All other electrons are accelerated again towards the far end of the spectrometer, where they are counted by a detector (figure 1, track a). An optional positive potential at the detector (UD) can accelerate the electrons further, shifting their
energy further away from the low energy ambient background radiation. The energy spectrum is measured by varying the retarding voltage around the endpoint energy of the β-spectrum. The energy resolution of the MAC-E-filter is limited by the remaining transverse energy of the cyclotron motion, which cannot be analyzed with the retarding potential. Assuming the conservation of the magnetic moment of the cyclotron motion, the energy resolution is defined by the ratio of the weak magnetic fieldBminat the analyzing plane and the strongest magnetic fieldBmaxalong the trajectory
of an electron with energyEe[4]:
∆E= Bmin
Bmax ·Ee. (1.2)
With a count rate of 10−2counts per second (cps) in the last eV below the endpoint of theβ-spectrum,
the KATRIN experiment requires not only higher statistics and improved energy resolution, but also aims for a low total background rate of similar size, in order to achieve an order-of-magnitude improvement inm(ν¯e)sensitivity.
A major source of background can arise from keV-range electrons originating from the radioac-tive decays of neutral atoms or molecules inside the spectrometer volume, such as radon [10,11] and tritium [12]. If the decays occur within the magnetic flux tube inside the spectrometer, many of these primary electrons can be trapped by the magnetic mirror effect (figure 1, track b). The trapped electrons circulate inside the spectrometer for hours, until they have lost enough energy through ionization of residual gas molecules to leave the trap. The low-energy secondary electrons can leave the trap through either end of the spectrometer. Being accelerated by the retarding potential of the spectrometer, about half of them can reach the detector with exactly the same energy as the signal electrons from tritium decay, thereby increasing the background rate. The number of secondary electrons produced depends on the energy of the primary electron. The storage time, and thus the background rate, depend on the pressure in the spectrometer volume. Therefore the vacuum system of the KATRIN experiment [13] is a key component for reducing this kind of background. Most of the few tritium molecules that reach the spectrometer can be pumped out before their decay (half-life: 12.1 years). Short-lived isotopes, such as219Rn with a half-life of 4 s, are more
likely to decay inside the spectrometer. A pressure of 10−11mbar is needed in order to extend the
2016 JINST 11 P04011
The subjects of this paper are the commissioning of the complete Main Spectrometer vacuumsystem in the first half of 2013, the conditioning of the large vessel by vacuum-baking, various remedies for technical problems that were encountered and the vacuum performance during the first electron measurements with the MAC-E-filter system. The next section provides a short overview of the KATRIN experiment. Section3describes the vacuum system of the Main Spectrometer. In section4the vacuum simulations, needed for the interpretation of the measured data, are described. Section5gives an account of the bake-out procedure of the spectrometer and explains the methods used to quantify the performance of the vacuum system. It is followed by section6, describing the solution for the problem of a defective valve, which led to the venting of the whole spectrometer with ultra-clean argon to prevent deactivating the NEG pumps. Finally we draw some conclusions on the lessons learned in section7.
2 The KATRIN experiment
The main components of the KATRIN experiment [1] are shown in figure2. The 70 m long system, currently under construction at the Karlsruhe Institute of Technology (KIT), can be subdivided into
theSource & Transport Section(STS), where the tritium decays take place, and the Spectrometer
& Detector Section(SDS), where the energies of the decay electrons are measured.
2.1 The Source and Transport Section
The STS has four main components. The central part is theWindowless Gaseous Tritium Source (WGTS), where molecular tritium gas is injected at the center of a 10 m long, 90 mm diameter tube, and where most of the β-decays take place. The β-activity inside the source tube will be around 1011Bq. The tube is differentially pumped at both ends by turbo-molecular pumps (TMP),
which remove 99% of the gas. The tritium is recirculated through a closed loop system [15,16]. At the rear end of the WGTS, theCalibration and Monitoring System(CMS) measures the tritium activity by monitoring the flux of incoming β-electrons. In addition it provides mono-energetic electrons from an electron source with well-defined energy and emission angle for the calibration of the experiment [17]. Between the WGTS and the spectrometer section two additional pumping systems remove most of the remaining tritium gas, reducing the total flux by a factor of more than 1014. The first stage is again aDifferential Pumping Section(DPS), using TMPs [18]. The second
stage is a Cryogenic Pumping Section (CPS), where cryosorption on argon frost at 3 K is used to capture tritium molecules [19, 20]. Throughout the STS superconducting solenoids produce magnetic fields between 0.5 and 5.6 T, guiding around 1010 β-electrons per second adiabatically to
the spectrometer and detector section.
2.2 The Spectrometer and Detector Section
The SDS consists of three main components, thePre-Spectrometer (PS) with a moderate energy resolution of 70 eV, followed by the Main Spectrometer (MS), where the energy of electrons is analyzed with a resolution of 0.93 eV, and theFocal Plane Detector(FPD), which counts electrons that have passed the retarding voltages of both MAC-E-Filters.
2016 JINST 11 P04011
Figure 2. Overview of the 70-m-long KATRIN experiment: calibration and monitoring system (CMS),
windowless gaseous tritium source (WGTS), differential pumping section (DPS), cryogenic pumping section (CPS), Pre-Spectrometer (PS), Main Spectrometer (MS), focal plane detector (FPD). For better clarity the Main Spectrometer is shown without the surounding magnetic air coil system.
the MS by seven orders of magnitude to about 103electrons per second. The magnetic guiding field
of the MAC-E-filter is induced by 4.5 T superconducting solenoids at both ends of the spectrometer. The vacuum vessel of the PS, with a diameter of 1.7 m and a length of 3.4 m, served as a prototype for the vacuum system of the MS. The vacuum system of the PS uses a combination of
non-evaporable-getter(NEG) pumps made of 90 m of 30 mm wide SAES St707® NEG strips and two TMPs [21],
providing a base pressure of 10−11mbar. The vacuum pumps also reduce the small incoming flux
of tritiated molecules from the STS to the MS by another two orders of magnitude. Although the NEG strips have been identified as a major source of radon-related background [10], there is no alternative pumping concept with which to obtain the huge pumping speed needed to operate the MS, since helium-cooled cryogenic pumps have much higher operating costs. However, the tests with the PS showed that LN2 cooled baffles in front of the getter pumps are able to suppress the
Rn-induced background effectively.
The high energy resolution of the MS of 0.93 eV at 18.6 keV requires a ratio between Bmin
andBmax(see eq. (1.2) and figure1) of 1:20 000. The magnetic guiding field is generated by two
superconducting solenoids at the detector side at 6 T and 3.5 T, respectively. At the other end a 4.5 T solenoid is shared between the MS and the PS. In addition the MS is surrounded by a system of air-coils with a diameter of 12.6 m. It compensates for the earth magnetic field and solenoid fringe fields, and confines the flux-tube of the magnetic guiding field inside the volume of the MS [22]. Together these components generate a field layout with a very high degree of axial symmetry, which provides magnetic shielding for low energy electrons emitted from the spectrometer walls, reducing cosmic-ray-induced background by a factor of 105[23].
The requirement of adiabatic electron transport with a slowly varying B-field in the MAC-E filter, and the cross section of the magnetic flux-tube at the analyzing plane, which scales inversely with the field strength, imply a very large MS (see figure3). The stainless steel (316LN) vacuum vessel has a total length of 23.2 m, a diameter of 9.8 m and a weight of 200 t.
2016 JINST 11 P04011
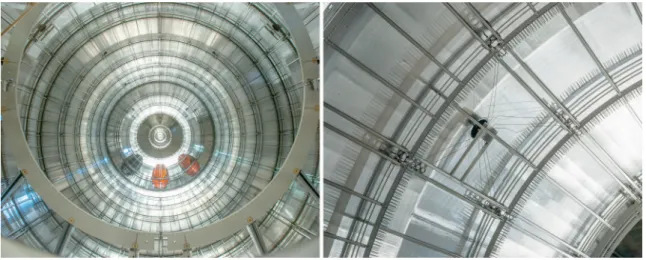
Figure 3. Left: arrival of the KATRIN Main Spectrometer vacuum vessel at the Karlsruhe Institute of
Technology. One of the 50-cm-long DN200 ports is indicated. Right: location of the main vacuum pumps in one of the three pump ports.
that are formed from titanium sheet metal are maintained at the vessel potential. These so-called anti-Penning electrodes act as shielding in the high-field region to prevent deep Penning traps from forming.
The wire-electrode system consists of 23,440 individually insulated wires (see figure 4). It is used for fine-tuning the electrostatic field, preventing Penning traps, and providing the axial symmetry of the field [25]. With the wires being at a potential that is 100 V lower than the vessel, the system is also responsible for the electrostatic rejection of electrons created by cosmic muons or radioactive decays at the wall of the vessel. The wires are strung on 248 stainless steel frames (“modules”). In most of these electrode modules the wires are strung in two layers. In addition the electrode system is subdivided both in the axial direction and in the vertical direction into several sections. This allows for a gradual adjustment of the electric potential in the axial direction, and for applying short dipole pulses regularly to remove magnetically trapped electrons from the MS. Modules belonging to the same section share the same voltages for their wire layers. Each section contains between 4 and 50 modules.
The high voltage vacuum feedthroughs are mounted at DN200 ports above the different sections. Inside the vacuum volume, the feedthroughs are connected with 1.5-mm diameter stainless steel (Inconel®) wires to the insulated connectors at the distribution panels that are attached to the
frames of the electrode modules underneath the respective ports. Copper-beryllium (CuBe) rods with a diameter of 3 mm distribute the voltages from the distribution panels to the corners of the first module of a section, where further distributions to neighboring modules are achieved via spring-loaded contacts and short wires.
2016 JINST 11 P04011
Figure 4. Left: view of the complete wire-electrode system as seen from the beam-line flange at the source end of the MS. At the far end the three pump ports with the LN2baffles are visible. Right: voltage
distribution to the corners of an electrode module from the distribution panel underneath a flange with electrical feedthroughs.
When the electrons leave the MS, the FPD system [32] takes them from the exit of the MS to the primary KATRIN detector, a 148-pixel p-i-n-diode array on a monolithic silicon wafer. The dartboard-pattern pixelation scheme allows the separate analysis of different regions of the analyzing plane. The system contains electron and gamma calibration sources, as well as two superconducting solenoids to complete the MAC-E filter of the MS and to focus electrons onto the detector wafer. A post-acceleration electrode allows the signal electron energy to be elevated by up to 10 keV. The FPD vacuum system is divided into two independent regions: an external high-vacuum region containing the front-end electronics, and an internal UHV region, which contains the detector and couples to the MS vacuum via an all-metal DN250 gate valve followed by an in-beam valve (see section3.4). After roughing and bakeout, the vacuum in each region is maintained by a dedicated cryopump.
3 The vacuum system of the Main Spectrometer
3.1 The vacuum vessel
The design goals of the Main Spectrometer vacuum system are to maintain a pressure in the lower 10−11mbar regime during the entire 5-year lifetime of the KATRIN experiment, as well as
suppressing tritium and radon induced background. The vessel has a volume of 1240 m3 and an
inner surface area of 690 m2. The inner wire electrode system, with a total of 120,000 individual
parts, adds another 532 m2 of stainless steel parts to the inner surface, increasing the total surface
area to 1222 m2. An overview of the principal construction materials and the respective surface
areas of the MS components is given in table1.
The outgassing rate of this large surface is the limiting factor for the ultimate pressure in the MS. Measurements with the pre-spectrometer showed that a hydrogen outgassing rate of 10−12mbar·
`/s·cm2 can be reached for 316LN stainless steel, after electro-polishing, cleaning, and vacuum baking at temperatures of at least 200◦C. The cleaning process of the MS involved pickling,
2016 JINST 11 P04011
Ground Potential
High Voltage: 18600 V
NEG ST707 (1000 m) (cryo) LN2 baffle
Pump port 1
flange for leak detector
RGA
CF40 (M)
Wide range BA / Pirani CF100 (V)
TMP 300 l/s KF40 (V) KF40 (V) KF25 (V) Scroll Pump 30 m3/h
Pirani Extractor IE 514 CF100 (V) gas ballast Leybold TMP
MAG W 2800 CF250 (M)
CF40 (V)
CF40 (M)
KF25 (V) KF25 (V) Pump port 3
NEG ST707 (1000 m) LN2 baffle Insulator air Leybold TMP MAG W 2800
CF40 (M) CF160 (V) CF63 (M) CF160 (M) Dry fore-pump ISO K-100 KF40 (V) Screw pump
630 m3
/h ISOK-63 FilterVenting KF40 (V) gas ballast
Pirani Baratron InvMag
Insulator M CF63 (M) leak valve calibrated He leak CF250 (M) CF40 (V) NEG ST707 (1000 m) LN2 baffle gas CF40 (M) Wide range BA / Pirani
Wide range BA / Pirani Pump port 2
Valves: V= viton seal M= metal seal flange for leak detector CF100 (V) TMP 300 l/s KF40 (V) KF40 (V) KF25 (V) Scroll Pump 30 m3
/h Pirani gas ballast KF25 (V) KF25 (V) air leak valve CF100(M) Pirani View port M Flange F10 CF40(M) Flange F9 Extractor IE 514 CF100(M) (top view) MAIN SPECTROMETER Pump port 3 CF200 flanges with HV feedtroughs Pump port 1 Pump port 2 F4 F7 F8 F6 F10 F2 F3 F1 F5 F11 F9
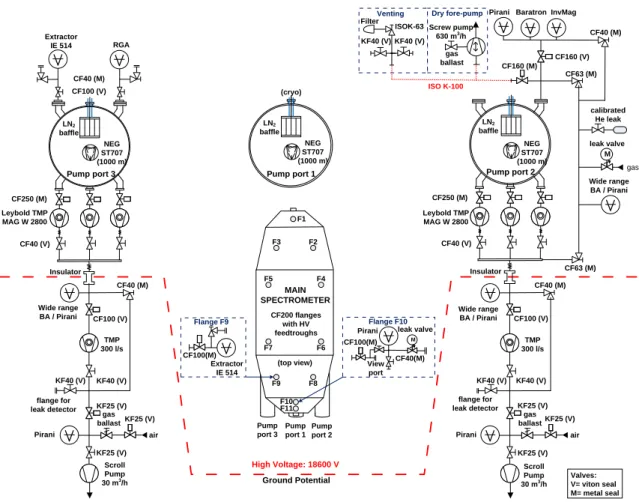
Figure 5. Vacuum scheme of the Main Spectrometer. The Extractor gauges on flange F9 (vessel) and on
pump port P3 were used in the vacuum analysis.
outgassing, such as vacuum firing at high temperatures, could not be applied due to the size of the MS [13]. Most other components, installed inside the MS, were cleaned in similar processes, using ultrasonic baths for the alkaline degreaser and the deionized water. In a final step they were dried in a drying oven at 110◦C for about 12 hours.
Three tubular pump ports, each with a diameter of 1.7 m and a length of approximately 3 m (see figure3), protrude from the detector-facing end of the main vessel. Each pump port is closed with a DN1700 flange, developed and tested with the PS [21]. The flanges are metal-sealed by custom-made double-gaskets. If the innermost gasket developed a leak, the volume between the two gaskets can be pumped down, reducing the leak-rate by up to five orders of magnitude. So far this backup solution has not been needed, since the inner gaskets always stayed leak-tight at temperatures ranging from -20◦C to 350◦C. The spring-energized inner gaskets are made of silver-coated stainless steel
2016 JINST 11 P04011
Table 1. The components inside the Main Spectrometer. This table lists the construction materials of these
components, as well as their surface area and nominal operating temperature. The cold baffles and the NEG strips are not included in the calculation of the outgassing rate.
component material temperature surface
MS vacuum vessel 316 LN 20◦C 690.0 m2
wire electrodes 316 L 20◦C 472 m2
electrode rail system 316 LN 20◦C 58 m2
feedtrough flanges 316 LN 20◦C 2 m2
ceramic insulators Al2O3 20◦C 6 m2
anti-penning electrode Ti 20◦C 11 m2
ground electrodes Al 20◦C 1 m2
cryogenic baffles Cu −187◦C 31 m2
NEG strips St 707 20◦C 180 m2
each, ending with DN250 Conflat (CF) flanges for TMPs, vacuum gauges and feedthroughs for LN2cryogenic lines. The electron beam-lines at the ends of both spectrometers connect to DN500
flanges, which use the same flange design with spring-loaded metal gaskets.
On the upper half of the MS vessel eleven 50-cm-long DN200 ports with CF flanges (see figure3(left) and the vacuum scheme in figure5) provide access to the inner electrode system. On top of the ports 25-cm-long six-way crosses are mounted. The top port of each cross is sealed with a DN200 blank flange, while the four lateral ports with DN40 flanges provide access for feedthroughs for high voltage, internal temperature sensors, and a vacuum gauge (port F9). One of the DN200 blank flanges has been replaced by a gate valve, a sapphire window for laser measurements, and a remotely controlled leak valve for background measurements at elevated pressure (see figure5, port F10). Another blank flange has been replaced by a burst disk rated to 500 mbar.
3.2 The vacuum pumps
Figure 5 shows an overview of the vacuum system. Three custom-made NEG pumps [27] (see figure6), each consisting of 1,000 1-m long SAES St707® getter strips, are mounted on the three
large pump ports. The NEG strips are 30-mm-wide Constantan® strips, which are coated on both
sides with a 27-mm-wide NEG area. Their combined nominal pumping speed for hydrogen is 1,000 m3/s [28]. As mentioned before, the installation of LN2-cooled baffles in front of each getter
pump is necessary for reducing the radon-induced background component by capturing Rn atoms on the cold surfaces. The conductance of the baffles (157 m3/s each) reduces the total effective
pumping speed of the three fully activated NEG pumps for hydrogen to 375 m3/s. With an expected
outgassing rate for stainless steel of 10−12mbar·`/s·cm2[13,21], the ultimate pressure in the main
volume would be 3.2·10−11mbar.
The two outer pump ports are each equipped with three TMPs (Leybold MAG-W-2800®),
2016 JINST 11 P04011
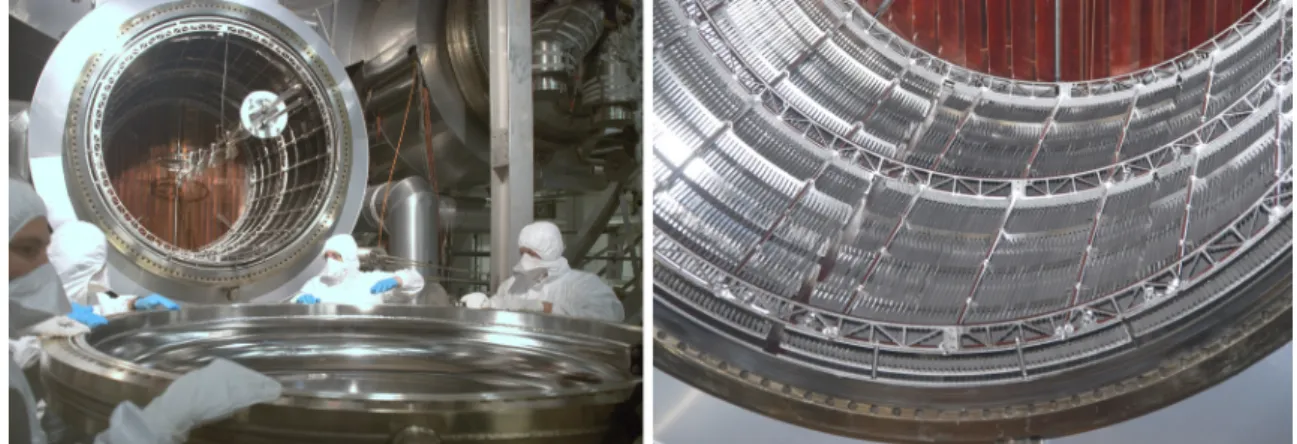
Figure 6. Left: closing of one of the main pump ports with the NEG pump and the cryogenic baffle visible
in the background. Right: a closeup view of the NEG pump with SAES St707 NEG strips installed.
• initial pump-down during commissioning and baking of the vacuum vessel,
• pumping of released hydrogen during NEG activation and
• pumping of non-getterable gases, such as noble gases and methane during standard operation.
The fore-vacuum of each set of three TMPs is produced by a 300`/s TMP backed by a scroll pump. This cascaded setup provides a high enough hydrogen compression ratio for the MS to reach the required pressure regime.
As a roughing pump for the initial pump down a Leybold SP630® screw pump (630 m3/h) is
temporarily connected to one of the pump ports. After reaching 10−2mbar, the TMPs take over,
and reduce the pressure to approximately 10−7mbar. This process takes two to three days. After
reaching this pressure at room temperature the vessel has to be baked at temperatures up to 350◦C to
get rid of water and other contaminants on the inner surfaces, and to activate the NEG pumps. After baking the system, hydrogen outgassing from these surfaces is the limiting factor for the ultimate pressure. A detailed description of the bake-out procedure is given in section5.
3.3 The vacuum gauges
The intermediate vacua between the cascaded TMPs and the fore-vacua, provided by the scroll pumps, are monitored by several wide-range gauges. The ultra-high-vacuum (UHV) pressure level inside the vessel is measured by three ionization gauges and one quadrupole mass spectrometer:
• a Leybold Extractor gauge (IE514®) at the DN200 port F9 (see figure5) on the shallow cone
at the detector end of the main volume,
• a Leybold Extractor gauge at a DN400 port of pump port P3 behind the NEG pump,
• a MKS Inverted Magnetron gauge (HPS 421®) at a DN400 port of pump port P2, serving
mainly as a crosscheck during bake-out and at pressures above 10−5mbar, and
• a MKS Microvision II®quadrupole mass spectrometer (RGA) at a DN400 port of pump port
2016 JINST 11 P04011
Both Extractor gauges have been calibrated against a Bayard-Alpert reference gauge (±10%)for nitrogen, hydrogen, helium and argon at 10−6mbar. An in situ calibration at low pressure
in the Main Spectrometer was not performed due to the scheduling of the electromagnetic test measurements with the MS. The residual gas in the spectrometer was a mixture of different gases. Therefore the pressures are reported, using the nitrogen calibration, if not mentioned otherwise. Gas correction factors relative to the nitrogen calibration have to be applied, if one gas type dominates the mixture. The factors have been determined for both Extractor gauges (F9, P3) for hydrogen (2.2, 2.3), helium (5.6, 5.7), and argon (0.70, 0.71). Another correction factor of 1.06 had to be applied to the Extractor gauge at pump port 3 for the time intervals when the superconducting magnets were turned on, since the sensitivity of ionization gauges is influenced by magnetic fields. The factor was measured by comparing the displayed pressure before and after the magnetic field was switched on. While the gauge at P3 was connected to the pump port volume through a 400-mm-diameter tube, the gauge at F9 was only connected to the main volume through a 40-mm-diameter and 25-cm-long tube, ending in the 50-cm-long DN200 port. With its filaments close to the walls of the tube, and a much lower conductance compared to P3, the lowest pressure measured in F9 was limited by local outgassing, which produced a measured offset in the order of 10−10mbar.
Before and during the bake-out the RGA was used with the built-in Faraday cup detector. At low pressure the sensitivity of the RGA was increased by using the built-in secondary electron multiplier (SEM) detector. The RGA peaks were normalized against the nitrogen-calibrated signal of Extractor gauge P3, which was mounted at a similar location as the RGA in pump port 3. For two gas species an additional correction factor was applied to the peaks: hydrogen (mass 1, 2 and 3), and argon (mass 40, 36, and 20). For all other mass peaks the nitrogen calibration of the Extractor gauge was used. For more details see appendixA. The RGA signal was very sensitive to magnetic fields. Therefore both the Extractor gauge and the RGA were passively shielded by two layers of soft iron tubes that are fabricated from Fe-360 metal sheets. Even with this shielding the magnetic fields affect the amplitude of the measured mass peaks by 10 % to 20 %, depending on the mass. The effects for lower mass peaks are more pronounced. Therefore the RGA spectra, shown in this paper, were taken at times when the magnetic fields were off.
One of the Extractor gauges is mounted at the main volume of the vessel (port F9), while the other one is located in pump port P3 behind the baffle and the NEG pump. Therefore, they measure different pressure values. Their pressure ratio depends on the pumping speed of the NEG pump and on the gas composition. Based on vacuum simulations, described in the following sections, the pressure ratio between these two gauges can be used to estimate the level of activation of the getter pumps (see section5.4). During standard operation with the high voltage switched on, the Extractor gauge at the main vessel (port F9) is switched off, since it produces background electrons that would interfere with the low count-rate measurements. In this case, the pressure inside the main vessel can only be estimated from the value of the Extractor gauge at pump port 3, which is usually a factor of 2 to 5 lower than the actual pressure in the main volume, depending on the level of activation of the NEG pumps.
3.4 The in-beam valves
2016 JINST 11 P04011
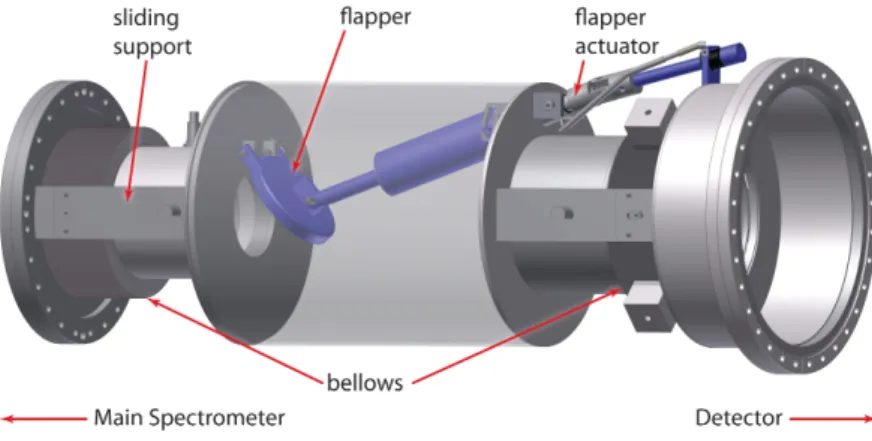
Figure 7. View of the engineering model for the in-beam valve separating the detector system from the MS.
The central body of the valve is transparent to show the flapper mechanism.
custom valves were designed to satisfy several requirements. First, they must be able to temporarily seal the spectrometer at a maximum leak rate of<10−7mbar·`/s helium through the valve. Since
they must be attached to the MS during bake-out, they must tolerate temperatures of up to 200◦C,
and they must accommodate up to 2 cm thermal movement of the spectrometer in addition to spatial adjustments for beam alignment. Finally, when in the open position, the valves must provide unobstructed passage for the electron beam.
Due to the movements of up to 12 cm of the MS vessel, caused by thermal expansion and contraction during the bake-out, both the electron gun and the detector system are disconnected before the start of the bake-out, with both in-beam valves closed. The valves are not intended to provide a long-term solution to isolating the MS. Once the valve is closed, the volume exposed to atmosphere is capped with a CF blanking flange and then evacuated.
An engineering model of the valve separating the MS from the detector system is shown in figure7. The valve between the PS and the MS is similar. Space constraints demanded that the valves fit inside the warm bores of the superconducting magnets at either end of the spectrometer. Edge-welded metal bellows at either end of the valve accommodate MS movement and facilitate alignment. Sliding joints support the body of the valve without impeding the movement of the bellows. The valve closure is a simple, manually operated flapper mechanism. The flapper is sealed by a Kalrez®
O-ring which was chosen for its lower radon emanation compared to Viton®O-rings [33].
3.5 Vacuum and spectrometer operation
During pump down and baking the MS is at ground potential, while for standard operation it is at high potential. Therefore the whole vessel is supported on electrical insulators, on which it can slide freely during the bake-out. All vacuum devices and other equipment directly mounted on the vessel have to be connected to controllers, which are installed in electrically insulated cabinets and powered via an isolation transformer. At both ends of the MS the beam-line is connected through 171-mm-long conical Al2O3ceramic insulators, which are mounted at the central DN500 flanges.
2016 JINST 11 P04011
order to prevent gas discharge, the control system switches off the high voltage if the pressure inone of the insulators rises above 10−4mbar.
The static stray magnetic fields of the superconducting solenoids and air-coils cannot only influence the vacuum gauges, but also the TMPs. The fast-moving all-metal rotors of TMPs are susceptible to heating by eddy currents, induced by the external magnetic fields. The maximum field strength at the location of the MAG W 2800 TMPs is 1.7 mT. The expected rotor temperature of 65◦C
is acceptable and can be tolerated without countermeasures, as extensive tests have shown [29,30]. For the first electro-magnetic test measurements between May and September 2013 a high pre-cision, angular selective electron gun [31] was used, which sent electrons through the spectrometer for counting by the detector at the other end. After bake-out the electron gun and the detector system were connected to the in-beam valves, and evacuated down to approximately 10−10mbar,
before opening the valves to the MS.
4 Simulation of the vacuum system
The performance of the vacuum system has been estimated by detailed simulations of the spec-trometer vessel using Molflow+ 2.4 [34, 35]. Molflow+ is a Test Particle Monte Carlo (TPMC) code for simulating vacuum systems in the molecular flow regime. Three different parameters have been extracted from the simulations for hydrogen and radon: (i) the effective pumping speeds for the TMPs, NEG pumps, and baffles, (ii) the conductance of a baffle, and (iii) the pressure ratio at the locations of the Extractor gauges.
After a particle is started in Molflow+ (desorbed from a surface), it is tracked through the geometry, until it is adsorbed on a pumping surface with a certain sticking coefficientα, defined as the probability that a particle sticks to the surface after impinging on it. All other particles are diffusely reflected. Pumps are simulated by one or more surface elements with appropriate values forα. The pumping speedSof a pump with an opening area Aof the high vacuum flange, for gas
particles with an average speed ¯c(H2: 1754.6 m/s; Rn: 167.2 m/s), is
S = 1
4c¯·A·w. (4.1)
The parameter wis the pumping probability, defined as the ratio of particles absorbed by the pump, to the particles entering the pump through the openingA(for instance the high vacuum flange
of a TMP). This definition is similar toα, but for a more complex geometry. Particles leaving the pump towards the vacuum vessel are discarded by setting the sticking coefficient of the entranceA
to 100%.
The conductance of a component with two openings (for instance a tube) is the product of the transmission probabilitywand the flow ˙V = 0.25·c¯· Ainto the component through opening A.
The transmission probability is defined as the ratio of particles entering through opening Aand
leaving the component through the other opening. The sticking coefficients are set to 100% for both opening surfaces. Thus the simulation of a conductance is similar to the simulation of a pumping speed (eq. (4.1)).
2016 JINST 11 P04011
0.0 0.2 0.4 0.6 0.8 1.0 1.20% 1% 2% 3% 4%
Extr act or gau ge ra ti o p P3 /p F9
NEG sticking coefficient a
wall desorption NEG desorption
measured ratio after activation H2 60 70 80 90 100 110 120 130 140 150 160
0% 1% 2% 3% 4%
NE G p u mpi n g speed ( m 3/s)
NEG sticking coefficient a
maximum: 156 m3/s for a = 100%
expected: 125 m3/s for a = 2.9%
NEG pump with baffle
measured: 96 m3/s
for a = 1.1%
b) a)
Figure 8. Molflow+ simulations of the Main Spectrometer with a NEG pump and a baffle in each pump
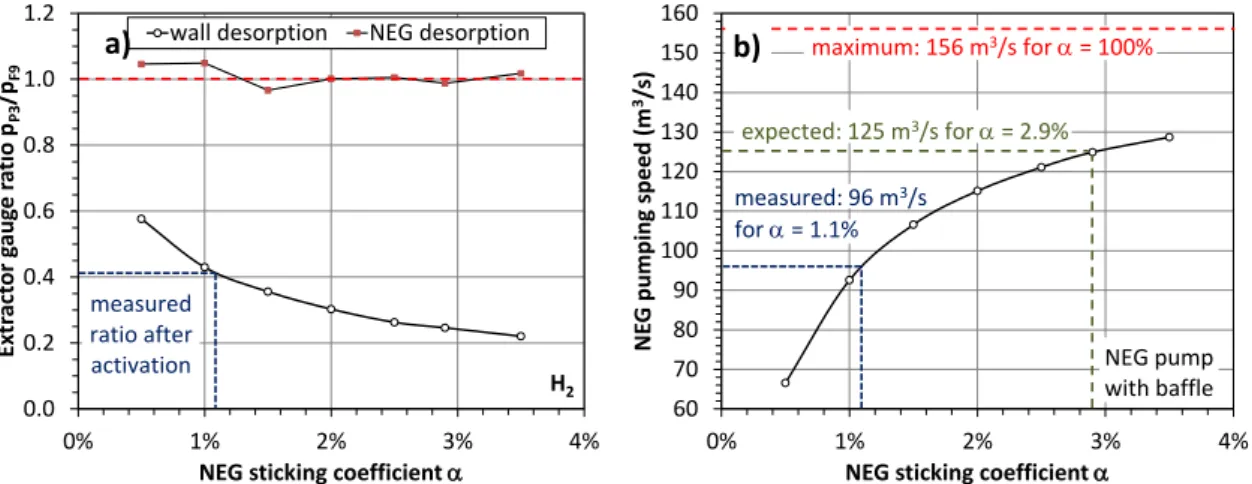
port. (a) Pressure ratio in pump port P3 behind the NEG pump, and in the main volume of the spectrometer as a function of the NEG sticking coefficient for hydrogen. The measured, hydrogen dominated ratio of 0.41 leads to a sticking coefficient ofα=1.1%. For a fully activated NEG pumpα=2.9% is expected. (b) For the partly activated NEG pump the effective pumping speed for hydrogen was 96 m3/s in one pump port.
simulated directly, but has to be calculated, using further information, such as the total desorption rate or the average speed ¯c. However, the ratio of two pressure values at different locationsican be
easily calculated from the number of hitsHiand the respective areas Ai:
p1 p2 =
H1 H2 ·
A2
A1. (4.2)
Two models were set up to describe the Main Spectrometer. Model 1 comprised the whole spectrometer vessel, including baffles, NEG pumps, TMPs, and vacuum gauges. Particles were started from all surfaces, assuming homogeneous outgassing rates and a cosine angular distribution. This model was used to simulate pressure ratios of the two Extractor gauges. Model 2 simulated one pump port (P3) with a baffle, a NEG pump, and three TMPs. All particles were started towards the pump port from the virtual surface of the intersection between the pump port and the main vessel. The sticking coefficient of this surface was set to 100%, i.e. adsorbing all particles that left the pump port towards the main vessel. This model was used to simulate the effective pumping speeds of TMPs, NEG pumps, and baffles, respectively.
4.1 Simulation of hydrogen
The NEG pumps were defined as 1000 m of getter strips in each pump port, with a sticking coefficient
2016 JINST 11 P04011
0.0010.01 0.1 1
0% 20% 40% 60% 80% 100%
pr es sur e ra ti o p F9 ( a )/p F9 (0 )
baffle sticking coefficient aRn
a) 0 10 20 30 40 50 60 70
0% 20% 40% 60% 80% 100%
Radon p ump in g speed (m 3/s)
baffle sticking coefficient aRn
TMP only pump port 3
Baffle+TMP
b) Rn from NEG
Figure 9. Simulation of the suppression factor of the cryogenic baffles for radon emanating from the NEG
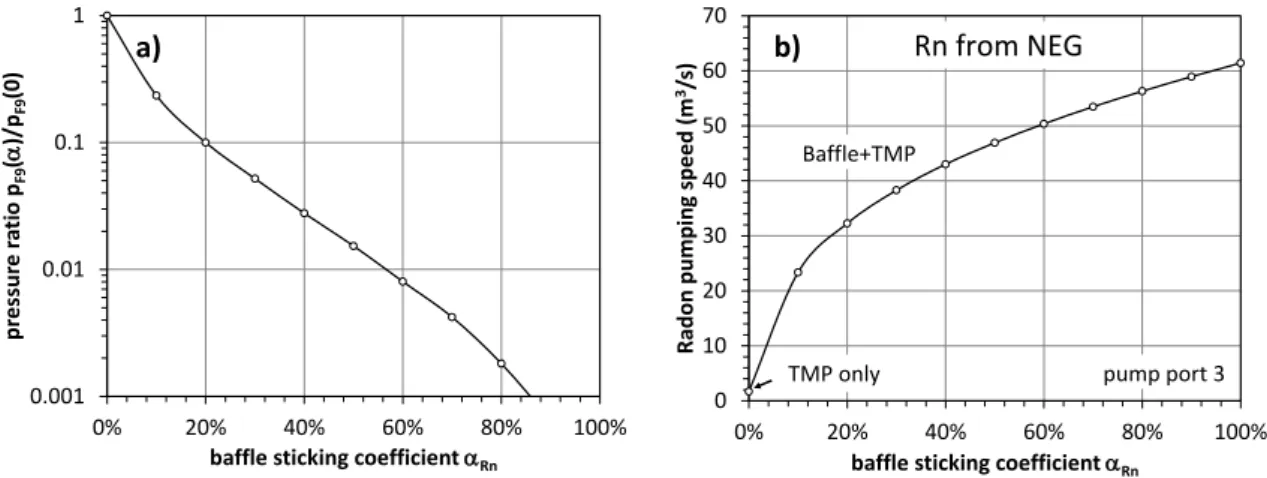
strips in the pump ports (a), and effective pumping speed of the baffles for radon emanating from the inner surfaces of the spectrometer (b), plotted over the sticking coefficient for radon. A sticking coefficient of 80% is estimated for nitrogen-cold baffles, using previous measurements with the pre-spectrometer.
In a second simulation with the same model, desorption was only defined for the surfaces of the NEG strips. This corresponds to the situation during activation of the NEG pumps, when hydrogen is driven out of the getter and dominates the pressure distribution in the Main Spectrometer. Since gas can only be pumped through the pump ports, the gas flow into the main volume continues until an equilibrium with the pump ports is reached. The pressure ratio between the Extractor gauges is approximatelypP3/pF9=1.
The effective pumping speed of the NEG pump in pump port 3 was simulated using model 2. The pumping probabilitywof the NEG pump was calculated as the number of particles adsorbed on the surfaces divided by the total number of particles desorbed from the virtual surface of the intersection between pump port 3 and the main vessel. The effective pumping speed of the NEG pump was determined by varying the sticking probabilityαbetween 0.5% and 3.5% in seven steps (see figure8b). With the conductance of the baffle (simulation: 157 m3/s) as the limiting factor, the
effective pumping speed for the fully activated getter strips in a pump port (α = 2.9% [28]) was 125 m3/s, or 375 m3/s for all three pump ports of the Main Spectrometer.
The simulation of the effective pumping speed without the baffles (as initially planned) resulted in a value of 930 m3/s for the spectrometer. Thus, the necessity of introducing the baffles for
capturing radon atoms reduced the effective pumping speed for hydrogen by 60%.
4.2 Simulation of radon
Radon was simulated for two different sources [10]: (i) NEG strips are known to emanate small amounts of219Rn with a half-life of 4.0 s, and (ii) the stainless steel walls and weldings of the vessel
emanate small amounts of 219Rn and 220Rn with a half-life of 55.6 s. The most common radon
isotope, 222Rn with a half-life of 3.8 d, which might also be emanated, is not taken into account,
since almost all of it is pumped out before it decays.
2016 JINST 11 P04011
been simulated using model 1. The pressure ratiopP3/pF9of the two Extractor gauges serves as themeasure for radon suppression. This number takes into account that a considerable fraction of the radon atoms already decay inside the spectrometer volume. The sticking coefficient for radon, which strongly depends on the temperature of the baffles, was varied from 0% to 90% in the calculations. The results are shown in figure9a. From the measurements with the pre-spectrometer we expect the sticking coefficient to be∼80%, which would result in a radon suppression factor of 550.
Radon emanated directly into the main volume from its inner surfaces cannot be prevented from decaying in the flux tube. It can only be pumped out quickly enough before a large fraction can decay [12]. The pumping speed of a baffle in pump port 3 with regard to the main volume has been simulated, using model 2. Figure9b shows the results for the simulated sticking coefficients ranging from 0% to 100%. For a sticking coefficient of 80% the effective pumping speed is 56 m3/s,
resulting in a total pumping speed of S = 170 m3/s. The pump-out rate S/V = 0.14s−1 has to
compete with the decay rates for219Rn (λ219 =0.17s−1), and220Rn (λ
220=0.012s−1), as well as
re-desorption from the baffles [38].
5 Commissioning of the vacuum system and status after bake-out
5.1 Pump down and leak tests
Commissioning of the Main Spectrometer vacuum system started in summer 2012, after a four-year period when the complex inner electrode system, the cryogenic baffles, and the getter pumps were installed under cleanroom conditions. After the initial pump-down with the SP630 screw pump and three TMPs on pump port 3, the vessel vacuum reached 10−7mbar. Pump down of the vessel
to 10−2mbar took 6 days due to some coarse leaks, which had to be closed first, before the TMPs
could be switched on. A final leak test with a sensitivity of 5·10−10mbar·`/s was performed with a leak detector used as fore-pump for the three TMPs. With an effective pumping speed for helium of 6000`/sand a total volume of 1240 m3the response time2of each leak test was 7 min. For each
local leak test the respective flange was enclosed in a tightly sealed plastic bag filled with helium.
5.2 Bake-out procedure
The nominal operating temperature of the spectrometer vessel is 20◦C. If needed, it can be cooled
down to 10◦C, thus reducing the H
2outgassing rate of stainless steel by a factor of two. During
vacuum bake-out it can reach temperatures up to 350◦C. The temperature is controlled to better
than 1◦C by a thermal oil temperature unit from HTT® [39]. The system has two independent
thermal circuits, one for the main vessel and one for the three pump ports with the getter pumps. It provides a total heating power of 440 kW and a cooling power of 60 kW using 9 m3of heat transfer
fluid (Marlotherm LH®[40]). The fluid is continuously pumped through approximately 1200 m of
114-mm-diameter half-tubes welded to the outer surface of the spectrometer vessel. In addition the heating system is supported by 56 electrical heating tapes for smaller ports, flanges and gate valves. The temperature distributions on the exterior surface of the MS, on the interior surface at the inner electrode system, at the getter pumps and at the LN2-baffles are monitored by an array
of 381 temperature sensors. On the outer surface PT100 sensors are used. Inside the vacuum
2016 JINST 11 P04011
050 100 150 200 250 300 350 400
0 100 200 300 400 500
time (h)
temperature (°C)
600
50 150 250 350 450 550
H2O
a)
diffusion
desorption
H2
H c)
activation of NEG pumps
reduction of H on surface
2
b) N2 O2 NEG H2
slow cool-down (1 - 5°C/h) desorption
of water slow heating
(1 - 5°C/h)
Figure 10. Based on test measurements with a 300` vacuum vessel, an optimized schedule for the MS
bake-out cycle was defined: a)accelerated desorption of water from all surfaces,b)activation of the NEG pumps at 350◦C, andc)intermediate temperature step, in order to further reduce hydrogen on all surfaces.
For all temperature changes the gradient had to be kept in the range of 1 to 5◦C/h in order to allow the inner
electrode system to follow the temperature of the vessel within 2◦C.
vessel temperatures are monitored by PT1000 sensors, which are attached to the NEG pumps, the LN2-baffles and some of the inner electrode frames.
The bake-out procedure was tested and optimized with a smaller vacuum vessel (volume: 300`), built with the same type of stainless steel (316LN) as the MS. Based on these measurements a schedule for the MS bake-out cycle was devised [38] for both cleaning the inner surfaces and activating the getter strips at 350◦C (see figure10):
1. Increase the temperature slowly to 200◦C. Up to a temperature of 90◦C a ramping speed of
1◦C/h is used. Above this temperature the ramping speed is slowly increased in several steps,
with a maximum rate of 5◦C/h above 150◦C.
2. Keep the temperature stable at 200◦C for about two days, in order to remove most of the
water bound on the stainless steel surfaces and to reduce the outgassing of hydrogen before activating the NEG pumps.
3. Increase the temperature to 350◦C at a rate of 5◦C/h.
4. Keep the temperature stable for at least 24 hours to activate the NEG pumps, as recommended by the manufacturer.
5. Lower the temperature to 150◦C at a rate of 5◦C/h.
2016 JINST 11 P04011
0 50 100 150 200 250 300 350
01.01.2013 11.01.2013 21.01.2013 31.01.2013
p
ressu
re
(mb
ar
, N
2
)
temp
er
atu
re
(°
C)
time
PT100 temp. sensor Extractor pump port (P3) Extractor vessel (F9)
temperature
air leak
first short circuit
several short circuits
short circuit disappeared
differentially pumped vacuum sleeve
10-4
10-11
10-10
10-9
10-8
10-7
10-6
10-5
Figure 11. Overview of the actual Main Spectrometer bake-out cycle in January 2013. Plotted are pressure
and temperature versus time. The occurrences of short circuits in the electrode system and an air leak during the final cool down phase at about 52◦C are indicated in the plot.
Other temperature steps between 100◦C and 350◦C reached outgassing rates from 5.1 to
11.4·10−13mbar·`/s·cm2.
7. Lower the temperature to 20◦C. At this time the residual gas composition in the clean vessel
is expected to be dominated by hydrogen diffusion from the bulk, with small traces of water, CO and CO2.
The slow ramping speed of the temperature is necessary to protect the complex inner electrode system, allowing it to follow the temperature profile of the main vessel. Between room temperature and 350◦C the circumference of the Main Spectrometer vessel expands by 15 cm, while the electrode
modules can only compensate movements of a few mm against the vessel. Since the electrodes are mainly heated by radiation, the temperature gradient between vessel and electrodes is constantly monitored. The slower rise time at low temperatures takes into account the T4dependence of heat
radiation. During the whole bake-out and cool-down procedure the temperature gradient between vessel and electrodes was kept at 1◦C, ensuring a similar thermal expansion rate of both systems.
An overview of the whole bake-out cycle, which started on January 4th and ended on January
31st, 2013, is given in figure11. Within a time interval of 36 h, when the temperature rose from
120◦C to 200◦C, the water content in the residual gas spectrum dropped by a factor of 50. During
the following four days the water content dropped by another factor of 5, while the vessel was kept at a constant temperature of 200◦C.
2016 JINST 11 P04011
Figure 12. Two air leaks opened up at CF flanges during the cool-down phase after baking (port F8), and during pump-down after venting the vessel with argon (port F9). Both leaks could be sufficiently reduced by differential pumping (scroll pumps) using two pairs of vacuum sleeves, shown in this drawing, that were mounted around the leaking flange connections.
A short circuit between two wire layers in one of the central sections was detected. After ramping of the temperature started again, the short circuit initially disappeared. However, between 250◦C
and 300◦C several more sections developed short circuits between wire layers and between adjacent
sections. As later inspections through the CF ports for the high voltage feedthroughs showed, these short circuits were caused by the deformation of the CuBe rods that connect the distribution panels to the corners of some of the modules underneath the feedthroughs. In order to prevent further damage, the bake-out procedure was stopped at 300◦C. This temperature was sustained for 28
hours, activating the NEG pumps at least partly before being reduced to 150◦C. The deformation
can be traced back to the fact that the rods lost their tensile strength at temperatures above 200◦C,
started to move downwards, and remained in this deformed position.
In the final step the temperature was slowly reduced to 20◦C. During this final cool-down a
major air leak opened up at a temperature of 52◦C at a DN200 CF flange of port F8, which is on
one of the conical sections of the spectrometer. The pressure rapidly increased by five orders of magnitude. Tightening the bolts of the flange was not sufficient to close the leak, but an immediate repair of the leaking gasket would have resulted in a two-month delay and considerable operating costs for an additional baking cycle after venting the spectrometer. Therefore a differentially pumped vacuum sleeve (see figure12) was installed around the flange and pumped down to approximately 0.1 mbar by a scroll-pump. This temporary measure reduced the leak rate sufficiently to allow the continuation of the planned electro-magnetic test measurements until October 2013, when the spectrometer was scheduled to be vented again. A second leak opened up after the venting with argon (described in section6.2). A similar vacuum sleeve was used to reduce this leak.
5.3 Vacuum performance after baking
After reaching the base temperature of 20◦C, the RGA spectrum (see figure13) revealed a
2016 JINST 11 P04011
1 3 5 7 9 11 13 15 17 19 21 23 25 27 29 31 33 35 37 39 41 43 45 47 49
p
ressu
re
in mb
ar
(N2
c
al
.)
RGA mass (amu)
before baking: 6.4E-8 mbar after baking: 3.5E-11 mbar
H2
H2O
CO2
CO / N2 10-7
10-13
10-12
10-11
10-10
10-9
10-8
Figure 13. RGA spectra before and after bake-out. Before the bake-out procedure the pressure was dominated
by water (mass = 18 amu). After the campaign hydrogen was the dominant residual gas. The RGA peaks have been calibrated against the absolute pressure, as measured with the Extractor gauge of pump port 3. The hydrogen pressure in the main volume was approximately 6·10−11mbar (see text).
clean vessel. Despite the problems described in the previous section, the baking cycle reduced the final pressure by three orders of magnitude.
With the vacuum sleeve around the leaky flange working, the Extractor gauges measured a pressure of 3.5·10−11mbar in pump port P3, and 1.7·10−10mbar in port F9 at a temperature of 20◦C. As mentioned before, the pressure measured in F9 had an offset that was caused by local outgassing in the order of 10−10mbar. Figure14a shows a plot of the pressure in P3 against F9, measured just
before the air leak opened up at port F8. During that period the temperature of the spectrometer dropped from 80◦C to 53◦C. The Extractor gauges, mounted outside the thermal insulation of the
Main Spectrometer, were already close to the ambient temperature of 20◦C inside the experimental
hall. Thus no temperature correction was applied to the measured pressure. A linear fit to the pressure data in figure14a provided an offset between the two gauges of 1.8·10−10mbar. Although
the fit can only determine the difference between the offsets of both gauges, it was assumed that the offset can be attributed to F9, since the pressure in P3 was already well below this value.
2016 JINST 11 P04011
y = 0.412x - 7.56·10-11
Ex
tr
ac
to
r
P
3
(
mb
ar)
Extractor F9 (mbar) 25.-27.1.2013 prior to the air leak
offset p(F9): 1.83·10-10 mbar
1·10-10
0
4·10-10
3·10-10
2·10-10
4·10-10 6·10-10 8·10-10 1.0·10-9 1.2·10-9
a)
y = 0.079e-6393x
0.0028 0.0029 0.003 0.0031
wall temperature 1/T (1/K)
p(20°C) = 2.6·10-11 mbar
80°C
53°C 𝒑𝐅𝟗
∙
𝑻
/𝟐𝟗𝟑𝐊
(m
bar
)
10-9
10-10
b)
Figure 14. Extractor gauges on port F9 (main volume) and pump port 3: a) Hydrogen dominated pressure,
measured just before the air leak in port F8 occurred, with the vessel temperature between 80◦C and 53◦C.
The offset of the linear fit is mainly attributed to the gauge on F9. The slope is used to estimate the activation of the NEG pumps. The fit in (b) is used to estimate the pressure that the spectrometer would have reached without the air leak.
5.4 Activation of the NEG pumps
The thermal activation of the NEG pumps at the recommended temperature of 350◦C for a duration
of 24 hours was not possible. Reducing either the temperature or the activation time can result in a lower pumping speed, and/or a reduced capacity for gas. The actual activation during the bake-out campaign lasted 28 h at 300◦C.
The simulations described in section4.1were used to estimate the level of activation and the effective pumping speed of the NEG pumps. Comparing the plot in figure8.a to the fitted slope of 0.41 (figure14.a) of the measured data results in a sticking coefficient of 1.1%. Assuming a sticking coefficient of 2.9% for fully activated NEG strips [28], baking at 300◦C for 28 h led to an
activation of 40% of the nominal pumping speed of the NEG strips.
For the partly activated NEG pump withα= 1.1%, the effective pumping speed was 96 m3/s
(see figure8.b). This is already 77% of the maximum effective pumping speed. For three NEG pumps and six TMPs the effective pumping speed for hydrogen in the MS added up to 300 m3/s.
In general NEG pumps also pump nitrogen, water, CO, CO2, and other active gases. While
hy-drogen is pumped by the reversible process of physisorption, other gases are pumped by irreversible chemisorption. During the activation process hydrogen is released and pumped out by TMPs, while compounds with other gas species on the surface diffuse into the bulk of the NEG material, leaving a clean and reactive metal surface, ready to pump again [41]. During the initial heating, the ratio of pressures in figure15, which was hydrogen dominated above 150◦C, shows that the NEG pumps
started pumping already at 200◦C. The pressure ratio can be compared to the simulated ratio as a
2016 JINST 11 P04011
0.0 0.2 0.4 0.6 0.8 1.0 1.2 1.4
0 50 100 150 200 250 300
Ex
tr
ac
tor
g
aug
e
ra
ti
o p(P
3
)/
p(F
9
)
Main Spectrometer temperature in °C
start of NEG pumping at 200°C
Figure 15. Ratio of the two Extractor gaugespF9andpP3. The start of the deviation of the pressure ratio
during the initial heating indicates the start of the NEG pumping. Apparently the NEG strips started pumping already at a temperature of 200◦C.
5.5 Estimation of the outgassing rate
In general the outgassing rate of a surface can be measured with a rise of pressure measurement, where the vacuum vessel is evacuated to ultra-high vacuum before it is isolated from the pumps. This method has been applied before on the Main Spectrometer, revealing a slowly decreasing hydrogen outgassing rate of the stainless steel from 1.5 to 1.2·10−12mbar·`/s·cm2[13].
However, with the activated NEG pumps inside the pump ports without an isolating valve, this method could not be used. Therefore the outgassing rate jH2 for hydrogen was estimated
by multiplying the hydrogen pressure pH2 in the main volume with the effective pumping speed Seff =300 m3/s, normalized to the inner surface A=1271 m2:
jH2= pH2·Seff
A . (5.1)
The outgassing area includes all surfaces at 20◦C, and excludes only the activated getter surface.
With the outgassing rate depending strongly on the temperature, the pressure had to be determined at the standard operating temperature of 20◦C. Since the Extractor gauge at port F9 had a
non-negligible offset, which decreased over time and could not be determined accurately enough at 20◦C, the temperature-dependent, hydrogen-dominated pressure, measured before the air leak, was
extrapolated to 20◦C. Atoms and molecules on a surface oscillate rapidly at a frequency ν
0 ≈
1013Hz. If their kinetic energy is above the desorption energyEdes, they can escape the surface into
2016 JINST 11 P04011
surface desorption rate, which is equivalent to the outgassing rate, isjdes = 1 A·
dN
dt =−ν0·
N A ·e
−Edes/R·TW. (5.2)
According to eq. (4.1) the effective pumping speed of the NEG pumps is proportional to ¯c, which
in turn is proportional to the square root of the gas temperatureTW. Assuming that the sticking
coefficient αNEG, and thus the pumping probabilityw, does not change much in the temperature range of the measurement, the effective pumping speed at temperatureTWis
Seff(TW)= Seff(293 K)· √
TW
√
293 K. (5.3)
The pressurepmmeasured by an Extractor gauge is proportional to the particle density
n= p kB·T =
jdes· A
Seff(TW). (5.4)
With eqs. (5.1), (5.2), and (5.4), the measured pressure as a function of the wall temperature can be expressed as
pm= a0· √
293 K √
TW ·e
a1·T1
W (5.5)
A fit of the data from the Extractor gauge (F9) in figure14.b provided parametersa0anda1, which
were used to extrapolate the pressure in the main volume at 20◦C. The fitted value of 2.6·10−11mbar
has to be multiplied with the gas correction factor of gauge F9 for hydrogen (2.2), in order to get the real hydrogen pressure ofp(20◦C) = 5.7·10−11mbar inside the Main Spectrometer. Inserting all numbers in eq. (5.1), we derive an outgassing rate at 20◦C of j
H2 =1.4·10−12mbar·`/s·cm2. The partial pressure, measured with the RGA about two months after the bake-out (see fig-ure13), was 1.9·10−11mbar. Since the RGA data have been calibrated against Extractor gauge P3, it has to be multiplied with a gas correction factor of 2.3 and with the pressure ratio (1/0.41) between hydrogen in the main volume and in pump port 3, the location of the RGA. The real hydrogen pressure in the main volume, determined with the RGA, is p(20◦C) = 1.1·10−10mbar,
corresponding to an outgassing rate of jH2 =2.5·10−12mbar·`/s·cm2. While the uncertainty of the Extractor calibration is 10% at 10−6mbar (used here as a reference) the main uncertainties of the
pressure cannot be quantified due to the linear extrapolation over almost five orders of magnitude. The extrapolation from higher temperatures to 20◦C and the measurement with the RGA find
within uncertainties comparable results for the H2partial pressure, and therefore, for the outgassing
rate. The outgassing rate is in the same range as that in the first measurements in 2007 [13], where the inner electrode system and the NEG pumps were not yet installed and the final bake-out temperature reached the nominal value of 350◦C. This result also shows that the vacuum quality
was not affected after five years of inner electrode system installation and other construction work under cleanroom condition in the vessel.
6 Preparations for first spectrometer measurements