CONTINUOUS LIQUID INTERFACE PRODUCTION OF MICRONEEDLES FOR TRANSDERMAL DRUG
DELIVERY
Ashley Rachelle Johnson
A dissertation submitted to the faculty of the University of North Carolina at Chapel Hill in partial fulfillment of the requirements for the degree of Doctor of Philosophy
in the Department of Biomedical Engineering.
Chapel Hill 2016
Approved by:
Joseph M. DeSimone
Michael Jay Leaf Huang
ii © 2016
iii ABSTRACT
Ashley Rachelle Johnson: Continuous Liquid Interface Production of Microneedles for Transdermal Drug Delivery
(Under the direction of Joseph M. DeSimone)
The past two decades of microneedle research has demonstrated the benefits of
microneedle technology in transdermal drug delivery. Microneedles are arrays of sub-millimeter sized projections that physically pierce the outer layer of the skin to allow a therapeutic to pass into the body. Using microneedles to create physical channels within the skin has enabled transdermal delivery of many medications that would otherwise need be delivered by
hypodermic injection. Because microneedles are so small that they evade nerve endings buried deep within the skin, they have enabled pain free delivery of medications, providing an
opportunity for improved patient compliance. Biocompatible microneedles are of particular interest because they are thermodynamically stable at room temperature, safe for patients and enable controlled release of medication out of the patch. The micro-manufacturing processes used to manufacture such biocompatible microneedles, however, do not allow for control over critical microneedle design parameters, such as size, shape, aspect ratio and spacing.
iv
microneedles. CLIP microneedles were produced from more than four different compositions, including photopolymerizable derivatives of biocompatible materials designed to dissolve, degrade, or swell within the skin to release a cargo. These CLIP microneedles effectively pierced murine skin ex vivo and released the fluorescent drug surrogate rhodamine.
v
ACKNOWLEDGEMENTS
But he said to me, “My grace is sufficient for you, for my power is made perfect in weakness.” Therefore I will boast all the more gladly of my weaknesses, so that the power of Christ may rest upon me.” 2 Corinthians 12:9
I am more grateful for graduate school than I ever thought possible. I’ve learned so much about science, even more about life, and become a stronger person more capable of handling the challenges of my future. I have been so blessed to share it with loving and inspiring people, inside and outside of the lab. I quite literally could not have done this without you.
To my colleagues at the University of North Carolina at Chapel Hill: I’d like to thank my advisor Dr. Joseph DeSimone for being a constant source of inspiration. Thanks for
demanding my best work and trusting me enough to work on problems that really matter. Thank you for the insight, resources, and connections that have allowed me to grow as a young
scientist. I’d like to thank Dr. Chris Luft for helping me navigate the many challenges of
graduate school. Thank you for seeing me at my worst and yet continuing to believe in me. Many thanks to Dr. Sue Mecham for being my polymer guru and for editing this dissertation.
I would also like to thank my committee members and the many people who contributed to this work, particularly my collaborators at Carbon 3D, including Dr. Alexander Ermoshkin, Dr. David Shirvanyants, and Dr. John Tumbleston, and Ariel Herrman as well as my
vi
Lastly, thank you to DeSimone members past and present, especially Katie Moga, Cassie Caudill, Erin Wilson, Tammy Shen, James Byrne, Luke Roode, Jason Coffman, Cathy Fromen, Cameron Bloomquist and Ali Nebipasagil. It’s an honor to persevere and to laugh beside you.
To my Chapel Hill family:You have shown me a depth of love and community that’s more than I could have ever hoped for. Ashley Walker, Chelsea Clark, Rebecca Yau, Michelle Huckleberry, Sabrina and Adam Gardner, Betsy and Andrew Satterlee, Emily and William Commander, Tommy Sheppard, Daniel Huang, Alan Tubbs, Karl Shieh, Josh Hartzog, and anyone else I may have forgotten- thank you for making life so much fun and for being a constant source of insight and wisdom. I’ve cherished all of the time that we’ve shared together and forward to keeping in touch as I enter this next phase of my life. My phone, heart, and home are always open to you.
To my biological family: I performed my first science experiments in our kitchen at home as a little girl. I swore I would NEVER become an engineer, but I suppose it’s not altogether surprising to anyone. Mom, thank you for doing everything you could to encourage my love for science. From taking time off of work to do science demonstrations in my
elementary school class to picking up pig hearts at the grocery store, you’ve truly done
vii
TABLE OF CONTENTS
LIST OF FIGURES………...….xii
LIST OF TABLES………...xix
LIST OF ABBREVIATIONS AND SYMBOLS……….. ...xx
CHAPTER 1 Microneedle Technology for Transdermal Drug Delivery ... 1
1.1 Transdermal Drug Delivery ... 1
1.1.1 Drug Delivery Market ... 1
1.1.2 First Generation Transdermal Drug Delivery ... 2
1.1.3 Structure of the Skin ... 4
1.1.4 Advancements in Transdermal Drug Delivery ... 6
1.2 Microneedle Technology... 8
1.2.1 Microneedle Configurations ... 11
1.2.2 Microneedle Fabrication Techniques ... 14
1.2.3 Fabrication of Biocompatible Microneedles ... 18
1.2.4 Overarching Challenges in the Fabrication of Biocompatible Microneedles ... 22
1.2.5 Role of Microneedle Design Parameters on Device Efficacy ... 22
viii
1.3.1 Stereolithography ... 29
1.3.2 Layer-by-Layer Approaches to Additive Manufacturing of Microneedles ... 32
1.3.3 Continuous Liquid Interface Production (CLIP) ... 34
1.4 Summary and Hypothesis... 36
CHAPTER 2 ... 46
2.1 Introduction ... 46
2.1.1 Step 1- Generation and Slicing of CAD File ... 47
2.1.2 Step 2- Projection of the Image ... 48
2.1.3 Step 3- Photopolymerization of the Part ... 55
2.1.4 Chapter Objective ... 57
2.2 Results and Discussion ... 58
2.2.1 CLIP File Path... 58
2.2.2 Role of Light Intensity and Build Speed on Microneedle Production Using an Early Prototype ... 59
2.2.3 Effect of System Optics on a Resolution Test Pattern ... 62
2.2.4 Role of Light Intensity on Microneedle Dimensions Using Updated CLIP7 ... 66
2.2.5 Visualization of Individual Pixels Causes Stairstepping ... 69
2.2.6 Application of Antialiasing to CLIP ... 71
2.2.7 Application of Antialiasing to Microneedle Production ... 78
2.2.8 Selection of Appropriate Build Parameters ... 79
ix
2.3 Conclusions ... 85
2.4 Experimental ... 86
2.4.1 Materials ... 86
2.4.2 TPO Absorption Spectrum ... 86
2.4.3 CLIP Instrument Specifications ... 86
2.4.4 TMPTA Part Fabrication ... 88
2.4.5 Analysis of Antialiasing Algorithms ... 90
CHAPTER 3 Controlled Release of Therapeutics from CLIP Microneedles ... 93
3.1 Introduction ... 93
3.2 Results and Discussion ... 97
3.2.1 Selection of Biocompatible Materials ... 97
3.2.2 Stereolithographic Working Curves ... 100
3.2.3 Derivation of the Working Curve from Beer-Lambert Law ... 101
3.2.4 Application of Working Curves to CLIP ... 102
3.2.5 Adaptation of Working Curves to Microneedle Fabrication ... 106
3.2.6 Production of Biocompatible CLIP Microneedles ... 110
3.2.7 Microneedle Skin Insertion Tests ... 111
3.2.8 Loading and Release of Fluorescent Drug Surrogate ... 113
3.2.9 Dissolvable PAA Microneedles Release Cargo in Skin ... 115
x
3.2.11 Biocompatibility Testing ... 119
3.3 Conclusions ... 128
3.4 Experimental ... 130
3.4.1 Synthesis of Polycaprolactone Trimethacrylate ... 130
3.4.2 Determination of Critical Exposure ... 130
3.4.3 Fabrication of Biocompatible Microneedles ... 131
3.4.4 Microneedle Dissolution and Rhodamine Release Studies in Solution ... 132
3.4.5 Skin Penetration Studies ... 132
3.4.6 Characterization of Extractable Fractions ... 134
3.4.7 Cytotoxicity of Photoreactive Monomer and Microneedle Arrays... 134
CHAPTER 4 Microneedle Mechanical Properties and Skin Penetration ... 138
4.1 Introduction ... 138
4.2 Results and Discussion ... 141
4.2.1 Skin Penetration of Biocompatible Microneedles on Murine Skin ... 141
4.2.2 Fabrication of PEG Microneedles with Varying Crosslink Density ... 142
4.2.3 Mechanical Properties of PEG Blends ... 145
4.2.4 Quantification of Microneedle Insertion Forces ... 148
4.2.5 Percent Insertion as a Function of Composition and Applied Force ... 150
4.2.6 Depth of Penetration vs. Force... 157
xi
4.4 Experimental ... 163
4.4.1 Identification of PEG Microneedle Build Parameters ... 163
4.4.2 Fabrication of PEG Microneedles ... 164
4.4.3 Mechanical Testing of PEG Blends ... 164
4.4.4 Gel Fraction and Solvent Uptake ... 165
4.4.5 Quantification of Force of Thumb ... 165
4.4.6 Skin Insertion Tests... 166
4.4.7 Optical Coherence Tomography (OCT) ... 166
CHAPTER 5 Conclusions and future directions ... 171
5.1 Continuous Liquid Interface Production on the Micron Scale ... 171
5.2 Continuous Liquid Interface Production of Materials for Release of Therapeutics .... 173
5.3 Development of Biocompatible CLIP Matrices ... 175
5.3.1 Biocompatibility of (Meth)acrylate Based Chemistry ... 175
5.3.2 Alternatives to Meth(acrylate) Based Chemistry ... 178
5.3.3 Role of Photoinitiators ... 178
5.3.4 Characterization of Products and Degradation Products ... 179
5.4 Incorporation of Therapeutic Cargo ... 180
5.5 Microneedle Mechanics ... 180
xii
APPENDIX A Continuous Lua Script……….………...….171
xiii LIST OF FIGURES
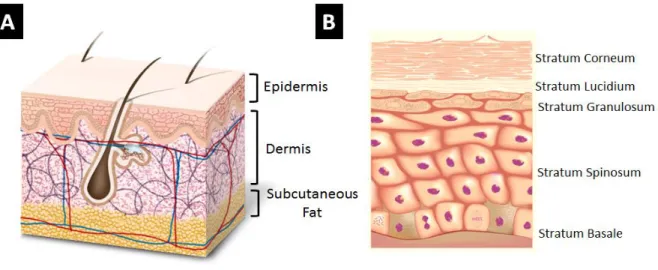
Figure 1.1 Structure of the skin A) Structure of full thickness skin B) Structure of
the Epidermis. Reproduced with permission from reference 19. ... 5 Figure 1.2 Growth and therapeutic targets of microneedle technology. A) Number of
publications involving microneedle technology annually. B) Number of publications delivering a therapeutic to treat various indications between 1998
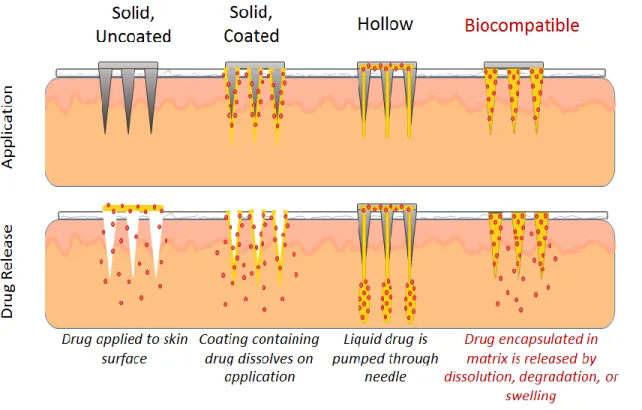
and 2014. Data compiled from Thomson Reuters Web of ScienceTM ... 9 Figure 1.3 Microneedle configurations. The method of application and drug release
for each of four different microneedle configurations. Figure adapted from
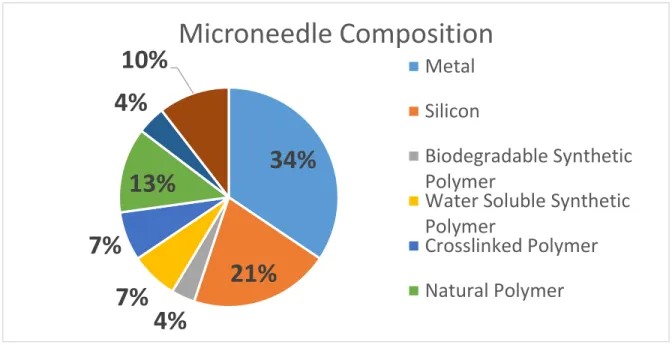
reference 19. ... 11 Figure 1.4 Distribution of microneedle compositions in literature from 1998-2014.
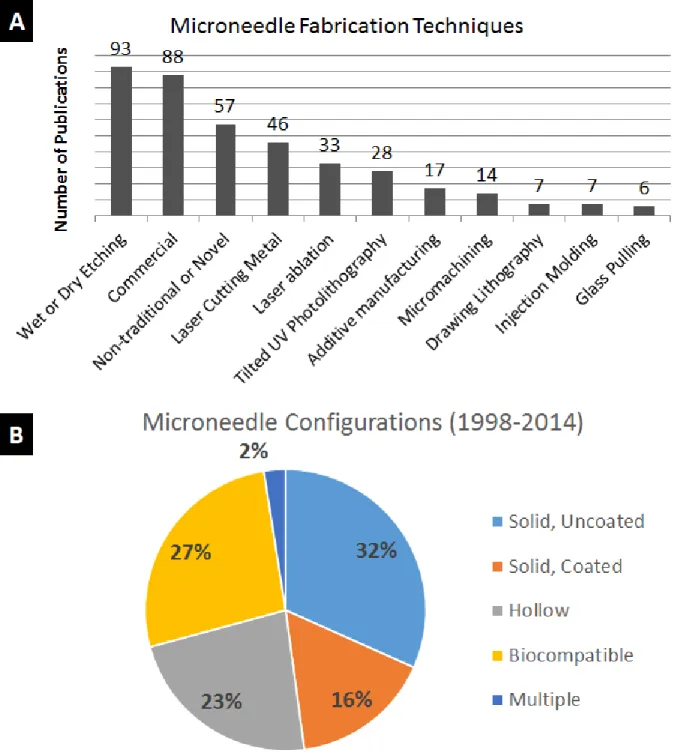
Data compiled from Thompson Reuters Web of ScienceTM ... 12 Figure 1.5 Frequency of microneedle fabrication techniques and microneedle
compositions A. Fabrication techniques utilized in microneedle publications released between 1998 and 2014 B. Frequency of each microneedle configuration over the same time period. Data compiled from Thompson Reuters Web
of ScienceTM ...14 Figure 1.6 Advantages and disadvantages of each microneedle configuration ... 15 Figure 1.7 Percentage of each microneedle configuration in literature over time. Data
is presented as the number of publications released of a particular composition divided by the total number of microneedle publications in that year. Data prior to 2003 is not not presented due to the small number of microneedle publications
over this time period. Data compiled from Thompson Reuters Web of ScienceTM ... 16 Figure 1.8 Microneedle masters produced using traditional techniques. Microneedle
masters have been produced using A) Cryogenic deep reactive ion etching of silicon29 B) Wet etching of silicon93 C) Laser ablation34 and D) Tilted UV
xiv
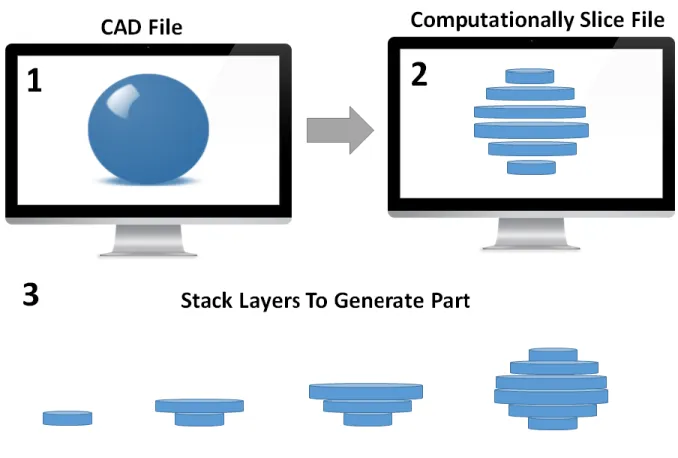
Figure 1.10 Overview of the additive manufacturing process. A computer model is computationally sliced into individual layers. Each two dimensional (2D) layer is stacked on top of the previous layer to create the desired three-
dimensional part (3D) ... 26 Figure 1.11 Types of additive manufacturing. A) Fused deposition modeling,
B) laser sintering, C) polyjet, and D) stereolithography are different types of additive manufacturing that form solid parts via either a thermal or photochemical phase transition. Images reproduced with permission from
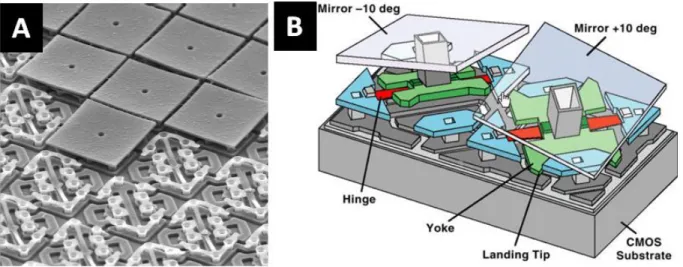
references 121-124. ... 27 Figure 1.12 Digital light processing (DLP) chip. A) Scanning electron micrograph
(SEM) of a DLP chip showing the array of micromirrors B) Schematic showing mechanism for turning each “pixel” or micromirror on and off. Images
reproduced with permission from reference 120 and 150, respectively ... 29 Figure 1.13 Layer by layer results in tradeoff between fabrication time and resolution ... 30 Figure 1.14 Microneedles produced via additive manufacturing A-C) Microneedle
produced by Lu et. al. D-G) Microneedles produced by Narayan and coworkers.
Images reproduced with permission from references 133 and 135 ... 33 Figure 1.15 Differences between stereolithography and CLIP ... 34 Figure 2.1 CLIP schematic A) The continuous CLIP process eliminates the tradeoff
between slice thickness and fabrication time to enable rapid production of high
resolution parts B) Diagram showing the essential components of a CLIP system ... 46 Figure 2.2 Representative image of a computationally sliced microneedle patch.
Several microneedle array cross-sections moving from the A) microneedle patch backing, through B-F) the base and tip of the microneedles within the
array. Note that only a small number of the thin cross-sections are displayed. ... 48 Figure 2.3 Ray diagram of an object imaged by a double convex lens ... 50 Figure 2.4 Airy Disk. An airy disk is the point spread function of a diffraction-limited lens ... 52 Figure 2.5 Beam width is minimized at the focal plane but is wider than the point
xv
Figure 2.6 Mechanism of free radical photopolymerization of acrylates. Figure
reproduced with permission from reference 6. ... 56 Figure 2.7 CLIP file path ... 58 Figure 2.8 Stucture and absorbance of resin components A) Structure of TMPTA
B) Structure of TPO and C) Absorption spectrum of TPO over wavelengths
of 260 to 450nm ... 59 Figure 2.9 Microneedle CAD file. A CAD File of an 8x8 array of1000µm tall
microneedles measuring 333µm in width spaced at 333µum on a 1mm thick
backing was used throughout chapter 2 ... 60 Figure 2.10 Impact of light intensity and build speed on microneedle morphology.
Top row is produced using 1 mW/cm2 of light at build speeds of A) 25mm/hr, B) 100 mm/hr, and C) 200 mm/hr. Bottom row is produced using 4 mW/cm2
of light at build speeds of D) 25 mm/hr E) 100 mm/hr and F) 200 mm/hr ... 61 Figure 2.11 Effect of lens focal length on resolution. The top row is fabricated using
an initial, low resolution lens setup with focal lengths of 50 and 75mm at A) 50 mm/hr B) 100mm/hr and C) 150 mm/hr. The bottom row is fabricated using a high resolution lens setup with focal lengths of 75 and 100mm at
D) 50 mm/hr E) 100 mm/hr and F) 150 mm/hr G) CAD file used to print the RTP. ... 62 Figure 2.12 Circularity calculation and validation A) Method for calculating
circularity. Circularity of 500µm squares printed with B) 2 mW/cm2, C) 4 mW/cm2, D) 6 mW/cm2 and E) 8 mW/cm2 of light. Minimizing
circularity results in improvements in the quality of the 500µm square ... 65 Figure 2.13 Circularity improves with improved printer optics A) Method for
calculating circularity. Circularity of 500µm squares printed with B) 2 mW/cm2, C) 4 mW/cm2, D) 6 mW/cm2 and E) 8 mW/cm2 of light. Minimizing circularity
results in improvements in the quality of the 500µm square ... 64 Figure 2.14 TMPTA Microneedles produced using different light intensities.
Microneedles were produced using A) 2mW/cm2, B) 5mW/cm2,
C) 8mW/cm2, D) 11mW/cm2, and E) 14mW/cm2 of UV light. Build speed
xvi
Figure 2.15 Dimensions of TMPTA microneedles produced with varying light
intensity. The dotted red line represents the height of the CAD file. The dotted blue line represents the width of the CAD file. Error bars represent the
mean ± SD (n=3) ... 68 Figure 2.16 Discrete pixels may produce stairstepping ... 69 Figure 2.17 Height of stair step vs. aspect ratio A) SEM image of microneedles of
aspect ratios 2, 3, and 4, where each horizontal line is an undesirable
“stair-step”. B) Comparison of the experimental step height between horizontal lines as compared to the theoretical step height calculated using Equation 1.
Error bars represent the mean ± SD (n=3). Scale bar measures 500µm. ... 71 Figure 2.18 Visible effects of spatial imagealiasing. The desired image is distorted by
spatial sampling at each pixel, causing the display to contain an alias, or
distortion of the original signal. Reproduced with permission from reference 2. ... 71 Figure 2.19 Effect of system focus on microneedle structure. Microneedles of three
different aspect ratios are fabricated A) In focus, with the lens at its focal point B) with the lens 2mm below its focal point and C) with the lens 4 mm below
its focal point. Scale bars measure 500µm. ... 73 Figure 2.20 Supersampling of typeface letter A. A) An aliased version of typeface
letter A has jagged edges B) Supersampling the typeface letter visibly
improves resolution. Reproduced with permission from reference 10. ... 73 Figure 2.21 Comparison of GDI and GDI+ Grayscale Assignments ... 75 Figure 2.22 Grayscale Assignments for a 2x2 Pixel Object Shifted by One Half
Micromirror. A) Grayscale value resulting from use of the GDI+ Interface B) Grayscale value resulting from use of the GDI Interface. An outline of
the original object is provided in red. ... 77 Figure 2.23 Difference Between Windows GDI+ and Windows GDI Projections
of Microneedle Crossections... 77 Figure 2.24 TMPTA Microneedles produced using Windows GDI. Microneedles
were produced using A) 2mW/cm2, B) 5mW/cm2, C) 8mW/cm2, D) 11mW/cm2, and E) 14mW/cm2 of UV light. Build speed was held constant at 100mm/hr.
xvii
Figure 2.25 Microneedle Dimensions vs. Light Intensity Using Windows GDI. Error
bars represent the mean ± SD (n=3). ... 79 Figure 2.26 1000µm tall TMPTA Microneedles Produced Using CLIP. A) Image of
CLIP Microneedles showing sharp tip radius B) Dimensions and fabrication
time for microneedles in Figure A. Data are represented as mean ± SD ... 80 Figure 2.27 CLIP MNs of Different HeightsMNs produced from a CAD file measuring
A) 1000µm tall and 333µm wide, B) 700µm tall and 233µm wide, and C) 400µm tall and 133µm wide. D) Dimensions of all MNs show truncation in z direction, but minimal shrinkage in the x-y direction. Data are presented as mean±SD (n=9).
Scale bars measure 500µm. ... 82 Figure 2.28 TMPTA Microneedles of Different Shapes A) TMPTA microneedles of
aspect ratio 2, 3, and 4 (left to right). 1000µm tall TMPTA microneedles with spacing of B) 0.5 base widths and C) 1.5 base widths. Complex microneedle geometries such as D) Arrowhead microneedles E) Tiered microneedles and F) Turret microneedles may improve mechanics of insertion into the skin. Scale
bars measure 500µm ... 84 Figure 3.1 Advantage of Controlled Release Systems. Controlled release systems
reduce fluctuations in drug concentrations to keep drug concentrations within
the therapeutic window. Reproduced with permission from reference 8. ... 94 Figure 3.2 Structure of Monomers Utilized for Microneedle Fabrication A) Polyethylene
glycol 550 dimethacrylate, n=9 B) Polycaprolactone trimethacrylate, n=2
C) Acrylic acid ... 100 Figure 3.3 Traditional working curve used in stereolithography.Reproduced with
permission from reference 20. ... 101 Figure 3.4 Traditional working curve used in stereolithography.Reproduced with
permission from reference 1. ... 101 Figure 3.5 CLIP working curves enable part production A) Method for producing
working curve. B) Working curve generated on a CLIP system. Figures are
xviii
Figure 3.6 Appropriate Build Parameters are Size Dependent on Small Scale. TMPTA test parts fabricated with A) 1mW/cm2 of light at 50mm/hr B) 2mW/cm2 of light at 100mm/hr and C) 4mW/cm2 of light at 200mm/hr. D) CAD file of the test part with 1mm tall microneedles with base widths
ranging from 100µm to 500 µm and a large square measuring 4mmx1mmx1mm.
E) Percent reduction (percent error) in height of all structures in A-C ... 105 Figure 3.7 Stereolithographic Working Curve and Resin Properties. A) The cure depth
of microneedle resins as a function of applied dosage B) Absorption coefficient and critical exposure of microneedle resins determined from the working curves
in figure A ... 107 Figure 3.8 Dimensions of Biocompatible MNs Produced Using Parameters from Working
Curve. Height and width of TMPTA, PEG, PCL, and PAA microneedles.
Intended dimensions are marked with a dotted line. PAA microneedle height and width were determined to be significantly different from all other compositions
at a p<0.0001 significance level. Data are presented as mean ± SD ... 109 Figure 3.9 Biocompatible microneedles. ESEM images of A) Polyethylene glycol
B) Polycaprolactone and C) Polyacrylic acid microneedles measuring approximately 1000µm in height and 333µm in width D) Dimensions, print times, and tip radii of biodegradable microneedles (n=9) shown in Figure 3.
Scale bars measure 500µm. All data are represented as mean ± SD ... 110 Figure 3.10 Skin insertion tests. Sites of skin penetration from CLIP Microneedle
arrays made of A) PCL B) TMPTA C) PEG and D) PAA on murine skin can be visualized using a tissue marking dye. E) No insertion sites are visualized on a piece of control skin to which no microneedles were applied. Scale bars
measure 1mm. ... 111 Figure 3.11 Rhodamine loaded CLIP MNs. Incorporation of rhodamine does not alter
structure of A) PEG, B) PCL or C) PAA MNs characterized by ESEM.
Rhodamine distributes throughout D) PEG, E) PCL, and F) PAA MNs needles visualized via confocal microscopy. The rhodamine channel is displayed in
purple. Scale bars measure 500µm. ... 113 Figure 3.12 Rhodamine release rates Rates of rhodamine release from A) PEG, PCL
xix
Figure 3.14 Ex-vivo skin penetration and dye release. H&E stained skin sections show A) epidermal breach upon application of PAA microneedles but B) no epidermal breach in untreated control. C) The application of rhodamine containing polyacrylic acid microneedles releases rhodamine into the skin. D) No fluorescence is visualized in sections to which no microneedles were
applied. All scale bars measure 100µm. ... 116 Figure 3.15 Tip loaded CLIP microneedles. The base of the microneedle is composed
of PCL and rhodamine. The tip of the microneedle is composed of polyacrylic acid encapsulating fluorescein as a fluorescent drug surrogate. Scale bar
measures 500µm. ... 117 Figure 3.16 Tip-loaded CLIP microneedles release entire payload in skin. Scale bars
measure 1mm. ... 119 Figure 3.17 Microneedle transwell study. A) Diagram of experimental design, which
shows the microneedle containing porous transwell incubating in a cell culture plate B) MTT Assay for A549 cells incubating with one PEG, PCL, or PAA
microneedle patch over 24 to 72 hr... 121 Figure 3.18 Cell viability of A549 and HuVEC cells incubated with A) PEG and B)
PCL MNs over 24, 48, and 72 h. Data are presented as mean±SD with n=3
wells per timepoint ... 122 Figure 3.19 Oligomer toxicity and IC50 values. A) Toxicity of monomers on A549
cells B) Toxicity of monomers on HuVEC cells C) IC50 values of monomers on A549 and HuVEC cells. Concentrations are given as volume of monomer
divided by total solution volume... 123 Figure 3.20 Soluble and low molecular weight fraction of PEG, PCL, and PAA MNs ... 125 Figure 3.21 Cytotoxicity of Purified and Unpurified PAA MNs. Unpurified MNs
were tested directly after printing plus a brief acetone wash. Purifed MNs were tested after the brief acetone wash plus post cure plus 48 hours of
xx
Figure 3.22 Reaction scheme for PCL-trimethacrylate synthesis. PCL was
functionalized by reacting hydroxyl groups from a PCL-triol with methacryloyl chloride. 1H NMR spectrum confirms methacrylate functionalization with peaks at 6.08 (c), 5.54 (b) and 1.93 ppm (d). Degree of functionalization was determined to be 89% by comparing the peak areas corresponding to the vinyl protons (c and b, 6.08 and 5.54 ppm) to the protons of the methyl
group in the PCL backbone (a, 0.89 ppm). ... 130 Figure 4.1 Typical Stress-Strain Curve ... 139 Figure 4.2 Skin Penetration on Murine and Porcine Skin A) PAA, B) TMPTA,
C) PCL, and D) PEG CLIP microneedles effectively pierce murine skin, but the E) negative control shows no sites of penetration. F) PAA and G) TMPTA microneedles effectively pierce porcine skin, but H) PCL microneedles, I) PEG microneedles and J) the negative control show no
sites of penetration. Scale bars measure 1mm. ... 141 Figure 4.3 Stereolithographic Working Curve and Resin Properties for PEG Blends.
A) The cure depth of microneedle resins as a function of applied dosage B) Absorption coefficient and critical exposure of microneedle resins determined from the working curves in figure A. The build parameters for
each resin were calculated as described in Chapter 4 and are also listed. ... 143 Figure 4.4. CLIP Microneedles Fabricated from PEG Blends. CLIP Microneedles
are fabricated from A) Neat PEG550-dMa and B)50-50, C)67-33, D) 59-41, and E)50-50ratios of PEG550-dMa to EG-dMa. All formulations are mixed
with 2.5wt% TPO as a photoinitiator. Scale bars measure 500µm... 144 Figure 4.5 Mechanical Properties of PEG Blends. A) Young’s moduli, B) Failure
stress and C) Strain at failure for all PEG blends. Failure stress and strain at failure were determined using a zero slope method. Data are presented as
mean ±SD (n=3) ... 146 Figure 4.6 Gel Fraction and Solvent Uptake of PEG Networks. Cylindrical test
samples and microneedle patches were found to have similar A) gel fractions
xxi
Figure 4.8. Quantification of Force of Thumb. A) Force vs. time curves for ten participants applying microneedle patches to porcine skin B) Quantification of the force applied by each of ten participants directly to the microneedle patch and to the compression plates. These forces correspond to the diagram in Figure 5.7 B and C, respectively C) Rate at which the force is applied
and released from the microneedle patch for each of the ten participants ... 149 Figure 4.9 PEG Microneedle Arrays After Application with 75N Force.
Microneedles composed of A) PEG550dMa, B)PEG550dMa-EGdMa 75-25, C) PEG550dMa-EGdMa 67-33, D) PEG550dMa-EGdMa 5941,
E) PEGdMa-EGdMa 50-50, and F) PEG550dMa-EGdMa 75-25 remain intact
after application. Scale bars measure 500µm. ... 151 Figure 4.10 Assessment of Percent Insertion Using Tissue Marking Dye. Some
microneedles arrays A) do not insert into the skin, B) partially insert into the skin or C) completely insert into the skin. Percent penetration is taken by dividing the number of penetration sites visualized by the total number
of microneedles in an array (64 microneedles). Scale bars measure 1mm. ... 152 Figure 4.11 Percent of needles that puncture skin as a function of insertion force.
Arrays of 64 microneedles composed of a variety of PEG blends were applied to porcine skin ex vivo with A) 6N, B) 12.5N, C) 25N, or D) 75N of force. Data is presented as mean ±SD (n=6) of the percent of microneedles inserting into skin, calculated by dividing the number of insertion sites by the total number of microneedles in the array. The dotted line represents 90% of
microneedles inserting into the skin. ... 154 Figure 4.12 OCT Experimental Setup and Images. A) Images were obtained by
pointing the laser through the backing of the applied microneedle patch into skin. B) HH image of blank microneedle array in porcine skin. C) HV-HH
overlay of microneedle array containing GNRs ... 158 Figure 4.13 Depth of Penetration of PEG Blends. A) Depth of penetration of
microneedle arrays as determined by OCT. B) The same data is given numerically. Data are presented as mean±SD between arrays (n=3 arrays), where the average penetration depth for each array is calculated from n=32
xxii
xxiii LIST OF TABLES
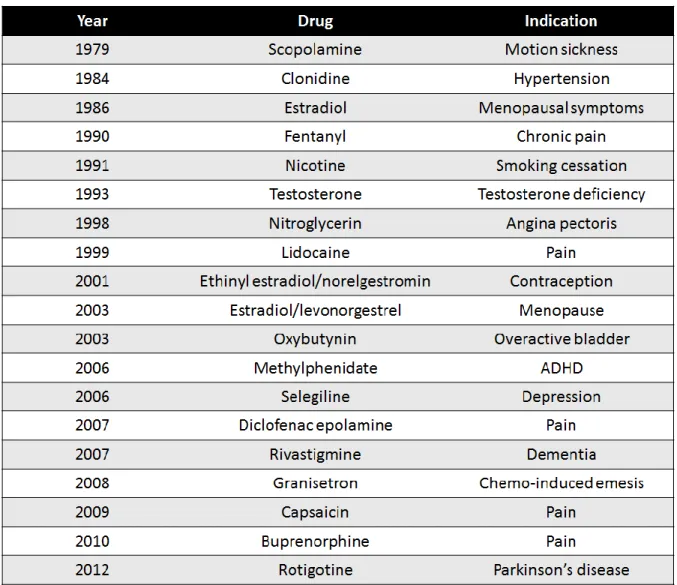
Table 1.1 Generations of Transdermal Drug Delivery ... 2 Table 1.2 List of medications FDA approved for systemic delivery using a
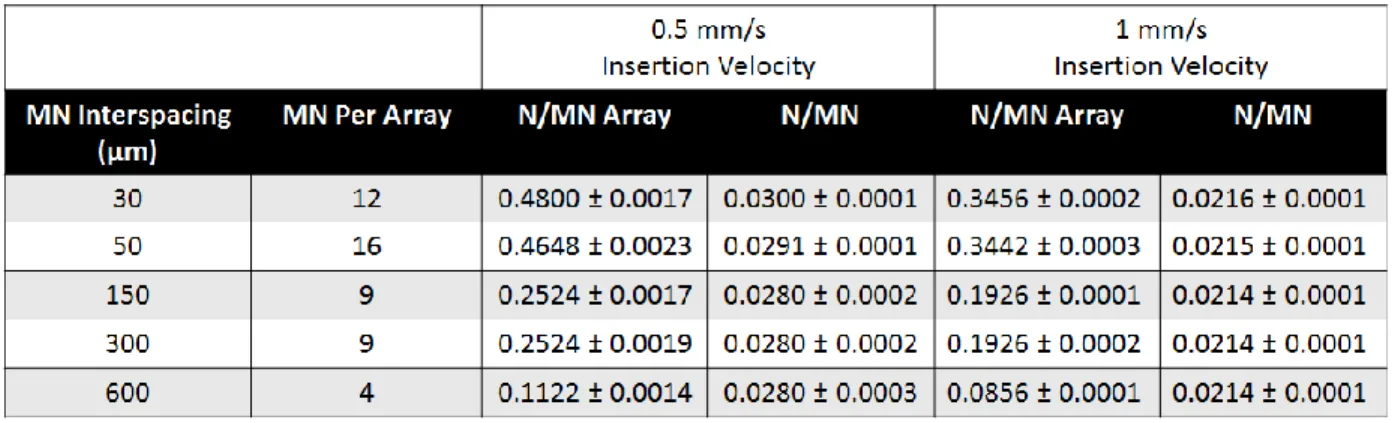
transdermal patch. Table adapted from reference 11. ... 3 Table 1.3 Advantages of Transdermal Drug Delivery ... 4 Table 1.4 Force Required for Microneedle Insertion as a function of spacing
between needles, the total number of microneedles per array, and the velocity of insertion. Forces are given as both Newtons per array and Newtons per
microneedle on that array. Table adapted from reference 112. ... 25 Table 2.1 Comparison of GDI and GDI+ Pixel Grayscale Assignments ... 75 Table 2.2 MNs of Different Heights Truncate without Z Scale Factor. Dimensions
of all MNs show truncation in z direction, but minimal shrinkage in the
x-y direction. Data are presented as mean±SD, n=9 ... 82 Table 2.3 CLIP 3 Specifications ... 87 Table 2.4 CLIP 7 Specifications ... 88 Table 3.1 Build Parameters for Biocompatible CLIP Microneedles ... 110 Table 3.2 Comparison of Extractable Fractions and Monomer IC50 values. When
complete release of the extractable fraction produces concentrations (row 1) that are higher than the IC50 value, the IC50 value is shown in red. When complete release of the extractable fraction produces concentrations (row 1)
that are lower than the IC50 value, the IC50 value is shown in green. ... 127 Table 4.1 Composition of PEG Blends Utilized in Chapter 5 ... 142 Table 4.2 Dimensions of CLIP Microneedles Fabricated with PEG Blends. Data
are presented as mean ±SD (n=9). No statistically significant difference in microneedle dimensions were found. Statistics were performed via one way
xxiv
LIST OF ABBREVIATIONS AND SYMBOLS
3D three dimensional
A area
α absorption coefficient
AA acrylic acid
ABS acrylonitrile butadiene styrene API active pharmaceutical ingredient
AR aspect ratio
ASTM American Society of the International Association for Testing and Materials Bis-GMA 2,2-bis[4-(2-hydroxy-3-methacrylolyloxypropyl)phenyl]propane
BSA bovine serum albumin
c speed of light
CT cured thickness
CAD computer aided design
CLIP Continuous Liquid Interface Production
cm centimeter
CMC carboxymethylcellulose
CQ camphorquinone
D lens aperature
d distance
xxv DCM dichloromethane
DLP digital light processing dMa dimethacrylate
DNA deoxyribonucleic acid DPI dots per inch
DSC differential scanning calorimetry Ε strain (Chapter 4)
E exposure (all other chapters and appendices) EC critical exposure
EDHA electrohydrodynamic atomization Erf error function
ESEM environmental scanning electron microscopy DRIE deep reactive ion etching
F force
f focal point
FDA Food and Drug Administration FDM fused deposition modeling FEI Field Electron and Ion Co.
G grayscale value
GA glycolic acid
GDI graphic device interface GNR gold nanorod
xxvi GPC gel permeation chromatography GRAS generally recognized as safe
h height
ho height of an object hi height of an image
1H NMR proton nuclear magnetic resonance HCl hydrochloric acid
HEMA hydroxyethyl methacrylate
HH horizontal, horizontal polarization HIV human immunodeficiency virus
HP Hewlett-Packard
hr hour
HuVEC human umbilical vein endothelial cells HV horizontal, vertical polarization
hv light
Hz Hertz
I initiator species (Chapter 2)
I light intensity (all other chapters and appendices) IACUC Institutional Animal Care and Use Committee IC50 half maximal inhibitory concentration
Inc. Incorporated
xxvii kp rate constant for polymerization
kPa kilopascal
KOH potassium hydroxide
LA lactic acid
LED light emitting diode ln natural logarithm
M magnification (Chapter 2) M· monomer containing free radical [M] concentration of monomer
MA maleic anhydride
MAcCl methacrylol chloride MED minimum effective dose
MeOH methanol
min minute
mJ millijoule
mL milliliter
mm millimeter
MMA methyl methacrylate
mN millinewton
MN microneedle
mol mole
MPa megapascal
xxviii
mW milliwatt
MW molecular weight
N Newton
n number
NaOH sodium hydroxide
nm nanometer
NMR nuclear magnetic resonance
NSAIDs nonsteroidal anti-inflammatory drugs OCT optical coherence tomography
PAA polyacrylic acid
PBS phosphate buffered saline
PC polycarbonate
PCL polycaprolactone
PCL1110-tMa polycaprolactone 1110 trimethacrylate PDMS polydimethylsiloxane
PEG polyethylene glycol
PEG550-dMa polyethylene glycol 550 dimethacrylate PEG-dMa polyethylene glycol dimethacrylate PLA polylactic acid
PLGA poly(lactide-co-glycolide) ppm parts per million
PSF point spread function
xxix PVA polyvinyl alcohol
PVME polymethylvinyl ether PVP polyvinylpyrrolidone
r radius
R· free radical
Ri rate of initiation Rp rate of polymerization R&D research and development RGB red green blue
RPMI Roswell Park Memorial Institute medium r.t. room temperature
RTP resolution test pattern
s second
SD standard deviation
SEM scanning electron micrograph SLA stereolithography
SLS selective laser sintering STL standard tessellation language SVG scalable vector graphics
t time
TEA triethanolamine
xxx TMPTA trimethylolpropane triacrylate
TPO diphenyl (2,4,6- trimethylbenzoyl) phosphine oxide u scalar function of a wave
UDMA 1,6-bis-[2-methacryloloxyethoxycarbonylamino]-2,4,4-trimethyl hexane UNC University of North Carolina
UV ultraviolet
v volume
W width
Wi initial weight
Ws weight after solvent uptake
w0 radius of a Gaussian light distribution
wt weight
X unspecified chemical compound z distance or coordinate along the z axis
zR Raleigh length
°C degrees Celsius
% percent
® registered
λ wavelength
μL microliter
µm micrometer
σ stress
1
CHAPTER 1 MICRONEEDLE TECHNOLOGY FOR TRANSDERMAL DRUG DELIVERY
1.1 Transdermal Drug Delivery 1.1.1 Drug Delivery Market
The discovery and development of new therapeutics is a massive effort, both in the United States and abroad. Major pharmaceutical companies in the United States spend
approximately $50 billion dollars in collective annual R&D spending, with an average cost to market of a new molecular entity averaging $1.8 billion dollars.1 Pharmaceutical sales in the United States account for approximately 40% of global sales, which are estimated at a formidable $1.1 trillion dollars.2 The ability to deliver these valuable active pharmaceutical agents (APIs) to their site of action within the body is critical to their therapeutic efficacy, but drug delivery remains a substantial challenge.3 Although oral delivery is the most widely utilized route of administration, many drugs suffer from poor oral bioavailability1 due to a variety of factors including poor solubility, degradation within the gastrointestinal tract, poor absorption through the stomach wall, and first pass metabolism in the liver and spleen4. These challenges are particularly significant for the delivery of protein and nucleic acid based therapeutics, which accounted for 71% of revenue for the top ten selling pharmaceutical products in 2012.5 Many strategies have been utilized to increase bioavailability, including computational approaches designed to improve drug properties (solubility, potency, toxicity, etc.),6,7 chemical
2 1.1.2 First Generation Transdermal Drug Delivery
One alternative to hypodermic injections is transdermal drug delivery, wherein a
therapeutic of interest is delivered through the skin. Transdermal drug delivery has the potential to improve bioavailability by enabling drugs to traffic directly through the skin and into the blood stream, bypassing the stomach, liver, and spleen.10-13 The transdermal drug delivery
market is estimated at $30 billion dollars globally, making up over 12% of the total drug delivery market. 11
The advancement of transdermal drug delivery technologies has been described as having three evolutionary “generations”,10 as shown in Table 1.1. First generation transdermal drug delivery refers to any transdermal drug delivery technology that introduces an API to systemic circulation via passive diffusion through the skin. It should be noted that ointments and creams used for the treatment of local skin conditions, such as sunscreen, antibiotics used to treat acne and other skin-laden bacterial infections, and corticosteroids used for psoriasis, eczema, and dermatitis are topical treatments, not transdermal delivery systems because they do not seek to deliver the API into systemic circulation. In 1979, the first transdermal patch was FDA approved for the delivery of scopolamine to treat motion sickness.11 Transdermal patches are drug-containing matrices (solid, liquid, or gel) attached to an adhesive backing. Since this time, 19 different drugs have
3
been FDA approved for systemic delivery using transdermal patches; a list of these medications is provided in Table 1.2. 11 Transdermal patches delivering nicotine for smoking cessation and ethinyl estradiol/norelgestromin for contraception have been particularly successful commercial products that are now commonly used.11 Over one billion transdermal patches are now
manufactured annually.10
Delivery of medication using transdermal patches has several inherent benefits (Table 1.3). Unlike typical hypodermic injections, transdermal patches allow for pain-free drug delivery and can be self-administered without trained medical personnel.11 Most transdermal patches
4
enable sustained release of the drug out of the patch to reduce required dosing frequency; one patch application can be equivalent to days or weeks of daily oral medication.13 For these reasons, delivery of medication using transdermal patches typically results in increased patient compliance when compared to other routes of administration. For example, a recent study of elderly patients with hypertension demonstrated that patients correctly applied a single transdermal patch 96% of the time, whereas daily oral medication was taken as directed only 50% of the time.14 Similar improvements have been reported for contraceptives15 and for
medications used to treat dementia of Alzheimer’s type.16 Moreover, transdermal patches prevent accidental needle injuries by avoiding the generation of sharp, biohazardous wastes.10
Despite these clear advantages, the use of first generation transdermal drug delivery technologies has been severely limited by the structure of the skin,10-13 described in more detail below.
1.1.3 Structure of the Skin
The skin, shown in Figure 1.1A, is composed of three distinct layers: the epidermis, dermis, and adipose tissue1,2. The epidermis is the outermost layer of the skin, measuring
anywhere from 50-1500µm in thickness,17 depending on genetic and environmental factors18 and the area of the body, with the eyelids being the thinnest and the palms and soles of the feet being
5
the thickest. Depending on the region of the body, the epidermis is composed of up to 5 layers 19-20- the stratum basale, stratum spinosum, stratum granulosum, stratum lucidium (only present in some regions), and stratum corneum, moving from the inside outward (Figure 1.1B).
The epidermis is constantly replenished through cellular proliferation followed by sequential differentiation to generate each stratified layer. 19-21 This differentiation process is important because it is the mechanism by which the tough, impermeable outer layer of the skin is eventually produced. Differentiation begins with keratinocyte cells in the stratum basale, the innermost layer of the epidermis.This layer also contains melanocytes, which are responsible for producing pigment, Langerhans cells which are involved in immunity,22 and Merkel cells which are involved in the sensation of touch.19 In the stratum spinosum, the keratinocytes begin to adhere to one another through the formation of desmosomes and to produce polar lipids, contained within lamellar vesicles within the Golgi body.19,21 The stratum spinosum also
contains a high concentration of Langerhans cells. In the stratum granulosum, keratinocytes lose their nuclei and begin to excrete the lipid containing lamellar vesicles into the extracellular
6
space, where they are converted into nonpolar lipids that prevent water loss into the surrounding environment.21 Completion of the differentiation process results in the formation of the
corneocytes that make up the outermost layer of the skin, called the stratum corneum. The
stratum corneum is a densely packed 10-15µm thick layer of dead corneocytes surrounded by the nonpolar fatty acids ceramide and cholesterol.21 Together, these anucleated cells and
extracellular lipids make up a “brick-and-mortar structure” that acts as a formidable barrier against foreign substances only permeated by small, lipophilic substances.21 For this reason, transdermal drug delivery has traditionally been limited to the delivery of hydrophobic compounds measuring less than 500 Daltons in size.10-13
Beneath the epidermis lies the dermis (1-2mm thick), a network of collagen fibers that retains the structural and mechanical integrity of the skin. Unlike the epidermis, which is
composed of 95% keratinocytes and a high concentration of T cells,23 the dermis also contains a network of capillaries, lymphatics, sweat glands, and a high concentration of macrophages, mast cells and resident dermal dendritic cells.19-21 Below the dermis lies the adipose tissue, laden with fat, blood vessels, and the nerve endings responsible for perception of pain.19-21
1.1.4 Advancements in Transdermal Drug Delivery
Many approaches have been developed to improve the skin’s permeability to therapeutic agents in an effort to enable a wider range of therapeutics to be delivered through the skin. Langer and Prausnitz have classified these more advanced, technological approaches as second and third generation transdermal drug delivery technologies (see Table 1.1). 10
7
are typically amphiphilic molecules utilized to temporarily discrupt the physical structure of the extracellular lipids within the stratum corneum to enable small molecule drugs to more easily pass into the skin.10-11 Although many chemical enhancers have been utilized, disruption of the skin has a tendency to cause skin irritation; the development of non-irritating enhancers is an ongoing effort.10-11,24 Iontophoresis, a technique that utilizes an electrical charge gradient to drive small molecules into the skin, has also been successfully utilized,25 but requires complex medical devices to enable successful delivery. 10
8
The remainder of this dissertation focuses on transdermal drug delivery using microneedle arrays, which are described in more detail below.
1.2 Microneedle Technology
Microneedle technology was developed in the 1990s as a novel way to penetrate the skin for transdermal drug delivery.29 Microneedles are arrays of sharp, sub-millimeter sized needles (~100-1000µm in length) that physically pierce the stratum corneum to deliver therapeutics into the body.30 Because these needles create perforations within the skin, they eliminate the need for passive diffusion of the therapeutic through the stratum corneum, thereby allowing therapeutics of any size, ranging from small molecules31-33 to nanoparticles,34-35 to enter the body. Because of their small size, microneedles avoid the nerve endings responsible for pain, which are buried deep within the adipose layer, to enable pain free drug delivery.36-38
The first report of microneedles was a 1998 publication by the Prausnitz lab which utilized silicon microneedles measuring 150µm in length to increase the permeability of the fluorescent drug surrogate calcein by three to five orders of magnitude.29 Since this point in time, the microneedle field has expanded rapidly, with 80 microneedle publications in 2014 alone (Figure 1.2A). Microneedles have been utilized to deliver a wide variety of therapeutics,
including proteins,39-40 nucleic acids,41-42 small molecules,31-33 and nanoparticles34 in pre-clinical and clinical studies. Microneedle technology has been applied to the treatment of a number of different indications (Figure 1.2B), including delivery of insulin for the treatment of
9
Vaccine delivery is an ideal target for microneedle technology for a number of different reasons. Firstly, intradermal vaccination has been associated with improved protection as compared to intramuscular injection.50-55 The vast majority of literature indicates that vaccine delivery using microneedles induces a dose-sparing response, wherein a lower concentration of antigen delivered with microneedles produces equivalent antibody titers to higher concentrations
10
of intramuscularly administered antigen.50-53 A limited number of reports indicate higher antibody titers than intramuscular and subcutaneous controls.54-55
These improvements in immune response are thought to be due to the convergence of a number of different factors. As mentioned previously, the skin contains a high concentration of immune cells, such as the Langerhans cells and dendritic T cells located in the epidermis.10-13,?? The ability to specifically target these immune cells using microneedle technology is thought to improve total immune responses.49 The skin also provides excellent access to the draining lymph node, where activation of dendritic cells, B cells, and T cells occurs.21,56 This improved lymph node access is thought to be a combination of direct migration of antigen through the skin’s extensive network of capillaries and lymphatics and efficient migration of innate immune cells (such as dendritic cells, macrophages, and mast cells) resulting from chemokine signaling in the skin.21,56, 57 Although a number of different investigators have suggested that improved immune responses are also the result of unique properties of Langerhans dendritic cells located into the skin, the role of Langerhans dendritic cells is largely unproven and is a subject of continuing investigations.56-58
11 1.2.1 Microneedle Configurations
Microneedles can be classified into four distinct configurations- hollow microneedles, solid uncoated microneedles, solid microneedles coated with a powdered therapeutic, and polymeric microneedles, each of which differs in its method of application (Figure 1.3).19,30,67 Hollow microneedles are typically made of metal or silicon containing a cylindrical bore; they are utilized for the delivery of liquid formulations which are pumped through the patch into the skin. 19,30,67 Solid microneedles, which are also typically made of metal or silicon, are
temporarily applied to generate holes in the skin before removal. 19,30,67 A topical therapeutic liquid or cream agent can then be applied and allowed to diffuse through the channels created by the microneedle patch. 19,30,67 When microneedles are coated with a dry therapeutic coating, the microneedles are left in the skin to allow the coating to dissolve before removal of the patch. 19,30,67 In addition to these metal and silicon designs, microneedles have also been fabricated
12
from biocompatible materials, such as natural and synthetic polymers.68 In this case, drug is typically directly incorporated into the microneedle matrix, which swells,69 degrades, 68 or
dissolves68 to release the therapeutic into the skin. A pie chart showing the relative distribution of materials used in publications describing microneedle technology between 1998 and 2014 is given in Figure 1.4. Microneedles have been made of metal, silicon, and polymers (including natural and synthetic) with approximately equivalent frequency.
It is worth noting that the distinctions between these different categories are approximate. For the purpose of this dissertation, microneedles are classified based on their drug release mechanism, not their composition. For example, in a few cases, biocompatible or polymeric materials have been utilized to make coated41 or hollow70 microneedle configurations. However, because a PLGA microneedle coated with a therapeutic releases the therapeutic into the body via dissolution of the coating, we would consider a coated PLGA microneedle to be a solid, coated microneedle for the purposes of this dissertation. Conversely, non-polymeric materials such as
Figure 1.4 Distribution of microneedle compositions in literature from 1998-2014. Data compiled from Thompson Reuters Web of ScienceTM
34%
21%
4%
7%
7%
13%
4%
10%
Microneedle Composition
Metal
Silicon
Biodegradable Synthetic
Polymer
Water Soluble Synthetic
Polymer
Crosslinked Polymer
13
Figure 1.5 Frequency of microneedle fabrication techniques and microneedle compositions A. Fabrication techniques utilized in microneedle publications released between 1998 and 2014 B. Frequency of each
14
stainless steel are considered to be biocompatible because they have no adverse reaction with cells in the body.71 However, because drug release from a stainless steel needle would be achieved via a surface coating or through a hollow bore, we would consider a stainless steel needle to be either solid or hollow for the purposes of this dissertation, keeping with convention from microneedle literature. Therefore, throughout this dissertation the term “biocompatible microneedle” is used to refer to a microneedle loaded with cargo which is intended to swell, dissolve, or degrade to release said cargo.
1.2.2 Microneedle Fabrication Techniques
The device type, material, desired geometry, and intended therapeutic payload influences which specific fabrication technology may be selected for device assembly, but the most
commonly used microneedle fabrication techniques are given in Figure 1.5A.
These four different configurations (solid and uncoated, solid and coated, hollow, and biocompatible) have been represented with approximately equivalent frequency in microneedle literature (Figure 1.5B). Solid, uncoated microneedles are slightly more common than solid, coated formulations, presumably due to the large portion of microneedle publications that do not involve the incorporation of a therapeutic. This roughly equivalent prevalence of all microneedle configurations is indicative of the fact that each configuration has its distinct advantages and disadvantages (Table 1.4), making the choice of an optimal microneedle configuration highly situationally dependent. Important factors to consider when selecting the appropriate
15
used (out-of-plane).73 Out-of-plane microneedles have the advantage of having multiple rows of microneedles that form an array, whereas in-plane techniques typically only have a single row. 72-73 Solid metal microneedles are also available from commercial sources.74-75 These simple fabrication techniques enable researchers to investigate how physically breaching the skin affects the skin’s permeability to an existing, topically-applied therapeutic without substantial fabrication efforts. Unfortunately, this topical administration severely limits control over applied dose.76 For this reason, solid, uncoated microneedles can only be used for the delivery of
medications with a large therapeutic window.76
The use of hollow microneedles similarly requires little fabrication effort. Hollow microneedles can be obtained from industrial partners and attached to a standard syringe to administer existing liquid formulations.77 The administration of large volumes of therapeutics is challenging, however, because pumping fluid through micron-sized needles can introduce
pressure buildup within the skin.78-81 Some clinical trials have shown that this pressure buildup is
16
painful to patients, thereby negating the advantage of having a pain-free microneedle based drug delivery system. One source of this pressure buildup is skin tissue at the microneedle tip, which can act as a physical “plug” that prevents fluid flow out of the needle.80 Some investigators have designed hollow formulations with side-openings to circumvent this issue,82-83 but the total volume that can be introduced is a practical limitation. Bulky devices are also sometimes necessary to control the flow of viscous fluids, thereby increasing the cost and complexity of hollow microneedle devices. 84 Together, these disadvantages have lead to an overall decrease in the utilization of hollow microneedle configurations over time (Figure 1.7).
More advanced microneedle configurations- solid, coated microneedles and water-soluble or biodegradable microneedles- provide several advantages. Because these microneedle
17
configurations incorporate the therapeutic directly into the patch, they exhibit improved dose consistency relative to solid, uncoated needles, which rely on topical administration of the therapeutic. Successful administration of medications with smaller therapeutic windows is possible with these improvements in dose consistency. Unlike solid, uncoated and hollow microneedles, more advanced configurations also stabilize therapeutic proteins through
dehydration to enable safe storage at room temperature for several months at a time. 49,59-60 This long term stability provides an opportunity to simplify the global supply chain for all protein based therapeutics by eliminating the need for refrigeration. 49,59-60 The global distribution of protein-based vaccines to remote locations with little access to electricity is a particularly promising application for this technology.49 Together, these advantages have provided an incentive to develop solid, coated microneedles and biocompatible microneedles, despite the increased complexity of fabrication processes for these configurations.
Some important distinctions in the utility of solid, coated microneedles and
biocompatible microneedle configurations can be made. Coated microneedles are arguably more straightforward to fabricate than biocompatible configurations.73 Typically, a two dimensional metal sheet is cut to the desired shape using a laser cutter and electropolished to remove burrs.73 This metal microneedle array is then coated using one of many different techniques, which include dip coating, gas-jet drying, spray drying, electrohydrodynamic atomization (EDHA), or ink jet printing, as reviewed elsewhere.85 However, establishing coating techniques that
18
microneedle fragments accidentally deposited within the skin may trigger an immune response against the microneedle device. 67
Biocompatible microneedles are often considered the gold standard for patient safety.68,87 The use of biocompatible materials eliminates immunological risks associated with needles accidentally fragmenting in the skin.67 Biocompatible microneedles that are dissolvable or biodegradable also eliminate the production of sharp, biohazardous wastes to prevent accidental needle-stick injuries and reduce disease transmission caused by needle re-use. 67-68, 88-89 Careful material selection also provides an opportunity to have rapid or sustained release of a therapeutic into the skin to optimize drug release profiles and maximize therapeutic efficacy. 67-68, 88-89 Altogether, these benefits have led to an increase in the prevalence of biocompatible
microneedles over time in preclinical literature (Figure 1.7). Despite these many advantages and the clear potential of biocompatible microneedle formulations, only one biocompatible
microneedle system, developed by Corium International Inc. has been utilized in clinical trials.90 The goal of this dissertation is to improve the ease and adaptability of biocompatible
microneedle fabrication so that the many advantages of biocompatible configurations (Figure 1.7) can be harnessed in a clinical environment.
1.2.3 Fabrication of Biocompatible Microneedles
Biocompatible microneedles are usually fabricated in three distinct steps: master template fabrication, mold casting, and mold filling.40,68,91 Even though these processes have enabled progress in the microneedle field, they all present challenges which hinder further advancements.
1.2.3.1 Master Fabrication Techniques
In a typical process, a master template is created using traditional microfabrication
19
photolithography.68 Some examples of microneedles fabricated using each of these techniques are provided in Figure 1.8.
Tilted UV photolithography is a common approach to master fabrication.68,87-88 A silicon wafer is first coated with a thick layer of photoresist, typically SU8, and placed in contact with a patterned mask containing an array of transparent squares.68,88,94The complex is then exposed to UV light at an incident angle that defines the resulting microneedle height. 68,88,94 The substrate is rotated and re-exposed a total of four times to produce a negative master containing square pyramidal cavities in photoresist. 68,88,94 More information regarding this process can be found in Han et. al.94 This technique has been successfully and extensively used by Prausnitz68,88,95 to generate square pyramidal microneedles of different sizes. Although this technique is robust, process optimization is time consuming and diffraction of the incident UV light at the tip of the SU8 master has been known to limit the sharpness achievable by this approach.94 It is also
Figure 1.12 Microneedle masters produced using traditional techniques. Microneedle masters have been produced using A) Cryogenic deep reactive ion etching of silicon29 B) Wet etching of silicon93 C) Laser
20
limited to the production of square pyramidal microneedles; more complex geometries have not been produced.
When utilizing deep reactive ion etching (DRIE) for the production of microneedle masters, a silicon wafer is patterned with an etch mask (metal or photoresist) using standard photolithography based techniques.96-97 This patterned wafer is then bombarded with high energy plasma, etching away unprotected regions to create a microneedle structure.96-97 This technique has been utilized to produce ultrasharp microneedles up to 150µm in height29 with etch rates on the order of 1-5µm per minute.98 The height and aspect ratio of generated structures can
theoretically be controlled by altering the chemical composition of the plasma (such as the ratio of SF6 and O2), the plasma density, and total etch times.96,98 This process, however, requires excruciatingly difficult process control to prevent undercutting of the desired structure and to prevent undesired structures from being created from debris in the reactor.96,98 Any change in microneedle size, shape, aspect ratio, or spacing requires a new etch recipe to be generated,98 resulting in long lead times (on the order of months) for new microneedle designs.
21
rate in a particular direction) along silicon’s crystal planes.37,93 For this reason, this approach provides little to no ability to adjust microneedle aspect ratio.37,99
Laser ablation provides the most control over microneedle geometry of current master fabrication processes.34,41, 99 A silicone substrate is exposed to a laser beam which rasters across the surface of the substrate in a pattern defined by a computer aided design file.99 This laser beam etches away the silicon to produce a mold that can be filled using a material of interest.34,41,99 Although this technique provides substantial control over microneedle geometry, the resolution of the technique is limited to about 10µm;100 mold filling processes are still required after master fabrication.
1.2.3.2 Mold Casting and Filling
Following master fabrication, a mold is then cast in polydimethylsiloxane (PDMS)15,24-25 and filled with a formulation of interest.34,68,87 Mold casting is typically the least troublesome of the three fabrication steps (master template generation, mold casting, mold filling), but still has two significant challenges. Mold casting adds an additional time consuming step 34,68,87 and in some cases has also been known to decrease the fidelity of very small features,101 which limits the achievable sharpness of microneedle structures.102
After this mold is cast, it is filled with the material of interest, typically a natural or synthetic polymer such as hyaluronic acid,103 carboxymethylcellulose (CMC),68 maltose,104 chitosan,105 Gantrez,48 polyvinylpyrrolidone (PVP),106 or poly(lactic-co-glycolic acid)
22
therapeutics delivered via microneedle technology, such as proteins and nucleic acids, prohibits heating to high temperatures.68,109 For this reason, most microneedles are fabricated by mixing a polymer with a solvent (typically water), casting this solution over the mold, applying a
centrifugal force to fill the mold, and then allowing the solvent to evaporate over time under vacuum.68.109 This process is sometimes repeated many times to fill the mold.87 The batch-to-batch nature of these techniques combined with long evaporation times (on the order of days) make the mold filling process a laborious endeavor that encumbers microneedle research. 87
1.2.4 Overarching Challenges in the Fabrication of Biocompatible Microneedles Taken as a whole, current microneedle fabrication processes provide little to no opportunity to easily alter microneedle design. Prototyping new microneedle designs is often impractical because of the poorly controlled nature of micromanufacturing techniques and because microneedle fabrication is time consuming, with total fabrication times ranging from 14 to 142 hours per patch.68,110 Because of the expensive equipment and substantial expertise
required, fabrication is typically performed at advanced, centralized facilities where lead time for new microneedle patch designs can be greater than a month long. The need for extensive
process optimization causes microneedle composition and geometry to be dictated by the feasibility of fabrication rather than ideal design,99,111 despite substantial evidence that microneedle design parameters play a critical role in device efficacy, as discussed in the following section.
1.2.5 Role of Microneedle Design Parameters on Device Efficacy
There is an increasing interest in how microneedle design parameters, such as composition and geometry, influence device efficacy.99,111 A diagram which lists several input design
23
the input design parameters and determinants of efficacy is a complex web, where each design parameter affects multiple outcomes associated with device efficacy.
Studies investigating the role of microneedle design parameters, particularly microneedle geometry (including needle height, aspect ratio, spacing, and shape) on device efficacy have been limited. Poor control of existing fabrication techniques,99 combined with their long fabrication times,87 prohibits efficient and cost effective modulation of microneedle design parameters. Nevertheless, some existing studies underscore the importance of deliberate microneedle design.
24
For example, a 2012 study by Olantunji et al investigated how the total number of microneedles in an array influences the force required to insert that array into the skin. 112 Microneedle insertion is affected by a phenomenon called the “bed-of-nails” effect where the total application force applied to an array of needles is divided amongst all of the needles in the array.112 Because a given microneedle array may have a multitude of needles, this effect can substantially increase the total force required to insert a microneedle array into the skin. The bed of nails effect is described quantitatively in equation 1, below, where N is the total number of microneedles in the array.
𝐹𝑠𝑖𝑛𝑔𝑙𝑒 𝑛𝑒𝑒𝑑𝑙𝑒 = 𝐹𝑡𝑜𝑡𝑎𝑙
𝑁 (1)
Olantunji et. al. investigated the force required to enable microneedles made out of a poly methyl vinyl ether- maleic anhydride copolymer to successfully insert into the skin.112 Array interspacing was varied between 30 and 600µm, thereby altering the total number of
25
Another interesting study by Park et. al. investigated microneedle failure force (the force required to break the needle) as a function of aspect ratio.107 The failure force of PLGA
microneedles measuring 200µm across the base with aspect ratios ranging from approximately 3 to 20 was determined using a force-displacement test station.107 This study found that the short microneedles were approximately three times stronger than the high aspect ratio microneedles.107 It is important that microneedle insertion force be substantially less than failure force to provide a high safety margin;30 tailoring microneedle aspect ratio is therefore an important aspect of the design of safe and efficacious microneedle devices.
Another study by Lee et. al. investigated the role of microneedle composition on strength and efficacy of insertion.68 The authors fabricated microneedles from polylactic acid (PLA), amylopectin, carboxymethylcellulose (CMC), and bovine serum albumin (BSA). The Young’s modulus of each microneedle composition was assessed and found to range from 1 to 5GPa (for CMC and PLA, respectively).68 The solubility of each polymer in the solution used to fill microneedle molds was also found to play an important role in the mechanical properties of the resulting microneedle devices.68 The authors suggest, using mathematical modeling, that these differences in Young’s moduli will affect microneedle failure force, but no empirical validation
26
is provided.68 Nevertheless, this work suggests that microneedle composition is also a critical factor influencing microneedle insertion into the skin.68
Other publications have also investigated the role of aspect ratio on failure forces,114 the influence of microneedle height on skin permeability in vitro,115 the role of microneedle
sharpness on insertion forces,116,117 and the role of microneedle application force on depth of penetration.111 Altogether, these results underscore the importance of investigating microneedle design parameters in a high throughput fashion, but the time intensive and poorly controlled nature of current fabrication techniques hinders such investigations. Therefore, this dissertation seeks to develop a rapid, robust and tunable method of fabricating microneedle devices for transdermal drug delivery. We seek to use recent advancements in additive manufacturing to
27
bring an unlimited design space to microneedle manufacturing in order to facilitate a better understanding of how a multitude of different design parameters influence device efficacy.
1.3 Additive Manufacturing Overview
Additive manufacturing, more colloquially known as “3D Printing”, may provide an opportunity to rapidly alter many of the design parameters associated with microneedle fabrication with little to no lead time. These factors include microneedle composition, height, aspect ratio, interneedle spacing, patch size, and microneedle shape, among others. Additive manufacturing, developed in the 1980s, is defined by ASTM F2792-12a as “a process of joining materials to make objects from 3D model data, usually layer upon layer, as opposed to
subtractive manufacturing methodologies” where a bulk material is machined down to produce the desired part.118 Although many different types of 3D Printing have been developed, the vast majority of 3D printing technologies follow the overall process shown in Figure 1.10.119-120 First, a computer aided design (CAD) file of the desired part is created using 3D modeling software such as Solidworks or AutoCAD. This digital part is then computationally sliced along the z axis to produce many layers.119-120 Each of these layers is then sequentially stacked on top of the previous layer to form the desired part.119-120 Typically, each layer is either added as a liquid or powder which is solidified via either a thermal or photochemical phase transition to form a solid part. 119