Department of Mechanical and Precision Systems, School of Science and Engineering, Teikyo University, Utsunomiya 320–8551, Japan
The effect of the coat permeability on the melt velocity of molten aluminum alloy in the expendable pattern casting (EPC) process was investigated experimentally. For eight kinds of coats, the linear relationship between the inter-coat differential pressure and airflow rate was obtained. Coat permeabilities conforming JIS were determined from the gradient of the linear relationship. Using the eight kinds of coats, alu-minum alloy plates were cast by the EPC process for three kinds of expansion ratios of expendable polystyrene (EPS) pattern, in the case of bottom pouring and without reduced pressure. The arrival time of the molten metal was measured and the melt velocity was obtained. The use of high expansion ratios of EPS pattern or high permeability coats led to higher melt velocities. In the high coat permeability region, the melt velocity did not increase so much, even when the coat permeability increased. The effects of the pouring temperature and casting thickness on the melt velocity were also examined. The application of high pouring temperature or large casting thickness, led to higher melt velocity. The experimental values of the melt velocity were compared with the calculated values based on the mold filling model used in the previous study. The experimental values were in relatively good agreement with the calculated values, except for when the coat permeability was high and the casting thickness was small. [doi:10.2320/matertrans.F-M2016821]
(Received April 26, 2016; Accepted June 2, 2016; Published July 8, 2016)
Keywords: expendable pattern casting, aluminum alloy, mold filling, coat permeability
1. Introduction
The expendable pattern casting (EPC) process is very at-tractive, because near net shape castings can be obtained without having to divide and assemble the mold and core, even for complex-shaped casting. Therefore, this process makes it possible to eliminate not only machining steps but also the burr finishing process. Furthermore, because a mold-ing binder is not added to the mold in the EPC process, the environment load can be reduced. Because of the extremely high recycling rate of sand, the cost of packing sand can be also reduced, under the situation where silica sand is replaced with artificial sand. In the EPC process, the molten metal is poured into the cavity produced by the thermal decomposi-tion and liquefacdecomposi-tion of the expendable polystyrene (EPS) pattern. The thermal decomposition gas and liquid resin dis-charge into the dry sand through the coat layer. Therefore, the mold filling mechanism in the EPC process is more compli-cated than when using a cavity mold1). Because of the
dis-charge of the thermal decomposition gas through the coat layer, it is thought that the effect of the coat permeability on the mold filling is significant. When the coat permeability changes, the thickness of the thermal decomposition gas layer between the melt surface and non-decomposition EPS pattern changes. Therefore, it seems that the coat permeability and melt velocity do not have a simple relationship2–4). In
addi-tion, when the pouring temperature and expansion ratio of the EPS pattern change, it seems that the generation rate of the thermal decomposition gas changes and the melt velocity also changes. Especially in the EPC process of aluminum alloys, when the melt velocity is very low, a misrun due to a tempera-ture drop at the melt surface5,6) can easily occur. On the other
hand, when the melt velocity is too high, because
non-decom-posed parts of the pattern become trapped within the molten metal1), internal residue resin defects can easily occur.
There-fore, it is important to estimate the melt velocity in the EPC process. However, there are few mold filling analysis systems that can exactly simulate the EPC process7–9). Therefore, the
accumulated experimental data for the exact mold filling analysis are required.
Recently, a relatively large number of investigations have been conducted on mold filling for the EPC process, such as the research on molten cast iron by Maruyama et al.10,11)
However, few studies have been performed on the mold fill-ing mechanism in the EPC process, such as on the quantita-tive effect of process parameters on the melt velocity2,12).
Es-pecially on the melt velocity for wide range of the coat per-meability, almost no studies have been reported. In a previous experimental study13), for three coats with different
permea-bilities, an aluminum alloy plate was cast using the EPC pro-cess, and effects of the casting design and reduced pressure in the flask on the melt velocity were investigated. It was found that the melt velocity did not increase in proportion to the coat permeability. However, because there were few condi-tions on the coat permeability, it is thought that the effect of the coat permeability is not sufficiently understood.
In the present work, for eight coats with further wide range of the coat permeability than a previous report, the coat per-meabilities were measured. To clarify the effect of the coat permeability on the melt velocity in the EPC process, an alu-minum alloy was cast. Additionally, the effects of the pouring temperature, expansion ratio of the EPS pattern, and casting thickness were examined. The experimental values of the melt velocity were compared with the calculated values based on the mold filling model from a previous study2).
2. Experimental Procedure
2.1 Measurement of coat permeability
Figure 1 shows a schematic of the experimental apparatus
*1
This Paper was Originally Published in Japanese in J. JFS 88 (2016) 192–197.
*2
for measuring the coat permeability. The main body of the apparatus was composed of an air pump, rotameter, test coat layer holder, and H2O manometer. Figure 2 shows the details
of the test coat layer holder which was composed of a vinyl chloride cylindrical pipe with an inside diameter of 32 mm, O-ring packing, and aluminum alloy ring support of a coat layer with an inside diameter of 36 mm. The coat slurry was poured into an acrylic pattern with an inside diameter of 38 mm and thickness of approximately 3 mm. After drying, the test coat layer was removed from the pattern. Each test coat layer was formed almost uniform thickness, with a diam-eter of 35 mm and thickness of 2–3 mm. The test coat layer was then set between the airtight packing in the test coat layer holder. The air flow rate from the air pump, which passed a test coat layer, was measured by a rotameter. The inter-coat differential pressure was measured by an H2O manometer.
The maximum differential pressure of the H2O manometer
was set at approximately 40 cmH2O. This differential
pres-sure was equivalent to an aluminum alloy melt head of ap-proximately 170 mmAl. It seems that the condition on this differential pressure was essentially the same as that of the melt head at the melt surface during mold filling, as described in section 2.2. The coat permeability measurements were car-ried out at room temperature (approximately 293 K).
The results of the inter-coat differential pressure were plot-ted as a function of the air flow rate through the coat layer. Based on the assumption of Darcy flow, the coat permeability was determined from the gradient of the plotting. Therefore, this measurement was in accordance with the method14) based
on the JIS mold permeability (JIS Z2603). The coat
permea-bility K is an absolute number with dimension of (cm2·
cmH2O−1·min−1). It is defined in the following equation using
the coat thickness δ (cm), coat layer area s (cm2), volumetric
air flow rate v′ (cm3·min−1), and inter-coat differential
pres-sure ΔP (cmH2O).
K= δv
s∆P (1)
A mica based coat (coat A) and seven kinds of silica based coats (coats B–H) were used in this study. The coat layer of mica based coat (coat A) generally has a high insulation char-acteristics not only a low permeability. The coat permeability of seven kinds of silica based coats was varies by changing the aggregate diameter. Although the thermal conductivity of the coat layer is not mentioned in detail in this paper, the ther-mal conductivity of the mica based coat (coat A) was approx-imately one-third that of the silica based coats. Even with different aggregate diameters for silica based coats (coat B–H), the thermal conductivity of the coat layer did not change significantly5).
2.2 Measurement of melt velocity
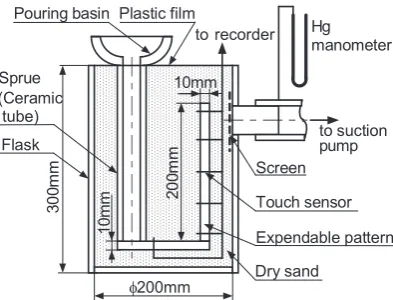
Figure 3 shows a schematic of the casting apparatus used in the experiments, which was similar to that used in a previ-ous study5,6). The steel molding flask was a cylindrical vessel
with an inside diameter of 200 mm and depth of 300 mm. The EPS pattern has a plate shape that is 70 mm wide, 200 mm high, and 10 mm thick. As shown in Fig. 3, the cluster of the bottom pouring system was assembled with the EPS pattern so that the depth direction was 70 mm. The EPS pattern with dimensions of 200 × 70 × 5 mm was used in some cases. Three kinds of EPS patterns with expansion ratios of 30 times (density = 29 kg·m-3), 60 times (density = 18 kg·m-3), and
100 times (density = 11 kg·m-3) were used. A ceramic tube
(25 mm inside diameter, 35 mm outside diameter, and 300 mm length) was used as a sprue from the pouring basin to the runner. The pouring basin was an insulating sand mold with an inner diameter of 80 mm, depth of 80 mm, and thick-ness of 15 mm. The runner was an EPS plate with a cross section of 35 × 10 mm and length of 125 mm. The cross sec-tion of the ingate was 35 × 10 mm. Silica sand with a mode diameter of approximately 0.15 mm (AFS grain fineness number 62) was poured into the flask.
Fig. 1 Schematic diagram of experimental apparatus for coat permeability.
Fig. 2 Schematic diagram of test piece holder for coat permeability.
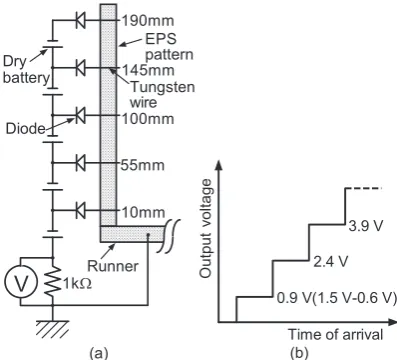
[image:2.595.328.525.69.219.2] [image:2.595.68.268.72.167.2] [image:2.595.67.268.215.383.2]reached a touch sensor. The arrival time ta was defined from
the increasing time in this voltage change chart. In order to determine the arrival time from the ingate, the time when the molten metal reached the ingate, was required. This time was determined by extrapolation from the times when the molten metal reached y = 10 mm and y = 55 mm.
Eight kinds of coats as shown in Table 1, which have been measured by the method in 2.1 were used in this study. The EPS pattern was coated using a dipping method. The coated pattern was then dried for 24 h in a drying furnace at 323 K. Each coat was applied so that the thickness of the coat after drying was approximately 1 mm.
The aluminum alloy JIS AC2A (A319 equivalent) was used as a casting material. It was melted in a high frequency elec-tric induction furnace and cast directly from the furnace. The pouring temperature was set at approximately 1073 K. How-ever, some conditions required a pouring temperature of ap-proximately 973 K. During pouring process, the distance from the bottom of the pouring basin to the melt surface was maintained at approximately 50 mm. As a result, the melt head at the melt surface during mold filling decreased from approximately 350 mmAl to 150 mmAl. Only atmospheric pressure was applied as the pressure conditions in the flask during the pouring process and mold filling. Only the bottom pouring system was applied as the casting design, as shown in
function of the air flow rate through the coat layer v. The pa-rameter δ in each figure represents the thickness of the test coat layer. Figure 5 shows the experimental results for coats A–C. Figure 6 shows the experimental results for coats D–H. Because the range of the air flow rate v for the differential pressure range ΔP = 0–40 cmH2O, differs significantly de-pending on the coat type, the results for coats A–C and those for coats D–H were plotted in different figures. For all coats, the figures show a linear relationship passing through the ori-gin, between the differential pressure and air flow rate. There-fore, under the conditions in this work, the air flow rate
Fig. 4 Schematic diagram of touch sensor of molten metal. (a) Wiring dia-gram, (b) Output voltage.
Table 1 Experimental results of coat permeability.
Test cast A B C D E F G H
δ/cm 0.24 0.24 0.26 0.27 0.26 0.34 0.35 0.31 Permeability 0.13 0.41 0.81 1.7 2.6 5.1 10 45
Fig. 5 Relationship between differential pressure ΔP and air flow rate v for coats A,B and C.
[image:3.595.68.267.496.676.2] [image:3.595.324.524.567.762.2] [image:3.595.48.290.747.789.2]through the coat layer is proportional to the pressure gradient in the coat layer. The air flow in the coat layer is considered to exhibit Darcy flow. As a result, the coat permeability can be calculated by eq. (1). As seen in Figs. 5 and 6, the air flow rate at constant differential pressure increases in the order of coat A to H. The coat permeability also qualitatively increases in this order. In this work, the coat permeability K was deter-mined using the air flow rate v and inter-coat differential pres-sure ΔP where the differential pressure is the largest.
Table 1 shows the experimental values of the coat bility obtained from eq. (1) for coats A–H. The coat permea-bility of coat A, which was the smallest among the eight kinds of coat shown in Table 1, is K = 0.13. Although coat A has high insulating characteristics due to large void as compared with the silica based coats B–H, the coat permeability is very low due to the air flow which rotates around the mica plate. The differences in the coat permeabilities of coats B–H are dependent on differences in the air flow resistance in the ag-gregate bed due to large differences in the agag-gregate diame-ters. The coat permeability of coat H which has the highest permeability, is K = 45, which is approximately 350 times that of coat A. The range of test coat thicknesses δ shown in Figs. 5 and 6, is 0.24–0.35 cm. In order to examine the effect of test coat thickness, for several kinds of coat layer thickness in the range of 0.2–0.4 cm, the relationships between the in-ter-coat differential pressure ΔP and air flow rate v were mea-sured using coat D. It was found that there was little differ-ence in the calculated coat permeability under each condition. Therefore, it is thought that the coat layer thickness had little effect on the measured value of the coat permeability under the conditions in this work.
3.2 Experimental results for melt velocity
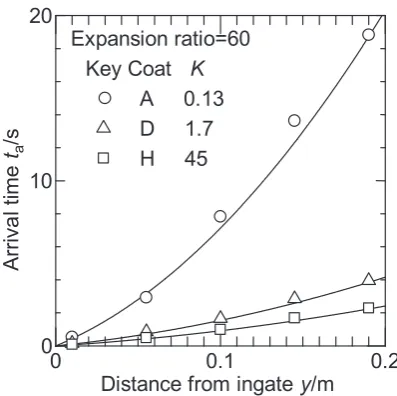
Figure 7 shows an example of the experimental results of the mold filling for the arrival time of the molten metal ta as a
function of the distance from the ingate at the pattern bottom
y, for coats A, D, and H, for a 60 times EPS pattern expansion ratio. The arrival times of the molten metal in Fig. 7 were obtained from the touch censors, as shown in Fig. 4(b).
Fig-ure 8 shows a plot similar to that in Fig. 7, for the effect of the expansion ratio of the EPS pattern for coat D (K = 1.7). As can be seen in these figures, with increasing the coat permea-bility K or increasing the expansion ratio of the EPS pattern, the arrival time of the molten metal decreases. As the coat permeability or expansion ratio of the EPS pattern increases, the thickness of the thermal decomposition gas layer decreas-es. As a result, it seems that the thermal decomposition of the EPS pattern is enhanced by an increase in the heat transfer from the molten metal to the EPS pattern2). As in either case
shown in Figs. 7 and 8, with increasing the distance from in-gate y, the gradient of the arrival time increases, and the melt velocity decreases. The reason for this may be the gradual decrease in the melt head, as the molten metal fills. The ten-dency described above was also observed under other experi-mental conditions in this work. Therefore, as the melt veloci-ty in next figures, the average velociveloci-ty which was calculated from the arrival time difference at 10 mm and 190 mm, was used.
Figure 9 shows the experimental values of the melt
veloci-Fig. 7 Effect of coat permeability K on arrival time ta for pattern expansion
ratio of 60 times. Fig. 8 Effect of pattern expansion ratio on arrival ta
time for coat permea-bility K = 1.7.
[image:4.595.68.267.67.265.2] [image:4.595.324.525.67.265.2] [image:4.595.325.526.320.495.2]expansion ratio of the EPS pattern is large, the thickness of the thermal decomposition gas layer is thin. As a result, it seems that the thermal decomposition of the EPS pattern is enhanced by increasing heat transfer from the molten metal to the EPS pattern. When the coat permeability is less than ap-proximately 2, the melt velocity increases somewhat monoto-nously with increasing coat permeability. However, when the coat permeability is larger than approximately 2, there is a decrease in the rate of increase. Although there are some dif-ferences according to the expansion ratio of the EPS pattern, the increase in the melt velocity by the change in K from 2.0 to 20 is approximately one-half that in K from 0.2 to 2.0.
The lines in Fig. 9 represent the calculated values based on the mold filling model2) from a previous study. A summary of
this mold filling model is given as follows. The cases in which the molten metal was poured into the cavity formed by the thermal decomposition of the EPS pattern, and the decompo-sition gas discharges into the dry sand through the coat layer, were considered. Furthermore, the thermal decomposition and gas discharge were considered to proceed under a dy-namic equilibrium state, in which the pressure in the gas layer equal to the melt head was maintained11). Even in the
calcu-lated results, because the melt head decreases gradually with increasing the distance from the ingate, the melt velocity also decreases gradually. Therefore, as with the experimental re-sults, the average melt velocity was determined from the ar-rival time to the distance from the ingate y = 200 mm. When the coat permeability is less than approximately 2, the exper-imental values of the melt velocity are in relatively good agreement with the calculated values. On the other hand, when the coat permeability is larger than approximately 2, because the increase in the experimental melt velocity by the increase in the coat permeability decreases, the experimental value of the melt velocity is smaller than the calculated value. The reason for this may be as follows. It is considered that the thermal decomposition rate of the EPS pattern is a finite val-ue, and that the thermal decomposition rate becomes a rate controlling step for the melt velocity. Furthermore, the effects of the resistance of the melt flow at the runner and permeabil-ity of the dry sand mold which has a finite value (≈75)15), are
considered. However, because Fig. 9 does not indicate a clear cause for these results, in the future, a modification of the mold filling model2) in the high permeability region will be
necessary. Therefore, it is seemed that accumulated experi-mental data are required.
Figure 10 shows the experimental values of the melt veloc-ity u in the case of the 60 times expansion ratio of the EPS pattern, as a function of the coat permeability K, with the pouring temperature as a parameter. As can be seen in Fig. 10, the use of a high pouring temperature leads to a high melt velocity. When the pouring temperature increases, because of the increase in the melt surface temperature, the heat flux due
to the radiation and heat conduction between the melt surface and non-decomposition EPS pattern increases, and the ther-mal decomposition rate also increases. On the other hand, because of the increase in the thermal decomposition gas thickness, the heat flux by the heat conduction between the melt surface and EPS pattern conversely decreases. Among these effects, it is considered that the former effect is larger. In the calculated values based on the mold filling model shown by each line in Fig. 10, when the pouring temperature is higher, the melt velocity increases by the abovementioned effect. Also, the experimental values of the melt velocity for the pouring temperature of 973 K were compared with the calculated values. As in the case at 1073 K, when the coat permeability is less than approximately 2, the experimental and calculated values are in relatively good agreement. When the coat permeability is larger than approximately 2, the ex-perimental value of the melt velocity is smaller than the cal-culated value.
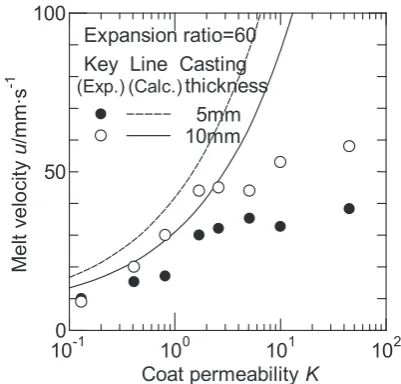
Figure 11 shows the experimental values of the melt
veloc-Fig. 10 Effect of pouring temperature on melt velocity u for pattern expan-sion ratio of 60 times.
[image:5.595.325.526.309.501.2]ity u in the case of the 60 times expansion ratio of the EPS pattern, as a function of the coat permeability K, with the casting thickness as a parameter. For the casting thickness of 5 mm, when coat A or coat B which had low coat permeabil-ity was used, because the mold filling was incomplete, the average melt velocity was determined from the time to the touch sensor which the molten metal reached finally. As shown in Fig. 11, even in the case of the casting thickness of 5 mm, in the high coat permeability region, the similar ten-dency in which the melt velocity does not increase so much with increasing coat permeability, is observed. When the ing thickness decreases, the specific surface area of the cast-ing increases, and the generation rate of the thermal decom-position gas per unit coat area decreases. Thus, it is consid-ered that the melt velocity increases by the decrease in the gas layer thickness. Therefore, the calculated value of the melt velocity for the casting thickness of 5 mm shown in Fig. 11 is larger than that of 10 mm. On the other hand, the experimen-tal values of the melt velocity for the casting thickness of 5 mm are conversely smaller than those of 10 mm. The rea-son for this may be as follows. Because the temperature drop of the melt for the casting thickness of 5 mm is larger than that of 10 mm, the effect of the viscosity increase of the mol-ten metal is significant.
4. Conclusion
In order to examine the effect of the coat permeability on the melt velocity of molten aluminum alloy in the EPC pro-cess for eight coats with different permeabilities, aluminum alloy plates were cast by the EPC process using three kinds of EPS patterns with different expansion ratios, and the arrival times of the molten metal were measured. The following con-clusions were obtained under the conditions of this work.
(1) The use of a high permeability coat or an EPS pattern of high expansion ratio led to a high melt velocity.
(2) As the pouring temperature or casting thickness in-creased, the melt velocity increased.
(3) In the high coat permeability region, even if the coat permeability increased, the melt velocity did not increase sig-nificantly.
(4) Except for the case in which the coat permeability was large and the case in which the casting thickness was small, the experimental values for the melt velocity were in relative-ly good agreement with the calculated values based on the mold filling model from a previous study.
REFERENCES
1) F. Sonnenberg: LOST FOAM casting made simple, (American Found-ry Society) (2008).
2) S. Koroyasu: J. JFS 81 (2009) 377–383.
3) J. Zhu, I. Ohnaka, T. Ohmichi, K. Mineshita and Y. Yoshioka: J. JFS 72 (2000) 715–719.
4) I Ohnaka, T. Ohmichi, J. Zhu, Y. Hagino, B. Yamamoto and K. Shinano: Report of JFS Meeting 138 (2000) 101.
5) S. Koroyasu and A. Ikenaga: Mater. Trans. 53 (2012) 224–228.
6) S. Koroyasu and M. Matsuda: J. JFS 76 (2004) 687–694. 7) K. Kubo and H. Asao: Report of JFS Meeting 146 (2005) 23. 8) Y. Hotta, H. Yamagata, M. Nikawa, I. Ohnaka, Y. Tate and Y. Mizutani:
Report of JFS Meeting 162 (2013) 82. 9) F. Kinoshita: J. JFS 86 (2014) 927–930.
10) T. Maruyama, N. Miyazaki and T. Kobayashi: Report of Kansai Branch JFS Meeting (2011) 4–6.
11) T. Maruyama, K. Katsuki and T. Kobayashi: J. JFS 78 (2006) 53–58. 12) M.R. Barone and D.A. Caulk: Int. J. Heat Mass Transfer (2005) 4132–
4149.
13) S. Koroyasu: J. JFS 86 (2014) 447–453.
14) EPC Process Technical Meeting: Characteristic and Standardization of Coat for EPC Process (Kansai Branch of JFS) (1996) 18.