Friction Coefficient in Hot Compression of Cylindrical Sample
Yunping Li, Emi Onodera and Akihiko Chiba
*Institute for Materials Research, Tohoku University, Sendai 980-8577, Japan
In order to analyze the evolution behavior of friction coefficients during large strain hot forging processes, compression tests were carried out on IHS38MSV hypoeutectoid steel samples at a stroke rate of 1.2 mm/s and temperatures ranging from 1073 to 1473 K. The simulation results of the geometrical change in the sample during the compression process obtained by using various friction coefficients were compared with experimental results in order to verify the validity of the ‘‘instantaneous friction coefficient’’. The results showed that the friction coefficient was a constant at lower strain level, and the instantaneous friction coefficient,ms, showed an approximately exponential relationship at higher strain level. The simulation results obtained by usingms showed better results as compared to those obtained by using average friction coefficients (mcandma). It was also found from the simulation results that at a certain strain level, the variation of friction coefficient did not have a strong effect on the shape of deformed sample; however, the radius of the top surface of the sample,Rt, changed greatly due to friction. [doi:10.2320/matertrans.M2010056]
(Received February 15, 2010; Accepted April 16, 2010; Published June 2, 2010)
Keywords: hot forging process, instantaneous friction coefficient, average friction coefficient, barreling factor
1. Introduction
During hot forging processes, friction plays a significant role in determining the life of tools, the formability of the work materials, and the quality of the final products such as, surface, internal structure, and product properties. Numerous researches have been carried out for either reducing or determining the friction coefficient during hot forging processes.1) In general, lubricants are added to reduce the friction coefficient. However, friction cannot be reduced to a negligible level, especially during high temperature forming processes, because the majority of high-quality lubricants used at ambient temperatures are organics that cannot withstand high temperatures. A number of lubricants have been developed to be used at high temperatures. However, friction after lubrication is still an important issue, because the friction coefficient at high temperatures cannot be lowered to a level comparable to that at ambient temper-atures. A number of studies have been conducted in an attempt to obtain the quantitative data on friction or by using simulative laboratory tests. Frederiksenet al.2)used
friction-testing methods based on the geometrical changes in order to adjust the frictional conditions in the simulation to the condition of the real process. Bay3)studied the application of the friction model when analyses of bulk metal forming process were given. On the basis of these and other results4,5) an upper–bound theory was developed to effectively deter-mine the average friction coefficient by conducting a barrel compression test. Using this theory, the average Tresca friction coefficient (hereafter friction coefficient, m) for the compression test can be determined by measuring just the degree of barreling (maximum radius, Rm, and height
difference of cylinder before and after deformation) after compression process by using the following equation:
m¼
R hb
4
ffiffiffi
3 p 2b
3pffiffiffi3
ð1Þ
wheremis the average friction coefficient for a hot working process, with its value ranging from 0 (perfect sliding) to 1 (sticking friction); b is the barreling factor; and R and h
are the theoretical radius and final height of the sample, respectively.bis given by:6)
b¼4R
R
h
h; ð2Þ
whereRis the difference between the maximum radiusRm
and the radiusRtof top surface of the sample, andhis the
reduction in the height of the cylinder after compression. From the average friction coefficient calculated by eq. (2), the analysis of effects of friction in hot working process and the stress compensation from friction could be carried out effectively.
The understanding of the friction between two surfaces is at the heart of the science of tribology, an interdisciplinary field that involves surface chemistry, materials science, mechanics etc. In practice, direct predicting the friction coefficient at a random strain level is difficult because of the difficulty with measuring the related parameters of specimens simultaneously in the working process; researchers often simply assume that the friction coefficient is constant or independent of the strain level.7) Details regarding the evolution behavior of friction coefficients during the hot forging processes have not yet been clarified. The surfaces of the sample contain hills and valleys when viewed on a microscopic scale. During the hot forming process, the surface conditions of the material, including its profile and temperature, vary gradually with increasing strain level due to contact with tools. At higher strain levels such as those employed during cylindrical hot compression tests, the side surface of the sample came closer to the anvil surface due to barreling, as the strain level increased, and it subsequently came into contact with the anvil surface. This side surface later formed the outmost area of the contacting surface with the anvil when the strain attained a certain level, possibly leading to sticking in this region and subsequently to a great increase in the friction coefficient, as found from some of our preliminary observations; this is considered to be a very important factor in the variation
*Corresponding author, E-mail: [email protected]
of the friction coefficient at large strain levels during hot working processes.
In this study, on the basis of eq. (1) the instantaneous friction coefficient ms is evaluated quantitatively as a
function of strain. The parameters regarding the shape change of the sample during real compression process will be used to compare with the results calculated by DEFORM-3D finite element analysis software by using both the instantaneous and average friction coefficients.
2. Experimental
2.1 Experimental procedure
IHS38MSV hypoeutectoid steel (Sumitomo Metal Indus-tries, Ltd., Japan) was used in the current study. Cylindrical specimens, 8 mm in diameter and 12 mm in height, were cut by electro-discharge machining (EDM) from the outer portion of a huge forged cylinder. Concentric grooves with depths of 0.1 mm were formed on the flat ends surface of the specimen so that the original top surface profile of sample after broadening could be identified easily after deformation. Compression tests were carried out in vacuum at 1073, 1173, 1273, 1373, and 1473 K using a computer-aided hot forging simulator (Thermecmaster-Z). The stroke rate was set as 1.2 mm/s. The temperature was varied from ambient temperature to the test temperatures at a heating rate of 5 K/s by induction heating. The samples were held at the test temperatures for 300 s before compression. The thermocou-ple used was R-type, and the temperature accuracy was approximately 3K. In order to avoid the heat dissipation from sample end surface to the anvil surface at the contact region, mica sheets with a diameter of 20 mm and thickness of approximately 0.2 mm were used as heat insulators closely contacting with the anvil surfaces because of its extremely low thermal conductivity; they were placed close to the anvil surface. In addition, carbon paper was used as an aid to reduce friction owing to its high heat resistance and high lubricating effect.8)The experimental setup is schematically
shown in Fig. 1.
2.2 Finite element analysis
In order to evaluate the evolution behavior of the friction coefficient as a function of the strain level, the samples were compressed to strain levels of approximately 0.2, 0.4, 0.6, 0.8, 1.0, 1.2, 1.4, and 1.6. The average friction coefficients at each strain level were calculated using eq. (1).
A model of the sample, having the same size as that of the actual sample, was generated using the finite element analysis DEFORM-3D v6.13 software. In order to reduce computing time, only one eighth part of the cylindrical sample with enough mesh number of 25000 was carried out. The model of a cylindrical specimen compressed by an anvil from the top at the stroke rate of 1.2 mm/s is shown in Fig. 2.
3. Results and Discussion
Images of the specimens compressed at 1273 K and different strain levels are shown in Fig. 3 along two directions. The results in Fig. 3 were originally presented in our previous research.8) The profiles of specimens
com-pressed at other temperatures were similar profiles to those of the samples at 1273 K. At strain levels lower than approx-imately 0.5, the top surface of the specimens after compres-sion were found to be formed mainly from the end surfaces of the specimens with grooves; in this instance the radius of the top surface,Rt, was approximately equal to that of the
anvil-contacting surface of the deformed specimen,Rc. However,
at higher strain levels (higher than approximately 0.6), Rc
was observed to be formed by both the original top surface of specimen with grooves after broadening Rt and the side
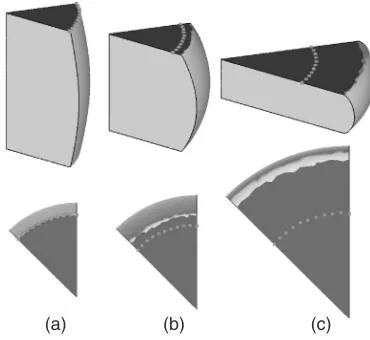
surface of the specimen due to the contacting with anvil. A schematic of the typical end surface of a specimen com-pressed at higher strain levels observed along the longitudinal direction, is shown in Fig. 4; Rt, Rc and Rm denote the
top radius, contacting radius, and maximum radius of the deformed specimen, respectively, and Rc–Rt is the area
formed from the side surface of the specimen due to barreling and the subsequent contacting with anvil. The end surface of the specimen is composed of three parts: the original top surface of the specimen with grooved profilesRt, the surface
come from side surface due to the contacting with anvilRc– Rt, and the barreling side surface probably going to contact
with the anvil surface at higher strain levelsRm–Rc. In this Coils
Lubricants Carbon sheet
Mica
Thermocouple Pressure
Fig. 1 Schematic figure for the experimental setup of compression test.
[image:2.595.353.500.76.302.2] [image:2.595.92.247.649.765.2]instance, Rt was determined by the profiles of the grooves
in calculating the average friction coefficient m by using eq. (1), and they are plotted in Fig. 5 as a function of true strain. The average friction coefficient was observed to increase with the strain level at all the temperatures.
It should be noted that these results do not conform to the conventional viewpoint5) that the friction coefficient is constant and independent of the strain level. In fact, there are several reasons considered for the increase in the friction coefficient with the strain level. First, the top surface of the specimen (with radiusRt) broadened gradually with
increas-ing strain level, causincreas-ing the lubricatincreas-ing effect to wear off as the thickness of the lubricant film decreased gradually during the compression process. In addition, the side surface of the specimen came closer to the anvil surface with increasing strain levels. It finally came in contact with the anvil surface, forming the outmost region of the contacting surface (Rc–Rt)
as schematically shown in Fig. 6, when the strain reached a certain level (approximately 0.5–0.6). At this instant, the friction coefficient increased abnormally due to the absence of lubricant and possibly caused sticking in the outmost area of the contacting surface at higher strain levels. In fact, in our previous research8)we found that the stress at the outmost area of contacting surface was much higher than that in the
center of the surface, which demonstrates the high possibility of sticking in the outmost area of contacting surface at high strain level and supports present friction coefficient increase very well. In this study, the parameters related to eq. (2) such as Rt, Rm, and h were measured three to four times,
and their mean values were used in calculating the friction coefficients. It should be noted that in the previous research,5,6) while calculating the friction coefficient using eq. (1),Rcwas used instead ofRtin thatRtwas assumed to
equal toRcbecause of the difficulty in distinguishing between
2R
t2R
m2R
tTrue strain,
0.5
0.8
0.0
0.2
1.0
1.2
1.4
ε
Fig. 3 Photos of the specimen compressed to different strain levels at 1273 K.
Comes from the side surface
R
tR
cR
mFig. 4 Schematic figures of the end surface of the deformed specimens at
large strain level. Fig. 5 Average friction coefficients, ma of specimens compressed to different strain levels.
(a) (b)
Side surface
Contacting surface Rt
Rc
Rt
[image:3.595.87.506.79.261.2] [image:3.595.318.533.304.462.2] [image:3.595.329.524.517.603.2]them; however, the ambiguity between these two parameters may lead to the incorrect calculation of the friction coefficient.
The results in Fig. 5 indicated that the friction coefficient is not a constant in a compression test. However, the results used in Fig. 5 are the average values of friction coefficient from the beginning of compression to a certain strain level. In a specific compression process, the stress variation due to friction is only related to the friction coefficient at a specific strain level. In order to obtain the real stress-strain response, the friction coefficient at an instant stress-strain level (instantaneous friction coefficient, ms) is considered
extremely necessary. Supposed that mn and mn1 are the
average friction coefficients calculated using eq. (1) when specimens are directly compressed under two strains of "n
and"n1applied in close proximity; then,msat a strain level
ofð"nþ"n1Þ=2is considered to be expressed as the integral
mean value exploration of this small strain range
msð"n1þ"nÞ=2¼ Z"n
0
mnd"
Z"n1
0
mn1d"
"n"n1
¼"nmn"n1m"n1
"n"n1
ð3Þ
where it was assumed that ms followed an almost linear
profile over a very small range of strain; that is, the average friction coefficient over this narrow range of strain levels was considered to be equal to the instantaneous friction coef-ficientmsð"n1þ"nÞ=2 at the strain level ofð"nþ"n1Þ=2.
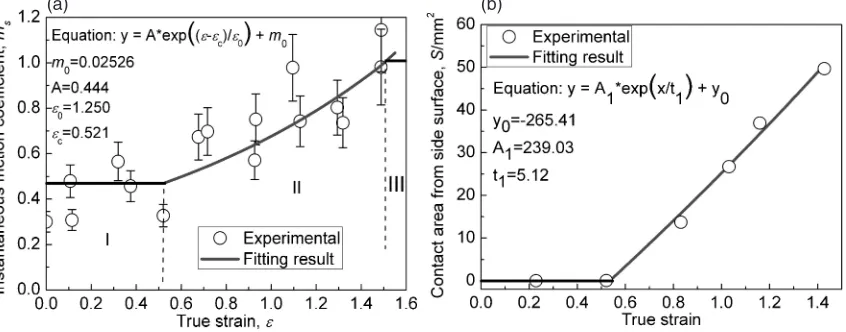
msat test temperature of 1273 K calculated using eq. (3) is
plotted in Fig. 7(a) as a function of true strain. It has to be noted that,msas a function of true strain level could be parted
into three stages, I, II, and III as shown in Fig. 7(a). In the initial stage or lower strain level,msis nearly a constant; with
the increasing in strain level, the barreled side surface of sample become closer to the anvil surface and come in contact finally, leading to the great increase inms; at higher
strain level, a large part of top surface was formed from the contacting between the side surface and the anvil, and the surface formed into a static state with a friction coefficient of 1 (stage III). The values of the initial instantaneous friction coefficients varied from 0.3 to 0.5, indicating very slight
effect of friction or well lubricating during the initial stages of the compression process. In addition, ms did not vary
significantly when the strain level was lower than 0.6 at nearly all temperatures. This may be the reason why in the previous researches the friction coefficient was considered to be constant when the strain level was relatively low. At higher strain levels,msincreased rapidly with the strain, and
a suitable empirical function was derived using an exponen-tial fitting process
ms¼m0þAexpð""c="0Þ ð4Þ
wherem0,A,"cand"0are constants determined by the fitting
process. Equation (4) was obtained for the specific hot forging process of the present steel this equation is also considered to be applicable in the case of other hot forging process of metallic materials carried out under large strains, because the evolution of the friction coefficient is related to general phenomena occurring during forging process, such as the barreling of specimen and variation in effects of lubrication as mentioned above. It is considered thatmsas a
function of strain is closely related the contacting area from the side surface of sample with the anvil (Rc–Rt), because the
friction coefficient in this contacting area is extremely higher than the inner parts formed from the original top surface. Contacting area (ðRc2Rt2Þas a function of strain in the
same sample is shown in Fig. 7(b); in the stage I, the contacting area is nearly zero, while at stage II and III, an exponential relation was obtained similar to eq. (4), indicat-ing a closely relation betweenmswith this contacting area.
It is interesting to observe that the value ofmswas higher
than 1 at higher strain levels, if calculated with eq. (4), which contradicts previous results showing that the friction coef-ficient is constant and lower than 1 in compression processes from the Tresca’s law.9)From the simulation results,R
tdoes
not expand anymore when the strain level is higher than 1.4 at 1273 K. Here, the interface between the sample and anvil is thought to evolve to a static frictional state, where the friction coefficient should be evolved to 1 as indicated by a black line in stage III. Our previous result8)also indicated that the stress at lower strain levels fits with the Coulomb distribution very well (strain of 0.3); however, at high strain levels, a reverse Coulomb distribution was observed in FEM calculations,
(a) (b)
[image:4.595.89.512.77.243.2]probably due to sticking of the outer area of the top surface with the compression anvil (strain 0.65). Nevertheless, this theorem, regarding the static friction coefficient and the evolution from kinetic friction into static friction in hot forging process for large strain levels, can provide a new field of study to researchers in this field.
The shapes of the specimens at 1273 K during the hot forging process were simulated using DEFORM-3D v6.130 finite element analysis software. In order to verify the validity of ms, three types of friction coefficients were used in the
simulation processes: the average friction coefficient at a strain of approximately 1.43 with a value of about 0.65 mc
was used, because in general the friction coefficient of a deformed sample was calculated in this way.10)The average
friction coefficient measured at different strain levels as shown in Fig. 5; and the instantaneous friction coefficientms
calculated using eq. (4). ma measured at different strain
levels (Fig. 5) were fitted with a cubic spline function, and the values at other strain levels were extrapolated by using this function. The typical specimen profiles calculated by using the above three types of friction coefficients at strain levels of 0.3, 0.65 and, 1.5 are shown in Figs. 8–10,
respectively. No significant difference can be observed among the three simulation results judging from the observed simulated profiles of the specimens. In order to analyze the simulation results in further details,Rtis plotted in Fig. 11 as
a function of the strain level. The agreement between the calculated and measured results was better whenmswas used
than when the others coefficients (mcandma) were used; this
shows that the model simulated usingmsexpressed by eq. (4)
was appropriate for the current study.Rtcalculated usingmc
with a value of 0.65 had lower values while that calculated using ma in Fig. 5 had relatively higher values when
compared to the experimental results ofRt as shown by the
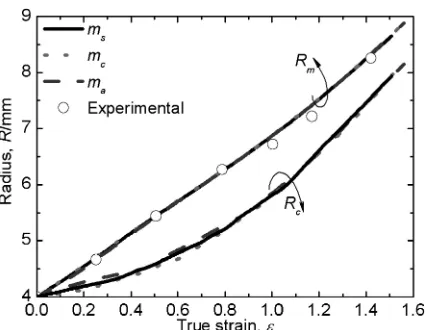
open circles in Fig. 11. Rc and Rm of specimen were also
calculated. The results are plotted in Fig. 12. BothRcandRm
of the specimen were observed to have nearly the same value in case of all the three types of friction coefficients, as mentioned above. The size of the actual specimen, expressed asRm, is also plotted in the same figure by open circles; the
experimental and calculated results showed good agreement in case of the three types of friction coefficients. From the above results, it can be observed that friction coefficients had only a minor effect on Rc and Rm implying that friction Rm
Rc
Rt
(a) (b) (c)
Fig. 8 The shape of sample at strain levels of (a) 0.3, (b) 0.65, and (c) 1.5 simulated in FEM calculations at 1273 K by using instantaneous friction coefficient,ms.
[image:5.595.74.258.69.239.2](a) (b) (c)
[image:5.595.335.515.75.233.2]Fig. 10 The shape of the specimen at strain levels of (a) 0.3, (b) 0.65, and (c) 1.5 simulated in FEM calculations at 1273 K by using average friction coefficient,maas a function of strain.
Fig. 11 The top radius Rt of the samples as a function of strain by simulations (solid line: instantaneous friction coefficient,ms; dotted line: the constant friction coefficient with a value of 0.65, mc; dashed line: average friction coefficient as a function of strain, ma) and the experimental results at 1273 K (open circles).
(a) (b) (c)
[image:5.595.319.532.287.448.2] [image:5.595.73.258.301.471.2]coefficient did not have a strong effect on the entire shape of the deformed specimen in the current study.
4. Conclusions
The evolution behavior ofmsat large strain levels during a
forging process was analyzed, and the simulation results of the geometrical change in the specimen, obtained by using FEM calculations, using three types of friction coefficients were compared in details, and the following observations were made:
(1) The friction coefficient was not constant during the large strain levels hot forging process, and according to the fitting results at higher strain level, an approx-imately exponential relationship was observed between themsand the strain.
(2) The variation in the sample shape calculated by using FEM calculations from themscorrelated well with the
corresponding experimental results, as compared to those obtained by using the other friction coefficients. (3) From the simulation results, it was found that the
friction coefficient did not have a strong effect on the shape of the sample; however, the radius of the top surface of the sample,Rt, changed due to friction.
Acknowledgements
The authors of this research would like to thank Yamanaka Eng. Co. Ltd., Japan for partly supporting this research. This research was supported by a Cooperation of Innovative Technology and Advanced Research in Evolutional Area from the Ministry of Education, Culture, Sports, Science and Technology of Japan.
REFERENCES
1) Z. Gao and R. V. Grandhi: Int. J. Machine Tools Manufact.40(2000) 691–710.
2) N. Frederiksen and T. Wanheim: J. Mech. Work. Technol.12(1985) 261–268.
3) N. Bay: J. Mech. Work. Technol.14(1987) 203–223.
4) N. Bay, J. Hunding, K. Kuzman and E. Pfeifer: Proc. Fifth Int. Conf. on Technology of Plasticity, Columbus, OH, USA, (1996) pp. 311–318. 5) R. Ebrahimi and A. Najafizadeh: J. Mater. Process. Technol. 152
(2004) 136–143.
6) R. Ebrahimi, A. Najafizadeh and R. Shateri: Proc. Steel Symp. 81, Iranian Institute for Iron and Steel, Isfahan, Iran, Mar. 2–3, (2003) pp. 230–237.
7) A. Bushhausen, K. Weinmann, J. Y. Lee and T. Altan: J. Mater. Process. Technol.33(1992) 95–108.
8) Y. P. Li, E. Onodera, H. Matsumoto and A. Chiba: Metall. Mater. Trans.40A(2009) 982–990.
9) G. E. Dieter: Mechanical Metallurgy, 3rd ed., (McGraw Hill Book Co., New York, NY, 1986) pp. 539–542.
10) H. Monajati, M. Jahazi, R. Bahrami and S. Yue: Mater. Sci. Eng. A373
(2004) 286–293.
Nomenclature
R: Theoretical radius of sample at a specific strain level
Rt: Top radius of the deformed specimen Rc: Contacting radius of the deformed specimen Rm: Maximum radius of the deformed specimen m: Average friction coefficient in a hot working process
ms: Instantaneous friction coefficient
ma: Average friction coefficient in the entire compression
process
mc: Average friction coefficient at different strain levels b: Barreling factor
h: Final height of the sample
h: The reduction in the height of the cylinder after compression
R: The difference between the maximum radiusRmand
[image:6.595.63.276.69.234.2]the radiusRtof top surface of the sample