Open Access
Methodology article
A high-throughput cell migration assay using scratch wound
healing, a comparison of image-based readout methods
Justin C Yarrow
1,2, Zachary E Perlman
1,2, Nicholas J Westwood
2,3and
Timothy J Mitchison*
1,2Address: 1Department of Systems Biology, Harvard Medical School, Boston, MA 02115, USA, 2The Institute of Chemistry and Cell Biology (ICCB), Harvard Medical School, Boston, MA 02115, USA and 3School of Chemistry and Centre for Biomolecular Sciences, University of St Andrews, North Haugh, St Andrews, UK
Email: Justin C Yarrow - [email protected]; Zachary E Perlman - [email protected]; Nicholas J Westwood - [email protected]; Timothy J Mitchison* - [email protected]
* Corresponding author
Abstract
Background: Cell migration is a complex phenomenon that requires the coordination of numerous cellular processes. Investigation of cell migration and its underlying biology is of interest to basic scientists and those in search of therapeutics. Current migration assays for screening small molecules, siRNAs, or other perturbations are difficult to perform in parallel at the scale required to screen large libraries.
Results: We have adapted the commonly used scratch wound healing assay of tissue-culture cell monolayers to a 384 well plate format. By mechanically scratching the cell substrate with a pin array, we are able to create characteristically sized wounds in all wells of a 384 well plate. Imaging of the healing wounds with an automated fluorescence microscope allows us to distinguish perturbations that affect cell migration, morphology, and division. Readout requires ~1 hr per plate but is high in information content i.e. high content. We compare readouts using different imaging technologies, automated microscopy, scanners and a fluorescence macroscope, and evaluate the trade-off between information content and data acquisition rate.
Conclusions: The adaptation of a wound healing assay to a 384 well format facilitates the study of aspects of cell migration, tissue reorganization, cell division, and other processes that underlie wound healing. This assay allows greater than 10,000 perturbations to be screened per day with a quantitative, high-content readout, and can also be used to characterize small numbers of perturbations in detail.
Background
When wounded or scratched, cell monolayers respond to the disruption of cell-cell contacts and an increased con-centration of growth factors at the wound margin by heal-ing the wound through a combination of proliferation and migration [1-3]; these processes reflect the behavior
of individual cells as well as the properties of the cell sheet as a surrogate tissue. To perform a wound healing assay, a wound is typically introduced in a cell monolayer using an object such as a pipette tip or syringe needle and the assay is performed on an individual coverslip or in a mul-tiwell plate. The monolayers recover and heal the wound
Published: 09 September 2004
BMC Biotechnology 2004, 4:21 doi:10.1186/1472-6750-4-21
Received: 06 May 2004 Accepted: 09 September 2004
This article is available from: http://www.biomedcentral.com/1472-6750/4/21
© 2004 Yarrow et al; licensee BioMed Central Ltd.
BMC Biotechnology 2004, 4:21 http://www.biomedcentral.com/1472-6750/4/21
in a process that can be observed over a timecourse of 3– 24 hrs. The wound heals in a stereotyped fashion – cells polarize toward the wound, initiate protrusion, migrate, and close the wound. Progression of these events can be monitored by manually imaging samples fixed at time-points or by time-lapse microscopy.
Wound healing assays are a classic and commonly used method for studying cell migration and the biology underlying it [4]. They have been used with multiple cell types and, as the monolayers heal the wound in a charac-teristic manner, they have been used to study cell polari-zation, matrix remodeling, cell migration, and numerous other processes [5-7]. Wound healing assays have been used both for detailed cell biological studies and for the discovery and validation of small molecule leads and other perturbations that affect cell migration [8-11]. The role of the Rho family GTPases, Rac, Rho, and Cdc42, in the establishment of polarity and the regulation of actin cytoskeletal structures has been studied using wound healing [12-14], as has the role of p53 in migration [15], and orientation of the microtubule organization center (MTOC) and the Golgi apparatus [16-18]. The assay has also been used as a proxy for angiogenesis, metastasis, and other physiological and pathophysiological processes [19-24].
In order to perform high throughput screening of cell migration, we developed a wound healing assay in a 384 well plate format that does not require expensive reagents, provides consistently shaped wounds, can provide detailed information on numerous processes involved in cell migration, and provides a quantitative, information-rich readout. We use multiple imaging technologies to assay the results and compare their relative merits.
Results
Adaptation of wound healing to a 384 well format
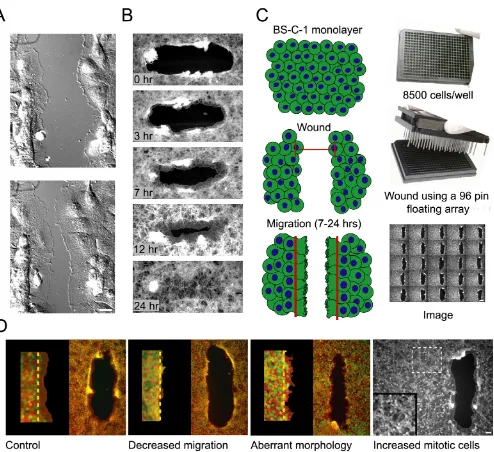
For the development of a high-throughput wound healing assay we chose to use BS-C-1 cells, a cell type with a classic wound healing response on glass coverslips [Figure 1A]. BS-C-1 cells were seeded in clear-bottom 384 well plates at high density and allowed to form monolayers over-night. We found that wound healing was observable between 3 and 24 hrs after wounding with a pipette tip or syringe needle. Significant cell migration could be seen at 3 hrs with lamella and protrusions at the wound margin. After 7 hrs, cell migration could be observed easily with a low magnification (4×) objective, and after 24 hrs wounds were completely healed [Figure 1B, Additional file: 1]. Because of the ease of distinguishing phenotypes at 7 and 24 hrs, we have used these timepoints for the assay.
To adapt this assay for parallel screening, we needed a method for introducing uniformly sized wounds in the
same position of each well. We used a 96 well floating-pin transfer device – a tool primarily used for the transfer of solutions between plates. A floating pin array, with foam padding placed between the top plate and the pins, pro-vides an adaptive stop to pin height and overcomes prob-lems with plate planarity. We have adapted a 24-channel aspirator in the same manner for small-scale work.
To wound all 384 wells in a plate, the 96 well pin array is placed in the corner of a well, pushed down to engage all pins with the surface of the plate, and then moved later-ally to produce the wound. This is then repeated in three neighboring wells to cover the plate and produce uniform wounds throughout [Figure 1C]. After the cells were wounded, we introduced perturbations to individual wells (in our case, small molecules). We then allowed the cells to recover for 7 hrs or 24 hrs before fixing, staining, and imaging each plate.
Comparison of imaging technologies
We used four different imaging technologies to analyze the results of this assay, each with distinct advantages and drawbacks [summarized in Table 1]. We will discuss these approaches in order of image resolution, from highest to lowest: automated fluorescence microscopy after 7 hrs recovery, fluorescence and transmitted-light scanners after 7 hrs, and a fluorescence macroscope after 24 hrs.
Automated microscopy
For highest resolution imaging of the assay we chose an end point of 7 hrs, when migration can be clearly seen, and used an automated fluorescence microscope to image individual wells after fixing and staining for filamentous actin and DNA [Figure 1D]. The microscope is a standard inverted fluorescence instrument. Augmented with an x-y stage, it moves between plate wells and a piezoelectric z-motor on the objective gives a focused image. Capturing images with a 4× objective provided sufficient resolution to determine the extent of migration and the morphology of the cells at the wound margin. From these data, we defined four distinct phenotypes [Figure 1D]. A control well shows polarization of the cells toward the wound and concerted migration of the cell sheet, with neighbor-ing cells connected and movneighbor-ing together into the wound. Wells showing decreased migration or aberrant morphol-ogy are readily apparent by visual inspection as are wells showing an increase in the number of mitotic cells, which manifest as bright spheres (in the actin channel) in an otherwise intact and adherent monolayer [Figure 1D]. Phenotypes that cause disruption of the monolayer, are considered toxic though we have not shown them to be.
at 4× magnification. At 10× magnification, ~1.5 hrs are required per plate because at higher magnification two images per well must be taken to ensure that the wound
[image:3.612.61.555.84.536.2]edge is captured. We found it more informative to observe the entirety of the wound at 4× rather than parts of it at 10×, despite the higher resolution in the latter case. Adaptation of a wound healing assay to a 384 well plate format
Figure 1
BMC Biotechnology 2004, 4:21 http://www.biomedcentral.com/1472-6750/4/21
Scanners
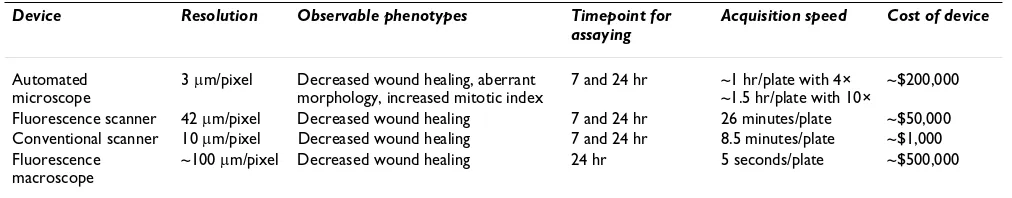
A fluorescence scanner can be used to determine the extent of cell migration at the 7 hr timepoint. By staining filamentous actin and using a fluorescence scanner with a 42 µm/pixel resolution setting, we can observe consistent differences between normal and inhibited migration. Control wells show a veil of less-densely stained, migrat-ing cells that extend into the wound with a concomitant decrease in wound width [Figure 2A]. Titration of a com-pound that blocks cell migration (the actin inhibitor cyto-chalasin D) shows complete inhibition of migration at 1
µM, as seen by a sharply delineated wound edge and a wider wound width [Figure 2A].
A simple transmitted-light scanner, normally used for scanning documents and costing less than $1,200, can also be used to monitor wound healing at 7 hrs and only requires that cells are stained with a dye. Figure 2B shows images of wells stained with Coomassie Brilliant Blue. Wells treated with cytochalasin D show inhibition of wound healing similar to that observed with the fluores-cence scanner. Inhibited wells stain darkly at the wound margin while normal migration can be seen by a more dif-fuse wound margin, denoting migrating cells [Figure 2B].
In both cases, scanners do not provide specific informa-tion on cell morphology or other subtle effects in the 7 hr assay; however, acquisition time is greatly decreased. For the fluorescence scanner, acquisition time is 26 minutes at the resolution and image quality shown (42 µm/pixel and medium quality). For the conventional scanner, acquisi-tion time is 8.5 minutes (at 10 µm/pixel, 2400 dpi) and cell staining with Coomassie Brilliant Blue takes only 10 minutes.
Macroscope – Tundra or LeadSeeker
The lowest resolution imaging technology that we tested, a fluorescence macroscope had a resolution of ~100 µm/ pixel. Detecting wound healing at this resolution required an incubation time of 24 hours after wounding as differ-ences are not readily seen with this method at the 7 hr timepoint. Cells are wounded and allowed to recover for 24 hours before fixing, staining for filamentous actin, and imaging. The macroscope captures an image of the entire
plate. At this magnification and resolution, an unhealed wound is seen as a non-staining, black streak within the monolayer [Figure 3]. In contrast, wounds that have healed completely are seen as lower-intensity, grey streaks.
The time required for acquisition of images using this technique, is limited only by the fluorescence signal and was typically ~5 seconds per plate.
Automated image analysis of wound healing images
[image:4.612.52.558.100.199.2]With all of the imaging techniques discussed here, we ini-tially scored the assay by visual inspection. Visual inspec-tion is fast, informainspec-tion-rich, and can distinguish subtle effects. This method proved useful during adaptation and optimization of the assay in high-throughput format. However, screening large numbers of perturbations by vis-ual inspection is limited by subjectivity, operator fatigue, and the lack of quantifiable metrics. Thus, we developed an automated image analysis routine to provide a rapid and quantitative measurement of the wound healing assay with images captured using the automated micro-scope (automated methods for the other readouts could also be developed). Using images captured by automated microscopy with a 4× objective, we are able delineate measurable characteristics of the wound. After 7 hrs recov-ery, actin staining defines the extent of healing as well as the morphology of the cells and, because of cell polariza-tion, DNA staining defines the approximate starting point of the migrating cells [Figure 4A]. Applying a standard set of image processing filters to threshold the image, we defined the area of the wound not staining for nuclei and the area not staining for actin. The difference between these two areas defines an annulus containing the lamella of the cells at the wound front (hereafter, lamellar region) [Figure 4A]. With the lamellar region defined, we can extract several metrics that characterize migration. Meas-urements that have been useful in quantifying the pheno-types of migration inhibition and aberrant morphology include: area of lamellar region, width of lamellar region, and the smoothness of the wound margin.
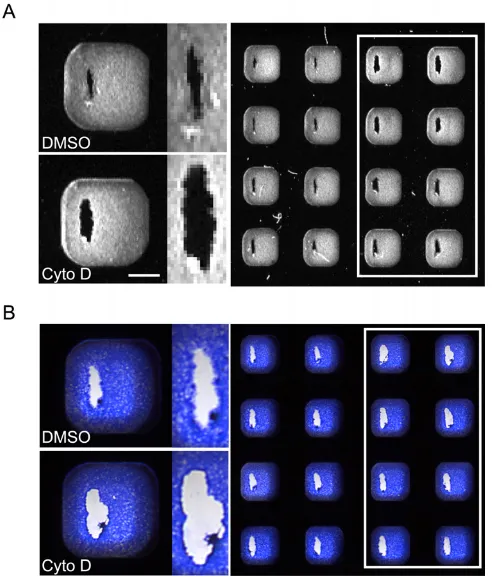
Automated analysis and visual inspection are comple-mentary approaches. To illustrate this, we compare the Table 1: Comparison of four imaging methods to readout the wound healing assay
Device Resolution Observable phenotypes Timepoint for assaying
Acquisition speed Cost of device
Automated microscope
3 µm/pixel Decreased wound healing, aberrant morphology, increased mitotic index
7 and 24 hr ~1 hr/plate with 4× ~1.5 hr/plate with 10×
~$200,000
Fluorescence scanner 42 µm/pixel Decreased wound healing 7 and 24 hr 26 minutes/plate ~$50,000 Conventional scanner 10 µm/pixel Decreased wound healing 7 and 24 hr 8.5 minutes/plate ~$1,000 Fluorescence
macroscope
two approaches using the results from one 384 well plate of a screen for small molecules that affect wound healing [Figure 4B]. The automated analysis values for each well are plotted and the average lamellar width from control wells is marked as a black line, with three standard devia-tions above and below that average marked as red dashed lines. Visual inspection of this same plate is illustrated on the graph by color-coding each well. Wells where migra-tion is inhibited or morphology affected are shown in green; compounds that affect the well in other ways – wells with fewer cells, increased mitotic index, or dis-rupted monolayers – are shown in red; and compounds that show no significant deviation from control are shown in blue. As can be seen, the automated analysis picks up 4 wells that show inhibition of wound healing with lamel-lar widths more than 3 standard deviations from the mean
and with less stringent bounds (2 standard deviations) 7 compounds are found to inhibit. Other compounds iden-tified by visual inspection were not picked up by auto-mated analysis.
Validation of wound healing as a high-throughput assay
We have used methods described in this paper (notably, automated microscopy) to screen ~1,000 bioactive and ~20,000 random drug-like compounds. We were able to reproducibly identify compounds that affected wound healing with different effects including: inhibiting migra-tion, affecting morphology, blocking completion of mito-sis, and disrupting the cell monolayer. The details of these results will be presented elsewhere.
Discussion
We present a cell migration assay in a 384 well plate for-mat through the adaptation of tissue culture cell wound healing. We have also compared the readouts provided by four distinct imaging techniques technologies – auto-mated microscopy, fluorescence and transmitted-light scanners, and a fluorescence macroscope – for their rela-tive acquisition speed, image resolution, and information content.
High-content image-based screening is often performed at high magnification, however, we have found that low magnification images are information-rich and can be suf-ficient for observation of detailed phenomena. New screens utilizing imaging technologies are often explicitly The use of scanners to assay wound healing after 7 hrs
recovery
Figure 2
The use of scanners to assay wound healing after 7 hrs recovery. (A) An image of actin-stained wells obtained using a fluorescence scanner. Normal healing wounds (left two columns) can be distinguished from wells treated with a titration of the actin cytoskeleton disrupter cytochalasin D (white box) by the width of the wound and staining at the wound margin. (B) An image of Coomassie-stained wells obtained using a transmitted-light scanner. Normal healing wounds have a more diffuse wound margin, denoting cell migration into the wound, than wells treated with cytochala-sin D (white box). Bar 1 mm.
The use of a fluorescence macroscope to assay wound heal-ing after 24 hrs recovery
Figure 3
BMC Biotechnology 2004, 4:21 http://www.biomedcentral.com/1472-6750/4/21
developed to image plates at the highest resolution possi-ble given time constraints (10× or higher), rather than at the lowest resolution required to discern differences between wells by visual inspection or automated analysis. Increased magnification further requires acquisition of a greater number of images in order to guard against sam-pling error. The more sophisticated imaging technologies also carry a hefty price tag. We show here that images taken at magnifications of 4× and lower still allow us to easily discern wells in which wound healing is inhibited and morphology affected. Low magnification imaging is an underutilized method and may be particularly effective for screens that monitor gross changes in protein localiza-tion such as nuclear transport, or protein transport from Golgi to plasma membrane; processes in which changes in localization might manifest as changes in the image texture of the stained cell monolayer.
While the choice of imaging technologies represents a tradeoff between resolution and information, we think that they should be used together rather than suggesting that they are mutually exclusive. One can iteratively image a given assay plate and take advantage of the best aspects of each technique. For example, a screen for inhibitors of cell migration could initially be performed using a lower
resolution technique, taking advantage of the speed to identify interesting wells before imaging just those wells at higher resolution. Related to this, one can re-stain assay plates with different molecular markers. Plates initially screened with a marker that most easily defines the phenotype of interest can be subsequently re-stained with markers that provide different information. In this way, one can consider an assay plate a resource to which one can return to ask new questions.
Similar to the tradeoffs seen with different imaging tech-nologies, different image processing techniques like automated image analysis and visual inspection have their distinct advantages but also provide complementary approaches. Our scheme for automated analysis of wound healing allows us to rapidly and easily identify wells in which wound healing is significantly inhibited or mor-phology clearly affected. However, the automated analysis missed a number of interesting wells that were identified by visual inspection. In part this is because the analysis is based on only a few measures – lamellar width, area, and smoothness. Any automated analysis based on measura-ble parameters will be limited to phenotypes that mani-fest along those parameters and might miss more subtle or complex phenotypes that "jump off the screen" when Automated analysis of wound healing images
Figure 4
viewed by eye. Automated analysis can also be con-founded by artifacts within the plate, dust particles, pre-cipitates, or fluorescent small molecules. Instead of being thought of as a complete answer, automated analysis can enrich for wells that differ from the norm. We don't address automated analysis with the other imaging tech-niques, but from what can be seen by eye, automated approaches that measure the intensity of staining at the wound edge, or the steepness to which the intensity at the wound edge drops off should provide a good measure of wound healing at very low magnification and resolution.
As with any complex phenotypic assay, cell migration dur-ing wound healdur-ing can be inhibited by effects on global cellular processes – e.g. inhibition of protein translation, disruption of metabolism, disruption of ion homeostasis, etc. – and validation of the specificity of new perturba-tions is required. Even if the molecular target of the per-turbation is unknown, this assay can be adapted or used to distinguish compounds that specifically inhibit or potentiate cell migration. For example, partial inhibition of migration with low concentrations of cytochalasin D could create a sensitized screen for cell migration and used to find suppressors or enhancers. Other complementary approaches include comparative screens across multiple cell lines that migrate differently and the use of specific trophic factors and cognate cell lines such as VEGF and endothelial cells. In our studies, we used still another approach: a series of counter screens that eliminated from our pool of hits, toxic compounds and compounds that do not inhibit processes of interest (Yarrow et. al. unpub-lished results). This approach has worked well and results will be reported elsewhere.
Conclusions
The adaptation of a wound healing assay to a 384 well for-mat facilitates the study of aspects of cell migration, tissue reorganization, cell division, and other processes that underlie wound healing. This assay allows greater than 10,000 perturbations to be screened per day with a quan-titative, information-rich readout, and can also be used to characterize small numbers of perturbations in detail.
Methods
Tissue culture and 384 plate preparation
BS-C-1 (ATCC CCL-26) cells were grown in DMEM, 10% FCS, and antibiotics. Cells were plated in black 384 well plates with clear bottoms (Corning Costar 3712) at a den-sity of 8500 cells/well in a volume of 50 µl using a liquid dispenser (Labsystems Multidrop). Plates were spun briefly at 500 rpm for ~30 s to in a tabletop centrifuge (Sorval RT7 plus). Cells were incubated overnight (37°C 5% CO2) and wounding was preformed 12 hours later.
Wound healing assay, cell fixation, and staining
Wound healing was performed using a 96 well floating-pin transfer device with a floating-pin diameter of 1.58 mm coming to a flat point at the tip with a diameter of 0.4 mm (VP Scientific VP-408FH). Foam backing was inserted between the plates of the pin array to provide a resistive stop and the external guide pins were bent to allow greater movement in the z-axis. The pin array was placed in the top corner of a well, pushed down into the plate to engage all pins, and then pulled toward the user. This was repeated in the three neighboring wells to cover all 384. Plates were returned to the tissue culture incubator for 7 or 24 hours before fixation.
Cells were fixed after removal of the media with a wand aspirator (VP scientific VP-186L) used along with the Lab-systems Multidrop for all liquid handling. Fixation solu-tion (100 mM K-Pipes pH 6.8, 10 mM EGTA, 1 mM MgCl2, 0.2% Triton X-100, 3.7% Formaldehyde) was added as 30 µl and incubated for 15 min. Wells were aspi-rated and washed 2× with TBS with 0.1% Triton-X 100 (TBS-Tx) and stained.
For experiments involving the automated microscope and macroscope, cells were stained in TBS-Tx with TRITC-phalloidin (Sigma P1591) 0.5 µg/ml and Hoechst (Sigma B2261) 0.1 µg/ml as 15 µl per well for 15 minutes. Wells were washed 2× with TBS-Tx and imaged. For experiments using the fluorescence plate scanner, after fixation, cells were incubated in TBS-Tx with 2% BSA (AbDil) for 30 minutes, incubated with mouse anti-actin antibody (Chemicon MAB1501) at 1:10,000 in AbDil for 45 min-utes, washed 2× with TBS-Tx, incubated with secondary antibodies appropriate for the plate scanner (Molecular Probes A-21057), washed 2× with TBS-Tx and imaged. For experiments using the transmitted-light scanner, after fix-ation, cells were incubated with SDS-Page gel staining solution (0.25% Coomassie Brilliant Blue R-250, 50% methanol, 10% acetic acid) for 10 minutes, washed 2× with TBS and imaged.
Imaging
Automated microscopy
BMC Biotechnology 2004, 4:21 http://www.biomedcentral.com/1472-6750/4/21
image at 4× and ~1.5 hrs at 10×. Individual black and white actin images (.tif) were compiled as a .stk file and scrolled through using keystrokes to visually annotate. Visual inspection of 1 plate of images (384) took 10 minutes.
Transmitted light scanner
An Epson 1680 scanner was used with the positive film setting. A scanning resolution of 1200 dpi (equivalent to 20 µm/pixel) gave an acceptable image with a read time for one plate of 3.5 minute. The image shown in Figure 2 was 2400 dpi (10 µm/pixel) and read time was 8.5 min-utes. We also found that using the document scanning mode (with no transmitted light attachment) worked well. In this case, a lamp with a paper diffuser (placed on top of the plate) was used for even illumination.
Fluorescence scanner
An Odyssey scanner (LiCor) was tested at all combina-tions of scanning resolution and image quality. Scanning at a resolution setting of 42 um with medium image qual-ity was found to be the optimal balance between speed and image quality. The scanner was used as per the man-ual, with no modifications.
Fluorescence macroscope
A Tundra macroscope, (Imaging Research – now available as the Leadseeker from Amersham [25]) a 12 cm telecen-tric lens with a N/A of 0.45, mounted with a -50°C cooled, thinned, back illuminated CCD camera for image capture, and a motorized stage to hold the plates – all enclosed in a light-tight box. The software was used as per the manual. To image the underside of plates, they were sealed (Corning Costar 6570) while containing TBS and inverted. Exposure times were ~5 seconds.
Automated image analysis
Wound healing images were analyzed using software writ-ten using Visual Basic 6.0 (Microsoft) and Halcon 6.0.1 (MVTec Software) but could be implemented with most basic image analysis software. This software iterates the analysis over images specified by the Metamorph .HTS file and returns values to an Excel spreadsheet.
Non-DNA staining region (Additional file: 2A)
Hoechst images are convolved with a Laplacian-of-a-Gaussian (σ = 2 pixels) kernel. The resulting image is thresholded for pixels of value 0 and binarized. After a binary morphological opening (an erosion followed by a dilation) with a disc of radius 2.5 pixels, the largest con-tiguous region that does not touch the image edge is defined, and holes within this region are filled.
Non-actin staining region (Additional file: 2B)
A Kirsch edge detection filter is applied to actin images and the resulting image is thresholded at a manually set value (changed when needed to account for variation in staining intensity). The largest contiguous region that does not touch the image edge is defined and holes within this binary region are filled.
Definition of measures (in pixels)
lamellar area: area of annulus defined by the difference between the non-actin staining area and the non-DNA staining area; lamellar width: (lamellar area)/(perimeter length of the non-DNA staining region); lamellar smooth-ness (Additional file: 2C): (Perimeter of the non-actin staining region)/(perimeter of the morphological closing (dilation followed by erosion) of the non-actin staining region with a disc of radius 10 pixels).
Authors' contributions
JCY developed the assay and analysis. ZEP wrote the soft-ware for automated analysis. NJW initiated a project for in vivo actin cytoskeleton small molecule inhibitors. TJM provided support and enthusiasm for the project.
Additional material
Additional file 1
Wounds generated with the 96 well floating-pin array heal in a char-acteristic and measurable manner
Wounds generated with the 96 well floating-pin array heal in a char-acteristic and measurable manner. (A) Wounds generated with the 96 well floating-pin array healed for 0, 3, 7, 12, or 24 hours, were processed as above, and wound regions were measured using automated analysis. Normalized average values and standard deviations of both the area and median width of the non-actin staining region and the non-DNA staining region (see Methods for definitions) are shown. The non-DNA staining region at the 24 hr timepoint was automatically not measured (asterisks) because the non-actin staining region was 0. At least 24 wells of each con-dition were measured.
Click here for file
[http://www.biomedcentral.com/content/supplementary/1472-6750-4-21-S1.tiff]
Additional file 2
Sample images illustrating automated analysis of wound healing images
Sample images illustrating automated analysis of wound healing images. (A) Processing of DAPI image to generate non-DNA staining region. (B) Processing of actin image to generate non-actin staining image. (C) Comparison of lamellar wound region with its morphological closing allows assessment of lamellar smoothness.
Click here for file
Publish with BioMed Central and every scientist can read your work free of charge "BioMed Central will be the most significant development for disseminating the results of biomedical researc h in our lifetime."
Sir Paul Nurse, Cancer Research UK
Your research papers will be:
available free of charge to the entire biomedical community
peer reviewed and published immediately upon acceptance
cited in PubMed and archived on PubMed Central
yours — you keep the copyright
Submit your manuscript here:
http://www.biomedcentral.com/info/publishing_adv.asp
BioMedcentral
Acknowledgements
We'd like to thank Yan Feng for his contribution in setting up the auto-mated microscopy rig; Rebecca Ward for her support of the project; Jim Horne for his masterful machining skills; Steve Miller, Thomas Mayer, Maria Wigger, Scott Lokey, and Jeff Peterson for common cause; and Mimi Shirasu-Hiza for help with the manuscript and great discussions. JCY and ZEP were supported by Howard Hughes Medical Institute pre-doctoral fel-lowships. Funding provided to TJM through NIH GM048027-12.
References
1. Wong MK, Gotlieb AI: The reorganization of microfilaments, centrosomes, and microtubules during in vitro small wound reendothelialization.J Cell Biol 1988, 107:1777-1783.
2. Coomber BL, Gotlieb AI: In vitro endothelial wound repair. Interaction of cell migration and proliferation.Arteriosclerosis
1990, 10:215-222.
3. Zahm JM, Kaplan H, Herard AL, Doriot F, Pierrot D, Somelette P, Puchelle E: Cell migration and proliferation during the in vitro wound repair of the respiratory epithelium. Cell Motil Cytoskeleton 1997, 37:33-43.
4. Lampugnani MG: Cell migration into a wounded area in vitro.
Methods Mol Biol 1999, 96:177-182.
5. Lu KV, Jong KA, Rajasekaran AK, Cloughesy TF, Mischel PS: Upreg-ulation of tissue inhibitor of metalloproteinases (TIMP)-2 promotes matrix metalloproteinase (MMP)-2 activation and cell invasion in a human glioblastoma cell line.Lab Invest 2004,
84:8-20.
6. Herren B, Garton KJ, Coats S, Bowen-Pope DF, Ross R, Raines EW:
ADAM15 overexpression in NIH3T3 cells enhances cell-cell interactions.Exp Cell Res 2001, 271:152-160.
7. Huang C, Rajfur Z, Borchers C, Schaller MD, Jacobson K: JNK phos-phorylates paxillin and regulates cell migration.Nature 2003,
424:219-223.
8. Mc Henry KT, Ankala SV, Ghosh AK, Fenteany G: A non-antibac-terial oxazolidinone derivative that inhibits epithelial cell sheet migration.Chembiochem 2002, 3:1105-1111.
9. Vogt A, Pestell KE, Day BW, Lazo JS, Wipf P: The antisignaling agent SC-alpha alpha delta 9, 4-(benzyl-([(2,5-dipheny-loxazole-4-carbonyl)amino]ethyl)carbamoyl)- 2-decanoylaminobutyric acid, is a structurally unique phos-pholipid analogue with phospholipase C inhibitory activity.
Mol Cancer Ther 2002, 1:885-892.
10. Klein-Soyer C, Cazenave JP, Herbert JM, Maffrand JP: SR 25989 inhibits healing of a mechanical wound of confluent human saphenous vein endothelial cells which is modulated by standard heparin and growth factors. J Cell Physiol 1994,
160:316-322.
11. Fischer EG, Stingl A, Kirkpatrick CJ: Migration assay for endothe-lial cells in multiwells. Application to studies on the effect of opioids.J Immunol Methods 1990, 128:235-239.
12. Nobes CD, Hall A: Rho GTPases control polarity, protrusion, and adhesion during cell movement. J Cell Biol 1999,
144:1235-1244.
13. Etienne-Manneville S, Hall A: Integrin-mediated activation of Cdc42 controls cell polarity in migrating astrocytes through PKCzeta.Cell 2001, 106:489-498.
14. Fenteany G, Janmey PA, Stossel TP: Signaling pathways and cell mechanics involved in wound closure by epithelial cell sheets.Curr Biol 2000, 10:831-838.
15. Sablina AA, Chumakov PM, Kopnin BP: Tumor suppressor p53 and its homologue p73alpha affect cell migration.J Biol Chem
2003, 278:27362-27371.
16. Yvon AM, Walker JW, Danowski B, Fagerstrom C, Khodjakov A, Wadsworth P: Centrosome reorientation in wound-edge cells is cell type specific.Mol Biol Cell 2002, 13:1871-1880.
17. Magdalena J, Millard TH, Machesky LM: Microtubule involvement in NIH 3T3 Golgi and MTOC polarity establishment.J Cell Sci
2003, 116:743-756.
18. Magdalena J, Millard TH, Etienne-Manneville S, Launay S, Warwick HK, Machesky LM: Involvement of the Arp2/3 complex and Scar2 in Golgi polarity in scratch wound models.Mol Biol Cell
2003, 14:670-684.
19. Philp D, Huff T, Gho YS, Hannappel E, Kleinman HK: The actin binding site on thymosin beta4 promotes angiogenesis.Faseb J 2003, 17:2103-2105.
20. Moon EJ, Lee YM, Lee OH, Lee MJ, Lee SK, Chung MH, Park YI, Sung CK, Choi JS, Kim KW: A novel angiogenic factor derived from Aloe vera gel: beta-sitosterol, a plant sterol.Angiogenesis 1999,
3:117-123.
21. Ma PC, Kijima T, Maulik G, Fox EA, Sattler M, Griffin JD, Johnson BE, Salgia R: c-MET mutational analysis in small cell lung cancer: novel juxtamembrane domain mutations regulating cytoskeletal functions.Cancer Res 2003, 63:6272-6281.
22. Chung RS, Adlard PA, Dittmann J, Vickers JC, Chuah MI, West AK:
Neuron-glia communication: metallothionein expression is specifically up-regulated by astrocytes in response to neuro-nal injury.J Neurochem 2004, 88:454-461.
23. Morgan LW, Wieslander A, Davies M, Horiuchi T, Ohta Y, Beavis MJ, Craig KJ, Williams JD, Topley N: Glucose degradation products (GDP) retard remesothelialization independently of D-glu-cose concentration.Kidney Int 2003, 64:1854-1866.
24. Saga Y, Mizukami H, Takei Y, Ozawa K, Suzuki M: Suppression of cell migration in ovarian cancer cells mediated by PTEN overexpression.Int J Oncol 2003, 23:1109-1113.
25. Ramm P: Imaging systems in assay screening.Drug Discov Today