CONNECTION BETWEEN DYNAMICALLY DERIVED IMF NORMALISATION AND STELLAR POPULATION PARAMETERS
RICHARDM. MCDERMID1,2,*, MICHELECAPPELLARI3, KATHERINEALATALO4, ESTELLEBAYET3, LEOBLITZ5, MAXIMEBOIS7, FRED´ ERIC´ BOURNAUD6, MARTINBUREAU3, ALISONF. CROCKER8, ROGERL. DAVIES3, TIMOTHYA. DAVIS9, P. T.DEZEEUW9,10,
PIERRE-ALAINDUC6, ERICEMSELLEM9,11, SADEGHKHOCHFAR12, DAVORKRAJNOVIC´13, HARALDKUNTSCHNER9, RAFFAELLAMORGANTI14,15, THORSTENNAAB16, TOMOOSTERLOO14,15, MARCSARZI17, NICHOLASSCOTT18, PAOLOSERRA14,19,
ANNE-MARIEWEIJMANS20ANDLISAM. YOUNG21,22
1Department of Physics and Astronomy, Macquarie University, Sydney NSW 2109, Australia 2Australian Gemini Office, Australian Astronomical Observatory, PO Box 915, Sydney NSW 1670, Australia
3Sub-Department of Astrophysics, Department of Physics, University of Oxford, Denys Wilkinson Building, Keble Road, Oxford, OX1 3RH, UK 4Infrared Processing and Analysis Center, California Institute of Technology, Pasadena, California 91125, USA
5Department of Astronomy, Campbell Hall, University of California, Berkeley, CA 94720, USA
6Laboratoire AIM Paris-Saclay, CEA/IRFU/SAp – CNRS – Universit´e Paris Diderot, 91191 Gif-sur-Yvette Cedex, France 7Observatoire de Paris, LERMA and CNRS, 61 Av. de l‘Observatoire, F-75014 Paris, France
8Ritter Astrophysical Observatory, University of Toledo, Toledo, OH 43606, USA 9European Southern Observatory, Karl-Schwarzschild-Str. 2, 85748 Garching, Germany 10Sterrewacht Leiden, Leiden University, Postbus 9513, 2300 RA Leiden, the Netherlands
11Universit´e Lyon 1, Observatoire de Lyon, Centre de Recherche Astrophysique de Lyon and Ecole Normale Sup´erieure de Lyon, 9 avenue Charles Andr´e, F-69230 Saint-Genis Laval, France
12Institute for Astronomy, University of Edinburgh, Royal Observatory, Edinburgh, EH9 3HJ, UK 13Leibniz-Institut f¨ur Astrophysik Potsdam (AIP), An der Sternwarte 16, D-14482 Potsdam, Germany 14Netherlands Institute for Radio Astronomy (ASTRON), Postbus 2, 7990 AA Dwingeloo, The Netherlands 15Kapteyn Astronomical Institute, University of Groningen, Postbus 800, 9700 AV Groningen, The Netherlands
16Max-Planck-Institut f¨ur Astrophysik, Karl-Schwarzschild-Str. 1, 85741 Garching, Germany 17Centre for Astrophysics Research, University of Hertfordshire, Hatfield, Herts AL1 9AB, UK 18Sydney Institute for Astronomy (SIfA), School of Physics, The University of Sydney, NSW 2006, Australia
19CSIRO Astronomy & Space Science, PO Box 76, Epping, NSW 1710, Australia
20School of Physics and Astronomy, University of St Andrews, North Haugh, St Andrews KY16 9SS, UK 21Physics Department, New Mexico Institute of Mining and Technology, Socorro, NM 87801, USA 22Academia Sinica Institute of Astronomy & Astrophysics, PO Box 23-141, Taipei 10617, Taiwan, R.O.C.
Received 2014 June 11th; accepted 2014 August 13th
ABSTRACT
We report on empirical trends between the dynamically determined stellar initial mass function (IMF) and stellar population properties for a complete, volume-limited sample of 260 early-type galaxies from the ATLAS3D project. We study trends between our dynamically-derived IMF normalisation αdyn ≡
(M/L)stars/(M/L)Salpand absorption line strengths, and interpret these via single stellar population- (SSP-) equivalent ages, abundance ratios (measured as [α/Fe]), and total metallicity, [Z/H]. We find that old and alpha-enhanced galaxies tend to haveon averageheavier (Salpeter-like) mass normalisation of the IMF, but stellar population does not appear to be a good predictor of the IMF, with a large range ofαdynat a given population parameter. As a result, we find weakαdyn-[α/Fe] andαdyn−Age correlations and no significantαdyn−[Z/H] correlation. The observed trends appear significantly weaker than those reported in studies that measure the IMF normalisation via the low-mass star demographics inferred through stellar spectral analysis.
Subject headings: galaxies: abundances - galaxies: elliptical and lenticular, cD - galaxies: kinematics and dynamics - galaxies: stellar content
1. INTRODUCTION
The stellar initial mass function (IMF) of massive galaxies has been the focus of much attention recently, triggered by findings that suggest a non-universal and systematically vary-ing form of the IMF among galaxies in the current day uni-verse (van Dokkum & Conroy 2010; Cappellari et al. 2012). These findings differ from studies of resolved stellar systems in and near the Milky Way, which indicate that the IMF has a universal form (Kroupa 2002; Bastian et al. 2010). Strong evidence for a non-universal IMF has come from the appli-cation of various independent techniques, including gravita-tional lensing (Auger et al. 2010), stellar dynamical modelling
*Email: [email protected]
(Cappellari et al. 2012, 2013b; Tortora et al. 2013; Conroy et al. 2013), and spectral synthesis (van Dokkum & Conroy 2010, 2011; Spiniello et al. 2012; La Barbera et al. 2013; Fer-reras et al. 2013; Spiniello et al. 2014). With few exceptions (e.g. Smith et al. 2012; Smith & Lucey 2013; Peacock et al. 2014), such studies so far agree that, in general, galaxies with higher velocity dispersion require a ‘heavy’ form of the IMF in order to account fully for the measured total mass-to-light ratio. While this general picture is one of qualitative agree-ment, there is ongoing debate as to what key parameters drive the IMF variations. In particular, Smith (2014) find a notable discrepancy between methods on a galaxy-by-galaxy basis, and conclude that the dynamically-derived IMF normalisation for 34 objects in Atlas3D does not correlate with [Mg/Fe] af-ter controlling for velocity dispersion.
In this Letter, we report on how the stellar population prop-erties of the complete ATLAS3D sample are related to the dynamically-derived IMF normalisation. This expands the sample of 34 objects of Smith (2014) to a total of 212 galaxies, studying age, metallicity and [α/Fe], and spanning a signifi-cantly larger range of stellar population parameter values.
2. OBSERVATIONS AND DERIVED QUANTITIES
All observations come from the ATLAS3D Survey (Cap-pellari et al. 2011), and comprise optical integral-field spec-troscopy covering half the stellar light, on average (i.e. one effective radius,Re). The spectral data cubes were spatially integrated to form an effective aperture corresponding to a ra-dius of one eighth of an effective rara-dius,Re/8. Such an aper-ture is similar to those used in other (generally long-slit or single-fibre spectrograph) studies in the literature, and allows our results to be more directly compared to them. The sin-gle stellar population (SSP) models of Schiavon (2007) were used to measure the SSP-equivalent age, metallicity [Z/H], and alpha-element abundance [α/Fe] (with IMF fixed to that of a unimodal power law of the form: ζ(m) ∝ m−2.35, Salpeter 1955) using the chi-squared approach detailed in Mc-Dermid et al. (2006), finding the model from an interpolated grid which simultaneously best approximates our measured Hβ, Fe5015 and Mgb line indices on the Lick/IDS system (Worthey & Ottaviani 1997). A full presentation of the stellar populations for the ATLAS3DSurvey is given in McDermid et al. (in prep.).
Stellar kinematics were measured from our integral-field spectroscopy using the pixel fitting code pPXF (Cappellari & Emsellem 2004), and the resulting maps of stellar line-of-sight mean velocity and velocity dispersion were fitted using general anisotropic Jeans models (Cappellari 2008), in con-junction with multi-Gaussian mass models (Emsellem et al. 1994; Cappellari 2002) from SDSS imaging, which are re-ported in Scott et al. (2013). The stellar mass-to-light ratios (M/L)starswe use here were derived accounting for a stan-dard dark matter halo (Navarro et al. 1996), and correspond to models ‘B’ as described in detail in Cappellari et al. (2013a).
The same integral-field spectroscopy was used to mea-sure the spectroscopic stellar mass-to-light ratio (assuming a Salpeter IMF),(M/L)Salp. These were measured indepen-dently from the SSP parameters (which also assume a Salpeter IMF), using a regularised pPXF spectral fit of the MIUSCAT stellar population models from Vazdekis et al. (2012) as tem-plates. To be consistent with the stellar kinematics used in the dynamical modelling, the spectra within an aperture ex-tending to one effective radius were summed and used in the spectral fit. In all, 264 templates were simultaneously fitted to this aperture spectrum, giving the weighted mean mass-to-light ratio for each galaxy taking into account a smooth, non-parametric star-formation history. The resulting r-band (M/L)stars and (M/L)Salp values are given in Table 1 of Cappellari et al. (2013b).
Using the same nomenclature as Cappellari et al. (2013b), we quantify the mass normalisation of the IMF using the IMF parameterαdyn≡(M/L)stars/(M/L)Salp, such thatαdyn>
1implies an IMF ‘heavier’ than Salpeter. For the results that follow, we apply the same sample selection as that paper1, excluding objects with Hβ >2.3A within an effective radius,˚ on the basis that they exhibit very strong age gradients, thus
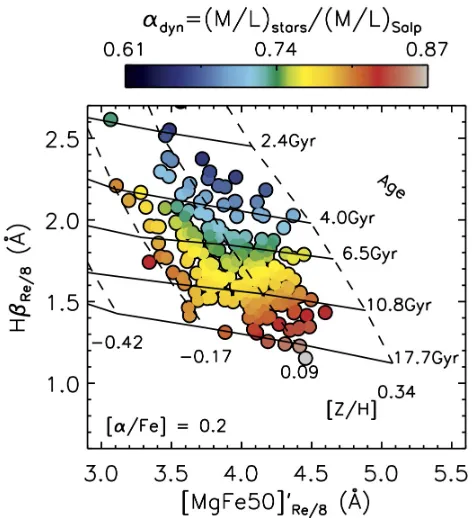
[image:2.612.321.557.64.323.2]1This selection is tabulated in column (6) of the online version of Table 1 in Cappellari et al. (2013b).
Figure 1. Lick indices Hβversus the combined index[MgFe50]0, both
mea-sured within an aperture of one eighth of an effective radius. The colour scale indicates the value of the IMF parameter,αdyn, defined as the ratio of the mass-to-light ratios derived from dynamical modelling (accounting for dark matter) and stellar population modelling. The measured values of the IMF parameter have been adaptively smoothed using a locally-weighted re-gression technique to show underlying trends in the distribution. Note that the range of values resulting from this averaging technique is necessarily re-duced. A grid of SSP model predictions from Schiavon (2007) is shown for a super-solar abundance ratio of [α/Fe]= 0.2as indicated in the lower left of the plot. Solid lines indicate lines of constant age; dashed lines constant metallicity, as shown.
breaking the constant mass-to-light ratio assumption of the dynamical modelling approach, and making (M/L)Salp ill-defined. In addition, we exclude the object PGC071531, as the kinematic data were of too poor quality to allow a secure measure ofαdyn. The following analysis uses the remaining 212 galaxies satisfying these criteria.
3. RESULTS 3.1. IMF and line-strengths
We begin by showing the link between the IMF mass nor-malisation (viaαdyn) to simple empirical quantities to make our results independent of stellar population models. Fig. 1 presents the distribution of the IMF parameter plotted in the two-dimensional plane of line strength indices Hβ and [MgFe50]02. The former index is sensitive to stellar age; the latter to metallicity in a way that is not strongly dependent on [α/Fe] (Kuntschner et al. 2010). The values of the IMF parameter in this plane have been adaptively smoothed us-ing the two-dimensional Locally Weighted Regression robust technique (dubbed LOESS) of Cleveland & Devlin (1988), as implemented in Cappellari et al. (2013b)3. The LOESS-smoothed distribution tries to remove observational errors and intrinsic scatter to estimate the mean values of the underlying
2[MgFe50]0=0.69×Mgb+Fe5015
galaxy population, thus approximating the mean values one would obtain from simple binning of much larger samples.
Overplotted on these points is a grid of SSP parameter pre-dictions from Schiavon (2007) for a super-solar [α/Fe]= 0.2. There is a trend of larger values of the IMF parameter (corre-sponding to ‘heavier’ IMFs) towards older, metal-rich objects. The trend, however, is not monotonic, with lower metallicity objects also showing relatively high IMF parameter values, on average.
The LOESS technique averages co-spatial data points, and as with any binning/averaging approach, the absolute range of values is reduced compared to the original data, via reduction of intrinsic and measurement scatter (e.g. compare the colour scale of Fig. 1 with the intrinsic IMF values implied in Fig. 2). The LOESS-averaged colour-map plots are useful to uncover the underlying trends, but to quantitatively treat correlations of the actual values, in the following section we analyse the two-dimensional projections of IMF with stellar population parameters individually.
3.2. IMF and SSP-parameters
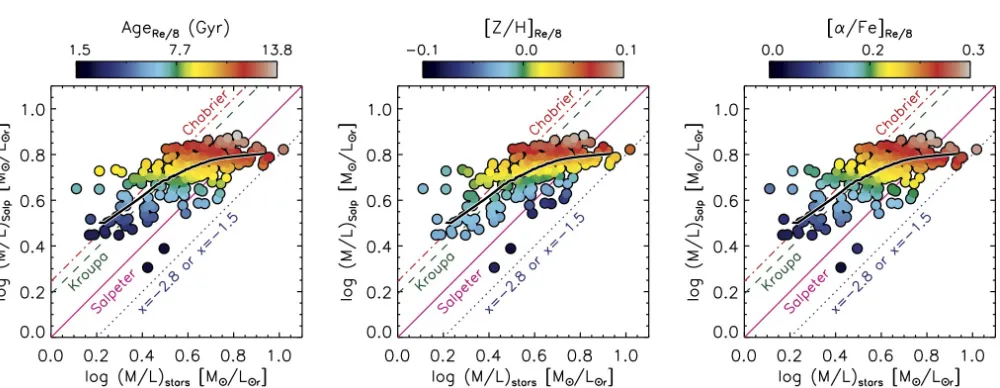
Each panel in Fig. 2 presents our two mass-to-light ratios (M/L)starsand(M/L)Salpplotted against each other, over-plotted with diagonal identity lines to indicate the correspond-ing IMF normalisation, such that the IMF varies perpendic-ular to these diagonal lines. The thick black line shows the result of a one-dimensional locally-weighted regression (LOESS) analysis, in order to trace the central ridge-line of the mass-to-light ratio points. The measured SSP parame-ters are indicated by coloured points, with the parameter name given in the plot title. Again, the SSP parameter values have been smoothed using the two-dimensional LOESS algorithm used in section 3.1 in order to show the average trend expected from a larger sample of galaxies. These plots are directly comparable to Fig. 11 of Cappellari et al. (2013b), where the colour scale was used to show how velocity dispersion varies in this plane.
It can be seen that the general trends agree with what was inferred above, namely that the IMF becomes systematically ‘heavier’,on average, for galaxies that are older, more metal rich, and additionally, more enhanced in alpha elements. It is clear from these plots, however, that stellar population isnot a good predictor ofαdyn. Theaveragetrend appears due to the fact that, while older, or alpha-enhanced, galaxies span a larger range ofαdynvalues going from Kroupa to heavier than Salpeter, the range ofαdynappears largely limited to Kroupa-like values for galaxies with young ages and low [α/Fe]. A similar conclusion can be drawn from Fig. 11 of Cappellari et al. (2013b), where galaxies with low velocity dispersion are similarly limited to Kroupa-like IMF normalisation. Metal-licity shows a broadly similar trend, however the detailed dis-tribution is different from that with age and [α/Fe], with the iso-metallicity bands running more parallel to the IMF nor-malisation. Notably, there are objects with low metallicity that require an IMF heavier than Salpeter, as in Fig. 1.
We note that the population parameters vary more tightly with (M/L)Salp than (M/L)stars, reflecting the strong de-pendence of stellar population M/L estimates on stellar popu-lation parameters. The dynamical M/L estimate is indepen-dent of stellar evolutionary effects, which may explain the broader range of population parameters at fixed(M/L)stars.
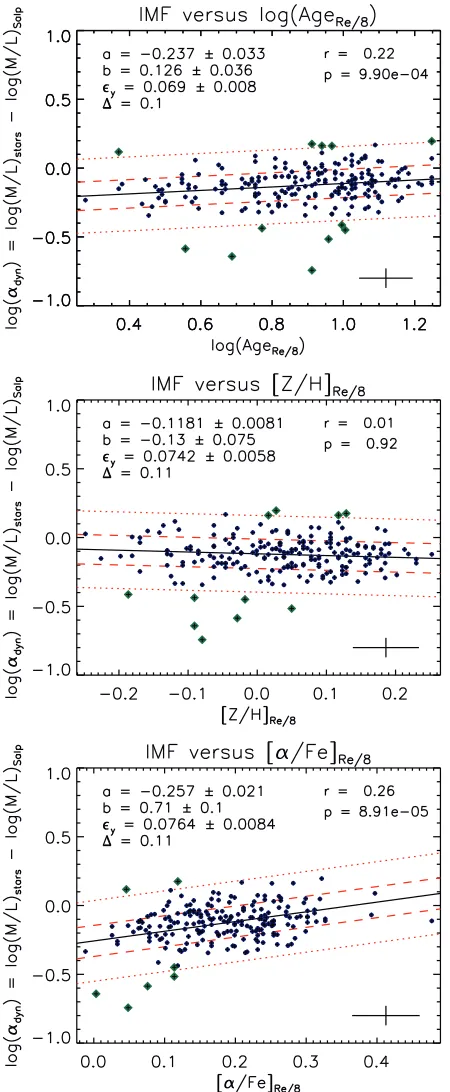
In Fig. 3 we present the two-dimensional relations of the IMF parameter and population parameters, where points rep-resent our individual measurements. A robust linear fit of
the form y = a + bx is made in each panel using the LTS LINEFIT routine described in Cappellari et al. (2013a), which combines the Least Trimmed Squares robust technique of Rousseeuw & Driessen (2006) into a least-squares fitting algorithm which allows for intrinsic scatter. Fit parameters are given on the upper-left of each panel. Our relations have around 25% scatter due to observational errors, with 12% in-trinsic scatter. The Spearman’s rank correlation coefficient (r) and the two-sided significance of its deviation from zero (0 < p < 1, with smaller values implying higher signifi-cance) are given on the upper right. The correlation coeffi-cient values, which are independent from the assumption of a linear relationship, confirm the presence of weak but statis-tically significant relationships ofαdyn with age and [α/Fe], and no evidence of a correlation with total metallicity.
4. DISCUSSION
The main result of this paper is that the trends between the dynamically-derived IMF normalisation parameterαdyn and stellar population parameters are weak. We find that old or alpha-enhanced galaxies have on average heavier IMF nor-malisation, but a heavy IMF is not only found in those galax-ies. Old (and high [α/Fe]) galaxies span a large range of IMF normalisation going from Kroupa to Salpeter, while young (and low [α/Fe]) ones seems to almost exclusively have a Kroupa normalisation. Metallicity shows a less clear distinc-tion, having a broad range of mass normalisations at all metal-licity values (Fig. 3, middle panel). Conroy & van Dokkum (2012) also find a weaker relationship between IMF and total metallicity, [Z/H], concluding, as here, that there is no com-pelling evidence of a correlation.
We have explored several avenues to verify the weak trends we find. For example, we find fully consistent results us-ing the mass-weighted age and metallicities from the spectral fits used to derive our(M/L)Salpinstead of the SSP values, showing that the different models (Schiavon SSP models ver-sus Vazdekis model spectra) and methods (chi-squared fitting for the best SSP versus pPXF spectral fitting of star formation histories for the mass-weighted values) yield consistent re-sults. Using the spectrum integrated within a full effective ra-diusReto derive the SSP parameters (instead ofRe/8) gives trends equivalent to Fig. 3 within the 1σuncertainties, with comparable scatter, correlation coefficient values and signif-icance (using this larger aperture, the Spearman (r, p) values become(0.23,1.1×10−3),(0.05,0.5)and(0.22,2.1×10−3) for the equivalent relations of IMF with age, metallicity and [α/Fe] respectively). This reassures us that our choice of aper-ture is not important, and that possible radial variations in the IMF (Pastorello et al. 2014) do not directly affect our conclu-sions.
disper-Figure 2. Each panel compares the mass-to-light ratio measured via stellar kinematics (subscript ‘stars’) and stellar populations (subscript ‘Salp’). The colour scale indicates the SSP stellar population parameter indicated by the colour bar above each plot. Popular IMF mass normalisations are indicated by diagonal lines with labels. The thick black curve traces the ridge-line of the points via a one-dimensional implementation of the LOESS locally-weighted regression technique.
sion, as this would give rise to consistent behaviour between all three stellar population parameters, which allpositively correlate with velocity dispersion.
The weak trends we find here are consistent with the sim-ilarly weak trend betweenαdynand velocity dispersion (r =
0.36,p = 5.7×10⁻⁸), reported in Cappellari et al. (2013b). A comparison of the ATLAS3D velocity dispersion - IMF relation with several published spectral studies (La Barbera et al. 2013; Conroy & van Dokkum 2012; Treu et al. 2010; Spiniello et al. 2014) is given in Fig. 12 of Spiniello et al. (2014). While there is overlap between the various spectral studies and ATLAS3Dover the range of velocity dispersion in common (σ >130km s−1), the overall relationship for the en-tire sample is significantly more shallow than that suggested by the spectral studies. Restricting our sample to galaxies with this range of velocity dispersion (where the agreement is best) results inshallowergradients in theαdyn- SSP rela-tions presented here, with larger uncertainties (a zero gradi-ent with age and [α/Fe] is excluded with only 2σconfidence rather than 5σ), and smaller correlation coefficients (r<0.16) with less significance (p> 0.02), consistent with no signifi-cant correlation ofαdynwith any population parameter.
Other explanations for the weak trends are possible biases in the dynamical and/or population IMF estimates. An ob-vious potential systematic problem with the dynamically de-rived IMF, which has often been invoked in the past, is the treatment of the dark matter content in the dynamical models. We showed in Cappellari et al. (2012) that for dark matter to explain the IMF trends, it would have to follow the stellar dis-tribution much closer than any current model predicts, making this explanation very unlikely.
Other sources of biases include general problems in the (M/L)Salpderived from stellar population models. Using the SSP models of Vazdekis et al. (2012) and Bruzual & Char-lot (2003) to derive (M/L)Salp from our line-strengths, we find that the weak age trend is removed due to the biased reduction in (M/L)Salp by young populations when using the (luminosity-weighted) SSP approach instead of (mass-weighted) spectral fitting. Any relationship with [Z/H] re-mains absent using this SSP approach, and the weak trend with [α/Fe], though present, becomes less significant, with
best-fit gradients excluding zero at only a 1-4σ level. Our weak trends are therefore a general outcome from different models and approaches.
Finally, we note that a direct comparison of the IMF param-eters for galaxies in common between our study and Conroy & van Dokkum (2012) yields only a weak relationship be-tween the two studies (Smith 2014). The relatively small over-lapping sample (34 objects), and differences in spatial aper-tures used in determining the IMF normalisation (their small central aperture versus our IMF analysis using data from, on average, one effective radius) preclude firm conclusions on how this lack of agreement relates to the systematic uncer-tainties of either study. Removing these remaining issues is the focus of future work.
5. CONCLUSIONS
We present the observed trends of stellar population param-eters with the dynamically determined IMF for 212 early-type galaxies from the ATLAS3Dsurvey. Using adaptive smooth-ing to highlight the average trends comparable to studies of larger samples, we find that the IMF normalisation tendson averageto be ‘heavy’ for both weak Hβ and/orweak metal absorption line strengths. Using single stellar population models, we show that the stellar population properties of age, metallicity and [α/Fe] span a broad range of values for any given IMF normalisation.
[image:4.612.61.561.56.250.2]Figure 3.Relations between the IMF (vertical axis) and SSP parameters age (top-left), metallicity (top-right) and [α/Fe] (bottom). A robust linear fit is shown (black solid line) together with 1σ(68%) and 2.6σ(99%) percentiles as red dashed and dotted lines respectively. Blue circular symbols indicate points included in the fit, with green diamonds showing points rejected dur-ing the iterative fittdur-ing. Fit parameters are given in the upper left of each panel, giving intercept (a), gradient (b), intrinsic scatter in the y-direction (y) and observed standard deviation around the fit (∆). Individual errors
were included in the fit, but for clarity, the median error for each panel is shown in the bottom right of each panel. Values in the upper right give the Spearman’s rank correlation coefficient (r) and significance (p).
The authors thank the referee for helping to improve this article. The research leading to these results has received funding from the European Community’s Sev-enth Framework Programme (/FP7/2007-2013/) under grant agreement No 229517. MC acknowledges support from a Royal Society University Research Fellowship. This work was supported by the rolling grants PP/E001114/1 and ST/H002456/1 and visitors grants PPA/V/S/2002/00553, PP/E001564/1 and ST/H504862/1 from the UK Research Councils. RLD acknowledges grants from Christ Church, Oxford and support from the Royal Society Wolfson Merit Award 502011.K502/jd. SK acknowledges support from the Royal Society Joint Projects Grant JP0869822. TN and MBois acknowledge support from the DFG Cluster of Excellence ‘Origin and Structure of the Universe’. MS acknowledges support from a STFC Advanced Fellowship ST/F009186/1. LY acknowledges support from NSF grant AST-1109803. The authors acknowledge financial support from ESO.
REFERENCES
Auger, M. W., Treu, T., Bolton, A. S., et al. 2010, ApJ, 724, 511 Bastian, N., Covey, K. R., & Meyer, M. R. 2010, ARA&A, 48, 339 Bruzual, G., & Charlot, S. 2003, MNRAS, 344, 1000
Cappellari, M. 2002, MNRAS, 333, 400
Cappellari, M., & Emsellem, E. 2004, PASP, 116, 138 Cappellari, M. 2008, MNRAS, 390, 71
Cappellari, M., Emsellem, E., Krajnovi´c, D., et al. 2011, MNRAS, 413, 813 Cappellari, M., McDermid, R. M., Alatalo, K., et al. 2012, Nature, 484, 485 Cappellari, M., Scott, N., Alatalo, K., et al. 2013, MNRAS, 432, 1709 Cappellari, M., McDermid, R. M., Alatalo, K., et al. 2013, MNRAS, 432,
1862
Cleveland W., & Devlin S., 1988, Journal of the American Statistical Association, 596
Conroy, C., & van Dokkum, P. 2012, arXiv:1205.6473
Conroy, C., Dutton, A. A., Graves, G. J., Mendel, J. T., & van Dokkum, P. G. 2013, ApJL, 776, L26
Emsellem, E., Monnet, G., & Bacon, R. 1994, A&A, 285, 723
Ferreras, I., La Barbera, F., de la Rosa, I. G., et al. 2013, MNRAS, 429, L15 Graves, G. J., Faber, S. M., & Schiavon, R. P. 2009b, ApJ, 698, 1590 Kroupa, P. 2002, Science, 295, 82
Kuntschner, H., Emsellem, E., Bacon, R., et al. 2010, MNRAS, 408, 97 La Barbera, F., Ferreras, I., Vazdekis, A., et al. 2013, MNRAS, 433, 3017 Maraston, C. 2005, MNRAS, 362, 799
McDermid, R. M., et al. 2006, MNRAS, 373, 906
Navarro, J. F., Frenk, C. S., & White, S. D. M. 1996, ApJ, 462, 563 Pastorello, N., Forbes, D. A., Foster, C., et al. 2014, MNRAS, 442, 1003 Peacock, M. B., Zepf, S. E., Maccarone, T. J., et al. 2014, ApJ, 784, 162 Rousseeuw, P.J. & Driessen, K. 2006, Data Mining and Knowledge
Discovery, 12, 1
Salpeter, E. E. 1955, ApJ, 121, 161
Scott, N., Cappellari, M., Davies, R. L., et al. 2013, MNRAS, 432, 1894 Schiavon, R. P. 2007, ApJS, 171, 146
Smith, R. J., Lucey, J. R., & Carter, D. 2012, MNRAS, 426, 2994 Smith, R. J., & Lucey, J. R. 2013, MNRAS, 434, 1964
Smith, R. J. 2014, MNRAS, 443, L69
Spiniello, C., Trager, S. C., Koopmans, L. V. E., & Chen, Y. P. 2012, ApJL, 753, L32
Spiniello, C., Trager, S., Koopmans, L. V. E., & Conroy, C. 2014, MNRAS, 438, 1483
Thomas, D., Maraston, C., Bender, R., & Mendes de Oliveira, C. 2005, ApJ, 621, 673
Thomas, D., Maraston, C., Schawinski, K., Sarzi, M., & Silk, J. 2010, MNRAS, 404, 1775
Tortora, C., Romanowsky, A. J., & Napolitano, N. R. 2013, ApJ, 765, 8 Treu, T., Auger, M. W., Koopmans, L. V. E., et al. 2010, ApJ, 709, 1195 van Dokkum, P. G., & Conroy, C. 2010, Nature, 468, 940
van Dokkum, P. G., & Conroy, C. 2011, ApJL, 735, L13