
For Peer Review
Ion mobility-mass spectrometry reveals conformational
flexibility in the deubiquitinating enzyme USP5
Journal: PROTEOMICS
Manuscript ID: pmic.201400457.R1
Wiley - Manuscript type: Research Article
Date Submitted by the Author: n/a
Complete List of Authors: Scott, Daniel; University of Nottingham, School of Life Sciences Layfield, Robert; University of Nottingham, School of Life Sciences Oldham, Neil; University of Nottingham, School of Chemistry
Keywords (free text entry): Structural proteomics, Protein conformation
For Peer Review
Ion mobility-mass spectrometry reveals conformational
flexibility in the deubiquitinating enzyme USP5
Daniel Scott
1,2, Robert Layfield
2, Neil J Oldham
1*1
School of Chemistry, University Park, University of Nottingham, Nottingham NG7 2RD, UK
2
School of Life Sciences, Queen’s Medical Centre, University of Nottingham, Nottingham NG7 2UH, UK
Corresponding author:
Dr Neil Oldham
Tel +44-115-951 3542
Fax +44-115-823 0142
Abbreviations: CCS: collisional cross section, CSD: charge state distribution, DUB: deubiquitinating enzyme, IMS: ion mobility spectrometry, IM-MS: ion mobility-mass spectrometry, small angle X-ray
scattering: SAXS, tD: drift time, TWIMS: travelling wave ion mobility spectrometry, USP5: ubiquitin
specific protease 5,
Keywords: Electrospray ionisation, ion mobility-mass spectrometry, protein conformation, ubiquitin specific protease 5
Total number of words: 4901
For Peer Review
AbstractMany proteins exhibit conformation flexibility as part of their biological function, whether through the
presence of a series of well-defined states, or by the existence of intrinsic disorder. Ion mobility
spectrometry, in combination with mass spectrometry (IM-MS), offers a rapid and sensitive means of
probing ensembles of protein structures through measurement of gas-phase collisional cross sections
(CCSs). We have applied IM-MS analysis to the multi-domain deubiquitinating enzyme ubiquitin
specific protease 5 (USP5), which is believed to exhibit significant conformational flexibility. Native
ESI-MS measurement of the 94 kDa USP5 revealed two distinct charge state distributions (CSDs): [M+17H]+
to [M+21H]+ and [M+24H]+ to [M+29H]+. The CCSs of these ions revealed clear groupings of 52 ± 4 nm2
for the lower charges and 66 ± 6 nm2 for the higher charges. Molecular dynamics (MD) simulation of a
compact form of USP5, based on a crystal structure, produced structures of 53-54 nm2 following 2 ns in
the gas-phase, whilst simulation of an extended form (based on small angle X-ray scattering data) led to
structures of 64 nm2. These data demonstrate that IM-MS is a valuable tool in studying proteins with
different discrete conformational states.
For Peer Review
1. IntroductionIon mobility spectrometry (IMS) linked to MS (IM-MS) is a powerful analytical and structural tool. The
orthogonality of the individual techniques affords 2-dimensional separation of analytes on the
size-to-charge and mass-to-size-to-charge axes, respectively [1]. From an analytical perspective, when applied to
complex mixtures, this gives far greater separation than is possible by either method alone [2]. IM-MS
that utilises either a static drift-tube IMS cell or a travelling wave IMS (TWIMS) cell has the added
advantage that it is able to measure the collisional cross section (CCS) of ions as absolute values in Å2 or
nm2 from the ion drift time (tD) data recorded [3]. When applied in combination with native
electrospray ionisation (ESI) conditions this ability can be used to provide valuable protein structural
information, albeit at relatively low resolution [4, 5]. The limited resolution afforded by IM-MS is offset
by the speed and sensitivity of the technique, which is orders of magnitude greater than X-ray
crystallography and NMR spectroscopy, and by its ability to provide information on large, dynamic or
heterogeneous protein complexes [6, 7]. Given these considerations, the greatest potential impact of
IM-MS in structural biology resides in areas where other, more established, techniques are of limited
value for reasons of size, complexity or time.
A significant consideration when using IM-MS for structural work is that measurements are
made in the gas-phase. The removal of solvent from a protein molecule during the electrospray process
represents a major perturbation, and raises the question of whether the method is suitable for providing
information appropriate for biological interpretation. Work summarised by Breuker and McLafferty in
2008 [8], and numerous studies performed since indicate that, although structural change (usually
compaction) occurs upon desolvation, for many proteins gross reorganisation of the fold does not
appear to take place on the time-frame (< 50 ms) of IMS measurements [9-12]. The degree of structural
collapse is, as one might expect, protein dependent. Flexible proteins with large voids and cavities
appear prone to considerable collapse post-desolvation, notably in the case of the chaperone protein
GroEL [13], but other examples have been reported [14]. With the exception of these extreme examples,
and providing care is taken to electrospray the protein from native conditions, using appropriate gas
pressures and minimal collisional activation, valuable (biologically relevant) structural information can
be gleaned from IMS-MS measurements [15-21]. This is especially so when experimental data is set
For Peer Review
alongside gas-phase molecular dynamics (MD) simulations to provide more realistic model structures
for comparison.
Recently we reported the detection of two distinct conformers of cytochrome P450 (CYP)
reductase (CPR) using IM-MS [22]. This enzyme, responsible for two separate single electron reductions
of the CYP haem iron, exists in interconverting compact and extended conformations linked to enzyme
function. IM-MS was able to detect two clear gas-phase conformations of CPR, which appeared to
reflect the solution structures. Encouraged by these results, we have investigated the deubiquitinating
(DUB) enzyme ubiquitin specific protease 5 (USP5), which is believed to exhibit conformational
flexibility to enable it to disassemble a range of polyubiquitin chain topologies.
Ubiquitination is a regulatory post-translational modification (PTM) which involves covalent
linkage of ubiquitin to target proteins by formation of an isopeptide bond between the C-terminal
Gly76 residue of ubiquitin and lysine residues present in target proteins. Polyubiquitin chains are then
often formed as a result of isopeptide, or peptide, linkages between multiple ubiquitin monomers,
where any of ubiquitin’s seven lysine residues or N-terminal Met can act as the site of attachment [23].
The modifications are associated with a range of functional outcomes, brought about by structural
diversity in polyubiquitin topologies, which promotes recruitment of different effectors proteins
containing ubiquitin-binding domains. Ubiquitination regulates a diversity of biological processes
including protein degradation, intracellular signalling and trafficking pathways. Like other PTMs,
ubiquitination is reversible and ubiquitin modifications can be removed by a family of DUBs [24]. USP5,
also known as isopeptidase T, selectively disassembles unanchored (i.e. substrate free) chains of
polyubiquitin [25]. These unanchored polyubiquitin chains have only very recently been realised to be
physiologically relevant, acting in different pathways such as in the regulation of 26S proteasome
activity [26], as second messengers in NF-κB signalling pathways [27], and as regulators of innate
immune signalling [28]. USP5 has also been directly implicated in other biological contexts, including
control of repair of DNA double strand breaks [29] and neuropathic and inflammatory pain [30], with
aberrant splicing linked to glioblastoma tumorigenesis [9]. At the level of primary structure, USP5
contains a number of functional domains which underlie its binding and hence catalytic activity against
unanchored polyubiquitin chains [31]. These include a ZnF-UBP ubiquitin-binding domain that binds
with relatively high affinity to the C-terminal di-Gly motif in the proximal ubiquitin of an unanchored
For Peer Review
chain [32], thereby providing a mechanism for the selective degradation of unanchored polyubiquitin,
as well as two ubiquitin-associated domains (also ubiquitin-binding) which recognise surface patches
on other ubiquitin moieties within the chain. Avidity effects underlie high affinity binding to
unanchored polyubiquitin, with catalytic activity provided by an additional UBP domain within the
primary sequence. An X-ray crystal structure of USP5 has been solved recently [33]. This identified the
positions of the three ubiquitin binding domains mentioned above, as well as revealing the presence of
a second, cryptic ZnF-UBP domain. The structure raised a number of important questions. In particular,
the orientation of the original ZnF-UBP with respect to the enzyme active site seemed inconsistent with
its proposed function in recognising unanchored polyubiquitin chains, and may be a result of a crystal
artefact. In addition, over 150 residues were missing from the structure. This was believed to be due to
inherent flexibility. Indeed, small angle X-ray scattering (SAXS) analysis, performed in the same study,
showed the existence of a structural form(s) significantly more extended than that seen by
crystallography. These observations all point towards considerable flexibility in the structure of USP5.
Here we report an investigation of USP5 using ESI-IM-MS, which provides further evidence of
conformational flexibility in this important regulatory enzyme.
2. Materials and Methods
2.1 Protein expression
The protein coding region of short full-length human USP5 (residues 1-835) was cloned from PCR
amplified human U20S cDNA. This PCR product was ligated into the BamHI/XhoI sites of pGEX-4T-1 (GE Healthcare, Buckinghamshire, UK) and subsequently mutagenized by site-directed mutagenesis
(QuikChange kit; Stratagene, Agilent, Stockport, UK), to introduce an active site (Cys335Ala) mutation,
preventing deubiquitination activity. The integrity of the construct was verified by DNA sequencing.
Plasmid DNA encoding GST-C335A USP5 was transformed into competent XL-10 gold cells, and
grown in a 2 L flask containing 1 L of Luria broth (LB) at 37 °C. When OD600 ~0.6 was reached, the
temperature was reduced to 15 °C and overexpression induced with 0.2 mM IPTG. Cell cultures were
then grown for 40 hours. The cell pellet was collected by centrifugation and snap frozen at -80 °C.
For Peer Review
2.2 Protein purificationThe cell pellet from 2.1 was re-suspended in lysis buffer (10 mL of 10 mM Tris (pH 8.0) buffer containing
0.5 M NaCl, 1 mM β-mercaptoethanol, 0.1 μM phenylmethylsulfonyl fluoride (PMSF), 0.1% (v/v) Triton
X-100) and freeze−thawed at −80°C before being lysed by sonication and clarified by centrifugation.
GST-C335A USP5 was subsequently affinity purified on Glutathione Sepharose 4B (0.5 mL, GE
Healthcare) in a gravity flow column (Qiagen, Manchester, UK). After the binding of GST-C335A IsoT,
the column was washed with thrombin cleavage buffer (20 mM Tris (pH 8.4) 500 mM NaCl, 2.5 mM
CaCl2) and incubated with 5 units of thrombin (Sigma-Aldrich, Dorset, UK) for 16 hours at 4 °C.
Released C335A USP5, with an N-terminal Gly-Ser dipeptide residual from thrombin cleavage,
was further purified by gel filtration on a HighLoad 16/60 Superdex 200 column (GE Healthcare) using
gel filtration buffer (20 mM Tris (pH 8.0), 0.5 M NaCl, 5% glycerol, 2 mM dithiothreitol). Fractions
corresponding to USP5 (as judged by SDS-PAGE) were pooled and concentrated by ultrafiltration using
Vivaspin 20 columns, with a 50 kDa MWCO (Sartorius Stedim Biotech, Epsom, UK), snap frozen and
stored at -20°C.
2.3 Sample preparation
USP5 samples were desalted from the gel filtration buffer into aqueous ammonium acetate (200 mM) by
10 washing cycles using Viva-Spin ultrafilters (10 kDa MWCO, 0.5 ml, Sartorius Stedim Biotech), and
quantified by nanodrop. Retentate solutions were diluted into ammonium acetate (200 mM) to a final
protein concentration of 10 μM.
2.4 Ion Mobility-Mass Spectrometry
Electrospray ionisation-travelling wave ion mobility-mass spectrometry was performed on a Waters
(Altrincham, UK) Synapt G1 High Definition Mass Spectrometer (HDMS) - a hybrid quadrupole/ion
mobility/orthogonal acceleration time of flight (oa-TOF) instrument. Static nanospray ionisation was
performed using the standard Waters nanospray source and home-made nanospray tips. Capillaries
were pulled using a Flaming/Brown P-97 micropipette puller (Sutter Instruments, California, USA).
Once pulled, the tips were coated in silver using a home-built vacuum evaporator. The nanospray tips
For Peer Review
were operated at a capillary voltage of 1.3 kV, with the instrument in positive-ion mode. The sample
cone was maintained at 30 V, required to avoid gas-phase unfolding. Collisional cooling was applied by
partially closing a Speedi-valve attached to the source pumping line until a backing pressure read-back
of 4.5 mBar was obtained. The ‘trap’ and ‘transfer’ T-wave collision cells, containing argon gas held at a
pressure of 2.5 x 10⁻² mBar, were operated at a collision energy of 5 V. The TWIMS ion mobility cell,
which contained nitrogen gas at 0.45 mBar and ambient temperature, was operated with a wave-height
of 10 V traveling at 300 m/s. Travelling wave parameters for the ‘trap’ and ‘transfer’ were: Trap 300 m/s,
0.5 V and transfer 248 m/s, 4 V. The oa-TOF-MS was operated over the scanning range of m/z 500-8000 at a pressure of 1.8 x 10⁻⁶ mBar. Identical conditions were used to analyse USP5 and the calibrations
standards. The instrument was controlled and data viewed using MassLynx 4.1 software (Waters).
TWIMS measurements on USP5 were calibrated against a set of standard CCS values for
beta-lactoglobulin, bovine serum albumin (BSA), and alcohol dehydrogenase (ADH) (Sigma-Aldrich) taken
from Bush et al., [34] using the method of Ruotolo et al. [6] (see Supplementary Information). IM drift
traces for each ion of USP5 were exported into Excel (Microsoft) and the arrival time data points
converted onto the CCS scale using the calibration parameters obtained. This allowed the drift traces
for each ion to be plotted on a CCS scale, with charge state correction.
2.5 Modelling and Molecular Dynamics
PDB entry 3IHP was used as a starting point for modelling USP5. The 151 missing residues were built
using iTASSER (35) and hydrogens added with MolProbity [36]. Protein molecular modelling was
performed using the Amber99SB force field [37] on the European eNMR grid [38]. The protein was
modelled using its net charge state under physiological conditions. Prior to MD simulations, the
structure was relaxed by 20,000 steps of energy minimization in the gas phase at 300 K (Amber 11
Sander parameters: imin=1 (energy minimisation mode), maxcyc=20000 (number of steps), ncyc= 500
(number of steepest descent algorithm steps), ntb=0 (period boundary off), cut=12.0 (non-bonded
cut-off in Å), igb=0 (no generalised Born solvent, i.e. gas-phase); all other parameters Sander defaults). This
removed the vast majority of clashes from the original iTASSER structure (from an unacceptable clash
score of 131/1000 atoms to an acceptable 0.7/1000 atoms, as assessed by MolProbity). A 2 ns gas-phase
For Peer Review
MD simulation was then run on the energy minimised structure at a constant temperature of 300 K
(Amber 11 Sander parameters: imin=0 (minimisation off, i.e. MD run), ntb=0 (period boundary off),
cut=12.0 (non-bonded cut-off in Å), igb=0 (no generalised Born solvent, i.e. gas-phase), ntt=3 (Langevin
thermostat), gamma ln=1 (collision frequency), temp0=300 (temperature in K), tempi=300 (initial
temperature in K), nstlim=2000000 (number of 1 fs steps), ntpr=100 (rate of information written to the
output file in steps), ntwx=2000 (rate of coordinates written to the output file in steps, i.e. 1000 sets of
coordinates over the 2 ns simulation), ig=73277 (random seed); all other parameters Sander defaults).
The 1000 output trajectories from this MD simulation were visualised in VMD, and every 5th structure
exported to a PDB file (to keep the file size manageable). The projection approximation (PA) CCS of
each structure was calculated using the DriftScope 2.1 CCSCalc program (Waters). To convert PA CCS
values to ‘Trajectory Method-like’ values they were multiplied by the empirical scaling factor 1.14 [39]. A
plot of CCS vs time was generated to assess the change in structure over the time of the MD run. To
estimate the theoretical CCS of the more extended conformation of USP5, corresponding to the higher
charge states, the energy minimised structure (above) was adjusted manually to mimic that seen in the
SAXS analysis [33]. The resulting structure was then relaxed and submitted to gas-phase MD (2 ns) as
described above.
3. Results
Recombinant human USP5 (short form) was expressed in E. coli and purified as described in the Materials and Methods. Following desalting into aqueous ammonium acetate (200 mM), USP5 (10 μM)
was examined by native ESI-MS using a Waters Synapt HDMS spectrometer, and home-made static
nanospray capillaries. The resulting spectrum, shown in Figure 1, revealed a measured molecular mass
of 93,792 Da. An interesting feature of the spectrum was the presence of two distinct charge state
distributions (CSDs): one around m/z 51o0, including [M+17H]+ to [M+21H]+, and a second around m/z
3700, including [M+24H]+ to [M+29H]+. Whilst we have occasionally observed discrete high charge state
populations of ions when examining His-tagged proteins by native nanoESI-MS, the phenomenon was
always removed upon cleavage of the tag. Recombinant USP5 used in this study was produced as a
GST-fusion, and the tag cleaved before purification and subsequent MS analysis, so that this could not be the
For Peer Review
explanation for the observed bi-model distribution of CSDs. Care was taken to optimise MS conditions,
and minimise the nanoESI capillary voltage (< 1.3 kV), but the resulting spectrum of USP5 was
unaltered, and the two CSDs reproducible. It is established that the average charge state exhibited by a
protein population, electrosprayed under native conditions, correlates with the surface area of the
protein [40, 41]. This indicated that two significantly different forms of USP5 were present in solution.
To probe this phenomenon further, IM-MS was employed. The Waters Synapt MS used in this
study is equipped with a TWIMS cell. Figure 2 shows the 2D trace of m/z vs tD recorded for USP5 under
native conditions. The two CSD populations are clearly visible. Due to the complex nature of the
electric field used in TWIMS devices, the CCS of ions cannot be determined directly from mobility drift
time values (tD), and calibration was required. Using the method of Ruotolo et al. [6], and standard
CCSs values provided by Bush et al. [34], the proteins beta-lactoglobulin, BSA and ADH were used to
calibrate the TWIMS cell (see Material and Methods and Supplementary Information for details). These
proteins were chosen to bracket the CCSs of USP5 ions, and electrosprayed under conditions identical
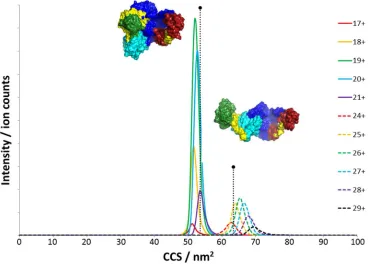
to those used for USP5 itself. Figure 3 shows the TWIMS drift traces for the major charge states of USP5
(see Figure 1). Data were plotted on a CCS axis to allow direct comparison between each species. The
two CSDs seen in Figures 1 and 2 also formed two clearly resolved groups on the CCS axis. Together the
lower CSD (17-21+) gave a mean CCS value of 52 ± 4 nm2, whilst the higher CSD (24-29+) possessed a
mean CCS value of 66 ± 6 nm2. The CCS values for each individual charge state are listed in the
Supplementary Information.
In order to provide insights into the structure of USP5 in the gas-phase, an MD simulation was
performed using the Amber99B force field (see Materials and Methods). Starting with the crystal
structure (PDB code 3IHP), and following modelling-in of 151 missing residues, the energy minimised
structure of USP5 was submitted to 2 ns of MD in the gas-phase, at 300 K, using the Amber Sander
parameters described in the Materials and Methods. Given the nature of USP5’s structure, significant
collapse was expected following desolvation. Figure 4 shows a plot of the CCS for each structure as a
function of time at a sampling rate of 1 structure every 10 ps. A rapid contraction of the structure from
its initial CCS of 63.4 nm2 to approximately 55 nm2, representing a reduction of 13 %, was apparent over
the first 200 ps of the simulation. For the remaining 1.8 ns of the MD run a steady decrease to a CCS of
approximately 53-54 nm2. The first marker on Figure 3 shows the position of 53.5 nm2 on the CCS axis,
For Peer Review
and is close to the range of CCSs exhibited by the low CSD of USP5 (within ca. 5 %). It appears that low
charge states of USP5 undergo only a small degree of additional collapse over that seen theoretically on
the 2 ns timescale. To provide a guide for the structure of the higher CSD ions a conformation of USP5,
which approximated to the extended SAXS structure in [33], was generated. Following relaxation, a 2 ns
gas-phase MD simulation was performed, as for the compact form. The structure was seen to collapse
from 74 nm2 to 64 nm2. A marker corresponding to 64 nm2 is shown on Figure 3.
Finally, to provide preliminary insights into the relevance of the two USP5 conformations for
substrate interactions we measured a spectrum of the enzyme in the presence of Lys48-linked
di-ubiquitin. The results (Supporting Information Fig. S7) show that the complex exhibits low charge
states only, meaning that it possesses a compact conformation, perhaps with USP5 domains folding
around the di-ubiquitin substrate.
4. Discussion
Using a combination of CSD analysis and IM-MS measurement we have shown that USP5 adopts two
clear sets of conformational states: a major compact form, and a minor extended form. Comparison of
these results with SAXS analysis [33] reveals striking similarities. First, each technique shows a similar
ratio of compact to extended conformers: approx. 3.5:1 by IM-MS (based on the relative integrals of the
two distributions in Figure 3), and 3:1 by SAXS (based on the 3 conformers per ensemble representation
in [33]). Secondly, the relative sizes (in units of area) of the two conformations are also similar when
measured by IM-MS (CCS: 66:52 nm2 = 1.3) and SAXS (Radius of gyration, Rg2: 20.:14 nm2 = 1.4, again
using the data for 3 conformers per ensemble representation in [33]). These findings, together with the
good agreement between measured CCSs and those obtained by gas-phase MD simulation, indicate that
IM-MS can provide important structural information on conformationally flexible proteins such as
USP5 even in the presence of gas-phase structural collapse.
The conformational flexibility of USP5 is believed to be essential for its function in
disassembling unanchored polyubiquitin chains possessing a variety of isopeptide linkages, and
therefore topological forms. The position of USP5’s C-terminal ZnF-UBP domain in the crystal structure
(it points away from the active site domain) appears to be at odds with its proposed role in recognising
unanchored polyubiquitin chains and guiding them to the enzyme’s active site. Indeed, the authors of
For Peer Review
the X-ray study discuss the possibility of a crystallisation artefact brought about by a non-native
disulfide bond in their structure [33]. The SAXS study (ibid), performed under reducing conditions, provides further evidence for extended as well as compact forms of USP5 in solution, and is in
agreement with the IM-MS data as discussed above.
In summary we present ESI-IM-MS data for the DUB USP5, which supports the proposal that it
exhibits considerable conformational flexibility in order to recognise and process a variety of
polyubiquitin chain topologies. These results further demonstrate that IM-MS is a valuable tool in
studying proteins with a number of discrete conformational states, in addition to those possessing
intrinsic disorder or misfolding.
Acknowledgements
We are grateful to the University of Nottingham for funding.
5. References
[1] Kanu, A.B., Dwivedi, P., Tam, M., Matz, L., Hill H.H. Ion mobility-mass spectrometry. J. Mass Spectrom. 2008, 43, 1, 1-22.
[2] Dwivedi, P., Wu, C., Matz, L.M., Clowers, B.H. et al. Gas-phase chiral separations by ion mobility spectrometry. Anal. Chem. 2006, 78, 8200-8206.
[3] Pringle, S.D., Giles, K., Wildgoose, J.L., Williams, J.P. et al. An investigation of the mobility separation of some peptide and protein ions using a new hybrid quadrupole/travelling wave
IMS/oa-ToF instrument. Int. J. Mass Spectrom. 2007, 261, 1-12.
[4] Jurneczko, E., Barran, P.E. How useful is ion mobility mass spectrometry for structural biology? The
relationship between protein crystal structures and their collision cross sections in the gas phase.
Analyst 2011, 136, 20-28.
[5] McLean, J.A., Ruotolo, B.T., Gillig, K.J., Russell, D.H. Ion mobility-mass spectrometry: a new
paradigm for proteomics. Int. J. Mass Spectrom. 2005, 240, 301-315
[6] Ruotolo, B.T., Benesch, J.L.P., Sandercock, A.M., Hyung, S.J., Robinson, C.V. Ion mobility-mass
spectrometry analysis of large protein complexes. Nat. Protoc. 2008, 3, 1139-1152.
For Peer Review
[7] Jurneczko, E., Cruickshank, F., Porrini, M., Nikolova, P. et al. Intrinsic disorder in proteins: a challenge for (un)structural biology met by ion mobility-mass spectrometry. Biochem. Soc. Trans. 2012,
40, 1021-U372.
[8] Breuker, K., McLafferty, F.W. Stepwise evolution of protein native structure with electrospray into
the gas phase, 10(-12) to 10(2) s. Proc. Natl. Acad. Sci. USA 2008, 105, 18145-18152.
[9] Wright, P.J., Zhang, J., Douglas, D.J. Conformations of gas-phase ions of ubiquitin, cytochrome c,
apomyoglobin, and beta-lactoglobulin produced from two different solution conformations. J. Am. Chem. Soc. Mass Spectrom. 2008, 19, 1906-1913.
[10] Wyttenbach, T., Bowers, M.T. Structural stability from solution to the gas phase: native solution
structure of ubiquitin survives analysis in a solvent-free ion mobility-mass spectrometry environment. J. Phys. Chem. B 2011, 115, 12266-12275.
[11] Liu, L., Bagal, D., Kitova, E.N., Schnier, P.D., Klassen, J.S. Hydrophobic protein-ligand interactions
preserved in the gas phase. J. Am. Chem. Soc. 2009, 131, 15980–15981.
[12] Breuker, K., Brüschweiler, S., Tollinger, M. Electrostatic Stabilization of a Native Protein Structure
in the Gas Phase. Angew. Chem. Int. Ed. 2011, 50, 873–877.
[13] Hogan, C.J. Jr, Ruotolo, B.T., Robinson, C.V., Fernandez de la Mora, J. Tandem differential mobility
analysis-mass spectrometry reveals partial gas-phase collapse of the GroEL complex. J. Phys. Chem. B
2011, 115, 3614-3621.
[14] Afonso, J.P., Chintakayala, K., Suwannachart, C., Sedelnikova, S., et al. Insights into the structure and assembly of the Bacillus subtilis clamp-loader complex and its interaction with the replicative
helicase. Nucleic Acid Res. 2013, 41, 5115-5126.
[15] Jurneczko, E., Cruickshank, F., Porrini, M., Clarke, D.J. et al. Probing the Conformational Diversity of Cancer-Associated Mutations in p53 with Ion-Mobility Mass Spectrometry. Angew. Chem. Int. Ed.
2013, 52, 4370-4374.
[16] Knapman, T.W., Warriner, S.L., Valette, N.M., Ashcroft, A.E. Ion mobility spectrometry-mass
spectrometry of intrinsically unfolded proteins: Trying to put order into disorder. Curr. Anal. Chem.
2013, 9, 181-191.
[17] Hochberg, G.K.A, Ecroyd, H., Liu, C., Cox, D. et al. The structured core domain of αB-crystallin can prevent amyloid fibrillation and associated toxicity. Proc. Natl. Acad. Sci. U.S.A. 2014, 111, E1562-E1570.
For Peer Review
[18] Uetrecht, C., Rose, R.J., van Duijn, E., Lorenzen, K., Heck, A.J.R. Ion mobility mass spectrometry of
proteins and protein assemblies. Chem. Soc. Rev. 2010, 39, 1633-1655.
[19] Uetrecht, C., Barbu, I.M., Shoemaker, G.K., van Duijn, E., Heck, A.J. Interrogating viral capsid
assembly with ion mobility-mass spectrometry. Nat. Chem. 2011, 3, 126-132.
[20] Loo, J.A., Berhane, B., Kaddi,s C.S., Wooding, K.M. et al. Electrospray ionization mass spectrometry and ion mobility analysis of the 20S proteasome complex. J. Am. Soc. Mass Spectrom. 2005, 16, 998-1008. [21] Wyttenbach, T., Grabenauer, M., Thalassinos, K., Scrivens, J.H., Bowers, M.T. The Effect of Calcium
Ions and Peptide Ligands on the Relative Stabilities of the Calmodulin Dumbbell and Compact
Structures. J. Phys. Chem. B 2010, 114, 437-447.
[22] Jenner, M., Ellis, J., Huang, W.C., Raven, E.L. et al. Detection of a Protein Conformational Equilibrium by Electrospray Ionisation-Ion Mobility-Mass Spectrometry. Angew. Chem. Int. Ed. 2011, 50, 8291-8294.
[23] Komander, D., Rape, M. The ubiquitin code. Annu. Rev. Biochem. 2012. 81, 203-229.
[24] Heride, C., Urbé, S., Clague, M.J. Ubiquitin code assembly and disassembly. Curr Biol. 2014, 24, R215-220.
[25] Reyes-Turcu, F.E., Shanks, J.R., Komander, D., Wilkinson, K.D. Recognition of polyubiquitin
isoforms by the multiple ubiquitin binding modules of isopeptidase T. J. Biol. Chem. 2008, 283, 19581-19592.
[26] Dayal, S., Sparks, A., Jacob, J., Allende-Vega, N. et al. Suppression of the deubiquitinating enzyme USP5 causes the accumulation of unanchored polyubiquitin and the activation of p53. J. Biol. Chem.
2009, 284, 5030-41.
[27] Xia, Z.P., Sun, L., Chen, X., Pineda, G. et al. Direct activation of protein kinases by unanchored polyubiquitin chains. Nature 2009, 461, 114-9.
[28] Zeng, W., Sun, L., Jiang, X., Chen, X. et al. Reconstitution of the RIG-I pathway reveals a signaling role of unanchored polyubiquitin chains in innate immunity. Cell 2010, 141, 315-30.
[29] Nakajima, S., Lan, L., Wei, L., Hsieh, C.L., et al. Ubiquitin-specific protease 5 is required for the efficient repair of DNA double-strand breaks. PLoS One 2014, 9, e84899.
For Peer Review
[30] García-Caballero, A., Gadotti, V.M., Stemkowski, P., Weiss, N. et al. The Deubiquitinating Enzyme USP5 Modulates Neuropathic and Inflammatory Pain by Enhancing Cav3.2 Channel Activity. Neuron
2014, 83, 1144-1158.
[31] Izaguirre, D.I., Zhu, W., Hai, T., Cheung, H.C. et al. PTBP1-dependent regulation of USP5 alternative RNA splicing plays a role in glioblastoma tumorigenesis. Mol Carcinog. 2012, 51, 895-906.
[32] Reyes-Turcu, F.E., Horton, J.R., Mullally, J.E., Heroux, A. et al. The ubiquitin binding domain ZnF UBP recognizes the C-terminal diglycine motif of unanchored ubiquitin. Cell 2006, 124, 1197-1208. [33] Avvakumov, G.V., Walker, J.R., Xue, S., Allali-Hassani, A. et al. Two ZnF-UBP Domains in
Isopeptidase T (USP5). Biochemistry 2012, 51, 1188-1198.
[34] Bush, M.F., Hall, Z., Giles, K., Hoyes, J. et al. Collision cross sections of proteins and their complexes: A calibration framework and database for gas-phase structural biology. Anal. Chem. 2010, 82, 9557–9565.
[35] Roy, A., Kucukural, A., Zhang, Y. I-TASSER: a unified platform for automated protein structure and
function prediction. Nat. Protocols 2010, 5, 725-738.
[36] Chen, V.B., Arendall, W.B., Headd, J.J., Keedy, D.A. et al. MolProbity: all-atom structure validation for macromolecular crystallography. Acta Crystallogr. Sect. D: Biol. Crystallogr. 2010, 66, 12-21.
[37] Case, D.A., Cheatham, T.E., Darden, T., Gohlke, H. et al. The Amber biomolecular simulation programs. J. Comput. Chem. 2005, 26, 1668-1688.
[38] Bertini, I., Case, D.A., Ferella, L., Giachetti, A., Rosato, A. A Grid-enabled web portal for NMR
structure refinement with AMBER. Bioinformatics 2011, 27, 2384-2390.
[39] Benesch, J.L.P., Ruotolo, B.T. Mass spectrometry: come of age for structural and dynamical biology.
Cur. Opin. Struct. Biol. 2011, 21, 641-649.
[40] Kaltashov, I.A., Mohimen, A. Estimates of protein surface areas in solution by electrospray
ionization mass spectrometry. Anal. Chem. 2005, 77, 5370-5379.
[41] Kaltashov, I.A., Abzalimov, R.R. Do ionic charges in ESI MS provide useful information on
macromolecular structure? J. Am. Soc. Mass Spectrom. 2008, 19, 1239-1246.
For Peer Review
Figure LegendsFigure 1. nanoESI-MS spectrum of USP5 (10 μM) in ammonium acetate (200 mM, pH 7) showing the two
CSDs centred around m/z 3700 and m/z 5100. A small signal due to the USP5 dimer is also present.
Figure 2. IM-MS plot of m/z vs tD for USP5 (10 μM) in ammonium acetate (200 mM, pH 7) showing
separation of the protein’s two CSDs on both axes.
Figure 3. IM-MS drift trace for USP5 plotted on a CCS axis showing the two distinct distributions of
conformers by charge state. Markers for 54 and 64 nm2, corresponding to the compact and extended
outputs of gas-phase MD simulation are provided. The structures shown are the final outputs of 2 ns
gas-phase MD simulations described in the text.
Figure 4. Plot of CCs vs time for the gas-phase MD simulation of the compact and extended model
structures of USP5 showing the gas-phase collapse of both species over 2 ns [33].
For Peer Review
Figure 1. nanoESI-MS spectrum of USP5 (10 µM) in ammonium acetate (200 mM, pH 7) showing the two CSDs centred around m/z 3700 and m/z 5100. A small signal due to the USP5 dimer is also present.
254x190mm (96 x 96 DPI)
For Peer Review
Figure 2. IM-MS plot of m/z vs tD for USP5 (10 µM) in ammonium acetate (200 mM, pH 7) showing separation of the protein’s two CSDs on both axes.
254x190mm (96 x 96 DPI) 2
For Peer Review
Figure 3. IM-MS drift trace for USP5 plotted on a CCS axis showing the two distinct distributions of conformers by charge state. Markers for 54 and 64 nm2, corresponding to the compact and extended outputs of phase MD simulation are provided. The structures shown are the final outputs of 2 ns
gas-phase MD simulations described in the text. 254x190mm (96 x 96 DPI)
For Peer Review
Figure 4. Plot of CCs vs time for the gas-phase MD simulation of the compact and extended model structures of USP5 showing the gas-phase collapse of both species over 2 ns [33].
254x190mm (96 x 96 DPI) 2


![Figure 4. Plot of CCs vs time for the gas-phase MD simulation of the compact and extended model structures For Peer Reviewof USP5 showing the gas-phase collapse of both species over 2 ns [33]](https://thumb-us.123doks.com/thumbv2/123dok_us/8679939.378151/20.612.125.491.127.393/figure-simulation-extended-structures-reviewof-showing-collapse-species.webp)
