Original citation:
Tian, Y. and Zhao, C.Y. (2009). Heat transfer analysis for phase change materials (PCMs). In: The 11th International Conference on Energy Storage (Effstock 2009), Stockholm, Sweden, Jul 14-17, 2009. Effstock Conference Proceedings 2009, No. 28, pp. 1 - 8.
Permanent WRAP url:
http://wrap.warwick.ac.uk/46839
Copyright and reuse:
The Warwick Research Archive Portal (WRAP) makes the work of researchers of the University of Warwick available open access under the following conditions. Copyright © and all moral rights to the version of the paper presented here belong to the individual author(s) and/or other copyright owners. To the extent reasonable and practicable the material made available in WRAP has been checked for eligibility before being made available.
Copies of full items can be used for personal research or study, educational, or not-for-profit purposes without prior permission or charge. Provided that the authors, title and full bibliographic details are credited, a hyperlink and/or URL is given for the original metadata page and the content is not changed in any way.
Publisher’s statement:
A note on versions:
The version presented in WRAP is the published version or, version of record, and may be cited as it appears here.
Heat Transfer Analysis for Phase Change Materials (PCMs)
Y. Tian, C.Y. Zhao*
School of Engineering, University of Warwick, CV4 7AL, Coventry, UK *Corresponding author (Tel: +44 24 76522339 , Email:[email protected])
Abstract
The heat transfer enhancement for phase change materials (PCMs) has received much attention nowadays, since most of PCMs have low thermal conductivities which prolong the charging and discharging processes. Metal foams, as a sort of novel material with relatively high thermal conductivity, are believed to be a promising solution to enhance heat transfer performance and shorten charging and discharging processes of PCMs for waste heat recovery and thermal energy storage systems. In this paper analytical analyses have been carried out for heat transfer enhancement in PCMs by using metal foams. The prediction results agree fairly well with the experimental data. The solid/liquid phase change heat transfer performance can be improved significantly by 3 to 10 times depending on the metal foam microstructures.
Nomenclature
qw= heat flux
Tm= fusion temperature
T0= initial temperature
HL= latent heat of fusion
Cp= specific heat at constant pressure
k= thermal conductivity L= length of PCM x= coordinate of location t= time
tref= reference time
T(x,t)= temperature function (continuous) Ti, j= temperature function (discrete)
f(x,t)= heat source function (continuous) fi, j= heat source function (discrete)
h= increment ofx r= characteristic number
Subscripts
i= index number of location j= index number of time ref= reference value
Superscripts
* = dimensionless parameters
+ = right limit of certain function
- = left limit of certain function
Greek
= density
= thermal diffusivity = increment oft
1. Introduction
Global warming incurred by CO2 has been an imminent issue to be tackled, so it is crucial to
find reliable solutions to reduce CO2 emissions. Renewable energy resources, such as solar
Most PCMs suffer the common problem of low thermal conductivity [2], being around 0.2 and 0.5 for paraffin and inorganic salts, respectively, which prolongs the charging and discharging period. Metal foams [3-5], as a sort of novel material with relatively high thermal conductivity (owing to metal ligaments with high thermal conductivity and special porous microstructures), are believed to be a promising material for enhancing heat transfer performance and accelerating the charging and discharging processes of PCMs. In addition, Mills et al. also studied the effect of graphite matrix [6] on thermal conductivity, and showed that significant improvement in thermal conductivity had been achieved as well as metal foams.
This paper presents a numerical thermal analysis of heat conduction of paraffin (used as PCMs) embedded inside the copper foams.
2. Problem description and governing equations
[image:3.595.118.491.310.497.2]2.1 Problem description
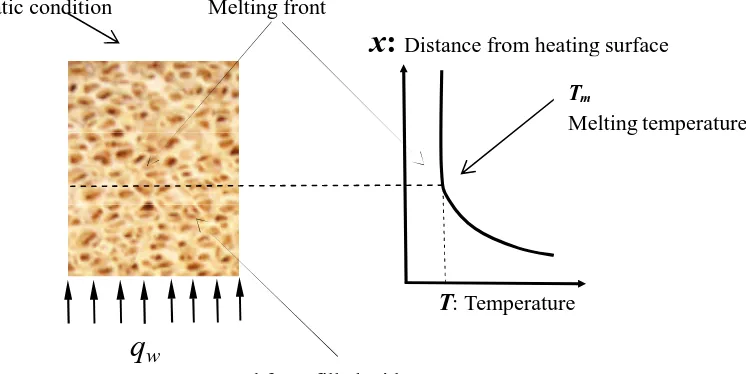
Fig. 1 Schematic of PCM subject to constant heat fluxqw
As is shown in Fig. 1, PCMs are encapsulated in metal foams made of copper, and they are subject to constant heat fluxqwon the left side.
2.2 Governing equations with boundary & initial conditions
2.2.1 Dimensional forms of governing equations
2
2
( , ) ( , )
T x t T x t
t x
(1)
0
( , 0)
T x T (2)
(0, ) w
T t
k q
x
(3)
( ( ), ) m
T S t t T (4)
T: Temperature Melting front
q
wAdiabatic condition
Metal foam filled with PCMs
Tm
Melting temperature
( , ) 0
T L t x
(5)
Note:
Eq. (3): boundary condition atx=0 (the boundary which is subject to constant heat flux) Eq. (4): boundary condition atx=S(t)(melting front)
Eq. (5): boundary condition atx=L(the adiabatic boundary)
The above equations can be solved only if S(t)has been given, unfortunately it is unlikely for us to obtainS(t) beforehand. The function,S(t), which stands for moving melting boundary, is being coupled with T(x,t). The correlation betweenS(t)and T(x,t)is given by Eq. (6), which can be obtained by the Energy Conservation Law.
( ) ( ( ) , ) ( ( ) , )L
d S t T S t t T S t t
H k k
dt x x
(6)
In Eq. (6), the superscript “+”means the Right Limit in Mathematics, representing solid zone
of PCMs, while the superscript “-”means the Left Limit in Mathematics, representing fluid zone of PCMs.
2.2.2 Non-dimensional forms of governing equations
In order to acquire non-dimensional forms of governing equations, the following variable
substitutions have been used.
* x
x L
(7)
* ( )
( ) S t
S t L (8) * 0 ( , )
( , ) m
m
T x t T
T x t
T T (9) * w ref L q t t t
t L H
(10)
L ref w H L t q (11)
With these variable substitutions above being used, non-dimensional forms of governing equations are obtained as follows:
* * * 2 * * *
*
* *2
( , ) ( , )
T x t T x t
t x
(12)
* *
( , 0) 1
T x (13)
* *
*
0
(0, ) w
m
Lq
T t
k
x T T
* * * (1, ) 0 T t x (15) * * * *
( ( ), ) 0
T S t t (16)
* * * * * * * * * * 0 * * * ( ) ( ( ) , ) ( ( ) , ) m wd S t T T T S t t T S t t
q k k
dt L x x
(17)
where * L
p w
kH C Lq
.
2.3 Effective thermal conductivity of metal foams
The complicated microstructures in metal foams are also hard to deal with. In this study a three-dimensionally structured model (tetrakaidecahedron) presented by Boomsma and
Poulikakos [7] has been used to deal with the effective thermal conductivity of metal foams, which is shown in Eq. (18) .
22 2 2 2
2 2 2 2 2 3 2 2 2 4
2 (1 ) 4 2 (1 ) 2 2 4 ( 2 )
2 2 2
4
2 1 2 2 2 2 2 1 2 2
2 2 (5 8) 2 2
0.339 3 4 2
e
A B C D
A B
s f s f
C D
s f
s f
k
R R R R
e
R R
e e k e e k e e k e e e k
e e
R R
e k e k
e k e e k
e e e e (18)
3. Numerical procedure
3.1 Explicit scheme 2
2
( , ) ( , )
( , )
T x t T x t
f x t
t x
(19)
The parabolic equations like Eq.(19) can be discretized into the following forms:
, 1 -1, (1- 2 ) , 1, , 2 ( 2, 3, , 1; 1, 2, , 1)
i j i j i j i j i j
T rT r T rT f r i m j n
h
(20)
Note: Ti, jdenotes the temperature of the i-th node at thej-th time-step. andh are the time
step and distance step respectively.
So far, it has been possible for us to calculate Ti j, 1 (at next time-step) from Ti j, (at current
time-step) just by using Eq.(20).
3.2 Implicit scheme
1, 1 (1 2 ) , 1 1, 1 , , 1
i j i j i j i j i j
rT r T rT T f
Unlike explicit scheme, Ti j, 1 (at next time-step) can not be obtained from Ti j, (at current
time-step) just by using Eq.(21) in implicit scheme. Insteadly, a series of algebraic equations
have to be solved in order to acquire Ti j, 1 at next time-step. Fortunately, the coefficient
matrix of Eq.(21) is a tridiagonal matrix, which can be solved easily.
According to our programming tests, explicit scheme has poor convergence and hence needs smaller time-step for convergence. While implicit scheme shows good convergence in big range of time-step. Both schemes can lead to the same results.
3.3 Phase change interface
By using numerical manipulation of every discretization nodes, it is easy to put some virtual
heat sources at those nodes that are absorbing or releasing their latent heat energy and keep their temperatures constant at the same time
4. Results and Discussions
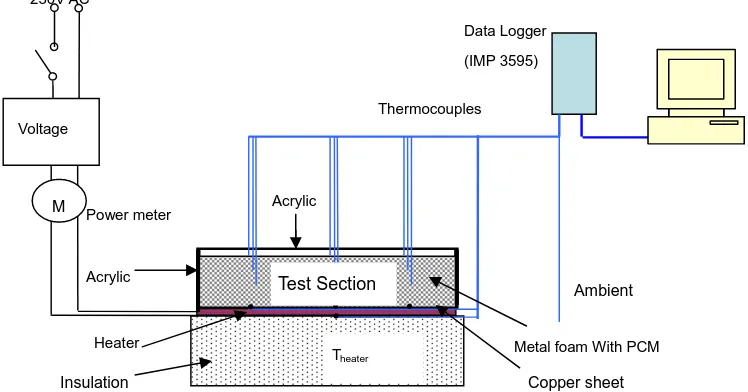
[image:6.595.113.487.437.633.2]An analytical analysis of the melting process of paraffin wax RT58 has been made, and the analytical results are compared with the corresponding experimental data. Fig. 2 shows our experiment rig, where a rectangular copper foam (200x120x25 mm in dimension, 10 ppi, 95% porosity), was embedded in RT58 (melting temperature 58 oC, heat storage capacity 181 kJ/kg). The metal foams were sintered with a copper plate, and an electrical heating film was attached on the bottom surface of the copper plate to provide the continuous uniform heat flux.
Fig. 2 Schematic of experiment rig
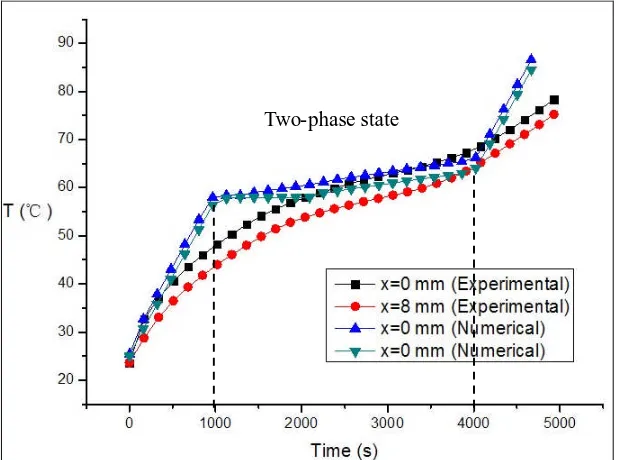
Fig. 3 shows the plot of temperature vs. time at different locations, where the variable x denotes the local distance from the bottom wall. It indicates that the location near wall has higher temperature, PCM began to melt around t=1000s and then stayed to be a two-phase state during the period from t=1000s to t=4000s. These agree fairly well with the experimental data.
There is a platform in numerical results shown in Fig. 3 when PCM starts melting, while this
Power meter
Heater
Data Logger (IMP 3595)
Thermocouples
Ambient
Theater M
230V AC
Voltage
Insulation Acrylic
Metal foam With PCM Copper sheet
Test Section
platform can not be found in experimental data. This is because paraffin wax RT58 is not a sort of proper crystal material which has fixed melting point. So this PCM would not melt under constant temperature, which is confirmed by our experimental results shown in Fig. 3.
[image:7.595.144.453.223.453.2]In Fig. 3, experimental data shows the temperature of PCM increases with a slowing-down rate as time goes on (before melting), which is different from the corresponding numerical results. This can be attributed to the more heat loss as the temperature rises. However, in the present one-dimensional analysis the perfect insulation boundary condition has been used, neglecting the heat loss at the boundary, and thereby leading to nearly straight heating lines shown in numerical results.
Fig. 3 Comparisons between experimental data and numerical solutions (RT58 embedded into the metal-foam samples with 95% porosity).
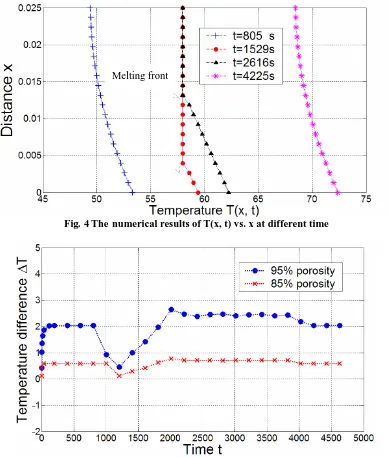
From Fig. 4, it can be concluded that RT58 is solid state when t=805 s (melting point: 58℃), parts of RT58 have been molten when t is 1529 s and 2616 s, and all the PCM has become full liquid state when t=4225 s. In addition, the melting front can be clearly seen from Fig. 4, since melting point of RT58 is 58℃. The temperature on the lower side of the melting front is higher than the melting temperature, while the temperature on the upper side of melting front is slightly lower than the melting point, and these parts of RT58 are ready to melt.
Fig. 5 shows the temperature differences between the heating wall and the location which is 8mm from the wall, including the metal-foam samples with 95% and 85% porosity respectively, and it clearly shows that metal foam with 85% porosity has smaller temperature difference than that with 95% porosity, namely better heat transfer performance can be obtained when metal foam with 85% porosity is used. This is because the metal foam with 85% porosity has more solid structures and a higher thermal conductivity than that with 95% porosity, and the former can transfer heat flux more efficiently from the bottom surface to the PCM through the metal foam skeleton..
Fig. 4 The numerical results of T(x, t) vs. x at different time
Fig. 5 A numerical comparison between different metal-foam samples
In Fig. 5, temperature differences for both metal-foam samples increase rapidly from 0℃ in the beginning, since the initial temperature is uniform inside the samples. Then it begins to stay stable for a while until the melting starts when t is around 1000 s, at this time temperature difference has a steep decrease, this is because the PCM around heating wall starts to melt and absorbs much heat from wall which significantly slows temperature rising on the wall. When t is around 1200 s, a small part of PCM near wall has been heated into liquid (which means it does not absorb latent heat any more) so the temperature of wall increases with a faster speed. Consequently, there is an increase of temperature difference then. After that, PCM continues to melt, and when t is 2000 s, the PCM that is 8mm from wall has become into liquid state and it does not absorb latent heat any more, so the heat from wall will be mainly used to heat other parts of PCM for phase change, consequently temperature difference here will keep relatively stable afterwards.
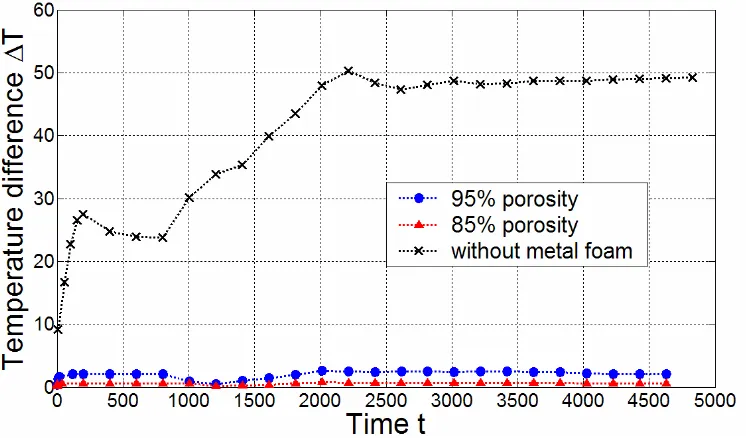
Fig. 6 Comparison between pure PCM sample and metal-foam samples (experimental)
Fig. 6 shows a comparison between pure PCM sample and metal-foam samples with different parameters, and it indicates that the temperature differences in metal-foam samples are much smaller than that in pure PCM (3 to 10 times). This indicates that heat transfer can be enhanced significantly by using metal foams, and metal foams embedded into PCMs can be a good solution for accelerating the charging and discharging processes of PCMs. In this analysis the natural convection is not considered, the natural convection will reduce the metal foam effect in the real situation. This warrants a further detailed study by using two-dimensional numerical simulations.
Acknowledgements
This work is supported by the UK Engineering and Physical Science Research Council (EPSRC grant number: EP/F061439/1) and Warwick Research Development Fund (RDF) Strategic Award (RD07110).
References
[1] B. Zalba, J. M. Marin, L. F. Cabeza, and H. Mehling, Review on thermal energy storage with phase change:
materials, heat transfer analysis and applications, Applied Thermal Engineering, 23 (2003), 251-283.
[2] E.S. Mettawee and G.M.R. Assassa, Thermal Conductivity enhancement in a Latent Heat Storage System,
Solar Energy, 81 (2007) 839-845.
[3] V. V. Calmidi, and R. L. Mahajan, Forced convection in high porosity metal foams, J. of Heat Transfer, 122
(2000) 557 –565.
[4] W. Lu, C. Y. Zhao, S. A. Tassou, Thermal Analysis on Metal-Foam Filled Heat Exchangers, Part I:
Metal-Foam Filled Pipes, Int. J. Heat and Mass Transfer, 49 (2006) 2751-2761.
[5] C. Y. Zhao, T. J. Lu, H. P. Hodson, and J. D. Jackson, The Temperature Dependence of Effective Thermal
Conductivity of Open-Celled Steel Alloy Foams, Materials Science and Engineering: A, 367 (2004) 123-131.
[6] A. Mills, M. Farid, J. R. Selman, S. Al-Hallaj, Thermal conductivity enhancement of phase change materials
using a graphite matrix, Applied Thermal Engineering, 26 (2006), 1652 -1661.
[7] K. Boomsma, and D. Poulikakos, On the effective thermal conductivity of a three-dimensionally structured