© Indian Journal of Medical Research and Pharmaceutical Sciences http://www.ijmprs.com/
[23]
SALIVARY FLOW ESTIMATION- AN ALTERNATE AND NON- INVASIVE METHOD
Naveen Srinivas*, Ketki Sali, Praveen Kumar Ramurg, Anju Anu Jose & Sneha. C.
Khanapure
*Assistant Professor Department of Oral Medicine and Radiology PMNM Dental College and Hospital, Bagalkot Karnataka.
Private Practitioneer, Consultant Oral Pathologist MDS (Oral Pathology) No 16 B.V.V.S Campus, Bagalkot Karnataka
Reader Department of Oral Medicine and Radiology PMNM Dental College and Hospital, Bagalkot Karnataka.
Assistant Professor Department of Oral Medicine and Radiology School of Dental Sciences, Shardha University Campus Greater Noida, Utter Pradesh.
Assistant Professor Department of Public Health Dentistry Maharashtra Institute of Dental Science and Research. Latur, Maharashtra
Abstract
Keywords:
saliva: chromatography:
filter paper:
hyposalivation.
The objective of the study was to use a simple method for estimation of resting salivary flow rate with the help of paper chromatography.
Materials and Methods: Sample size consisted of 180 participants from whom saliva was collected to determine the flow rate using chromatography filter paper, which was further compared with the salivary flow rate per minute using spitting method. Analyse comprised of 3 spots encompassing starch and potassium iodide per spot on filter paper. Based on the color response on the chromatography filter paper the salivary flow rate was estimated.
Results: Pearson’s correlation test showed highly significant negative correlation when the salivary flow rate and the number of colored dots were compared.
Conclusion: The method is accurate and can be of use in assessing the resting flow rate of saliva
Introduction
Saliva often known as the “the blood stream of oral cavity” has numerous functions like keeping oral cavity moist to prevent ulcerations, prevents dental caries by constantly flushing teeth surface among many other.[1]
Hyposalivation causes unpleasant symptoms such as masticatory dysfunction, swallowing disorders, dental caries, periodontal diseases, halitosis, ill-fitting dentures, taste and speech disorders, pain and burning sensation in the oral mucosa.[2,3] Hence, it is important to assess changes in salivary flow rate at the earliest to prevent the above mentioned complications.
Whole saliva which is a product of secretion of three major salivary glands namely parotid, submandibular, and sublingual along with many minor glands (labial, buccal, palatal).[4]
Thus salivary flow rate of a person could indicate the functional activity of these major and minor salivary glands.
Salivary flow rate can be measured by stimulated and un-stimulated methods which include Saxon’s test, Schimer’s test, drooling methods etc.[5,6] In stimulated method the salivary secretion is induced by mechanical aids which
© Indian Journal of Medical Research and Pharmaceutical Sciences http://www.ijmprs.com/
[24]
include chewing of paraffin wax, sterilized rubber bands, gustatory method where lemon drops are used, pharmacological method etc. The normal stimulated salivary flow rate is said to be 3 ml/min. [7]
Un-stimulated salivary flow is measured by drooling method where the saliva is let to drip off from the mouth, or by asking the patient to spit into the measuring cup.[8,9]
Normal levels of un-stimulated salivary flow is said to be from 0.25 to 0.35 ml/min.[10]
Other common methods to measure salivary flow rate include swab method where a cotton swab is pre-weighed before the collection and placed near the orifice of the salivary duct and the amount of saliva collected after secretion is measured depending on the weight of the swab. The suction and swab method causes a small extent of stimulation and inconsistency and thus are not recommended for un-stimulated salivary collection whereas swab technique is thought to be less consistent among the above mentioned methods.[11]
As stated in the above-mentioned methods there as some practical disadvantages for measuring the flow rate which lead us to attempt a new method of measuring the salivary flow rate. Hence we aimed to measure the resting salivary flow rate by using paper chromatography.
Objectives of the study
To estimate the un-stimulated salivary flow rates using chromatography filter paper.
To compare the salivary flow rates using chromatography filter paper and spitting method.
Materials and method
The sample consisted of 180 subjects who visited the local dental clinics of Bagalkot city Karnataka between 10am to 8pm.Patients consent was obtained and saliva collection was carried out by 2 different methods which comprised of traditional spitting method of whole saliva into the graduated cups and an innovative approach using chromatography paper. Results of both the methods were compared statistically using Pearson’s correlation. The study was conducted during January 2015 to November 2015.
Inclusion criteria
Subjects between the age of 20yrs to 40 yrs were included in the study.
Apparently healthy individuals were included.
Exclusion criteria
Subjects who complained of dryness mouth.
Individuals who had the habit of smoking and chewing tobacco and pan.
Patients with systemic diseases and on long term medication.
Saliva collection using traditional method
Subjects were asked to sit in an upright position with their heads slightly bent forward and were given graduated cups and asked to collect saliva in their mouths for about one minute and spit into the cups.
Saliva collection using chromatography paper
The chromatography paper was placed in the sublingual region with the patient being in a head down position and saliva was allowed to flow onto the chromatography paper. The paper was taken out after one minute. After the chromatography paper was taken out coloring agent was added to check the coloured spots which would help in analysing the salivary flow rate.
Method of preparation of chromatography paper and coloring agent
Chromatography paper was cut in a rectangular shape with measurement of 70mm x 20mm as per the method given by Takashi et al to aid in easy insertion and visualization of the colored spots. Detecting reagent consisted a mixture of 1% starch solution and 0.3 mol/L potassium iodide solution. Chemicals were dissolved in 0.1 mol/lt Tris Hcl
© Indian Journal of Medical Research and Pharmaceutical Sciences http://www.ijmprs.com/
[25]
buffer with its pH adjusted to 7.3 in a ratio of 3:1 and placed onto the paper at 3 different spots using micropipette.
The prepared chromatography paper was kept in a black box overnight to avoid any premature reaction.
On the day of sample collection colouring agent was freshly prepared which comprised of 31% hydrogen peroxide, ethanol and distilled water at a ratio of 1:7:1.[12,13]
Figure1: positive colour reaction to the colouring reagent
Results
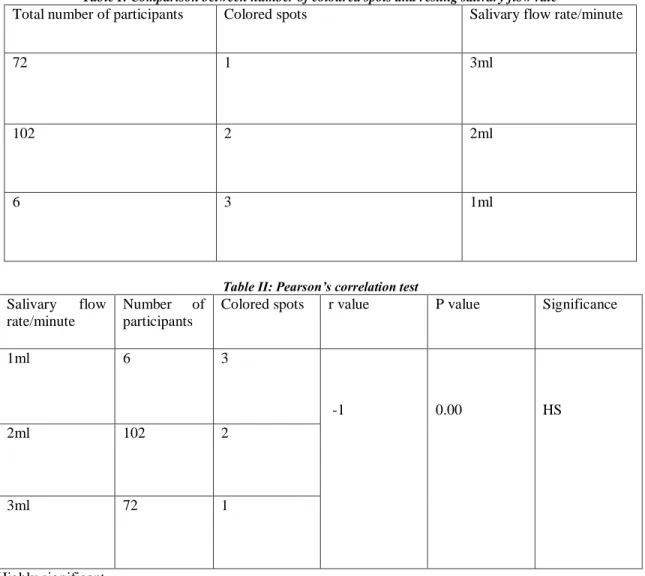
Our study consisted of 180 participants. Among them 72 subjects had a salivary flow rate of 3ml/min which corresponded to 1colored spot on the chromatography paper, 102 subjects had flow rate of 2ml/min that gave 2 colored spots and 6 subjects who had flow rate of 1ml/min which corresponded to 3 colored spots as depected in Table I. Stastistical analysis was conducted using Pearson’s correlation to compare the relation between the colored spots and the salivary flow per minute that gave a highly statistical significant difference with a p value being <0.05 and pearson’s correlation value (r) of -1 as shown in Table II.
© Indian Journal of Medical Research and Pharmaceutical Sciences http://www.ijmprs.com/
[26]
Table I: Comparison between number of coloured spots and resting salivary flow rate
Total number of participants Colored spots Salivary flow rate/minute
72 1 3ml
102 2 2ml
6 3 1ml
Table II: Pearson’s correlation test Salivary flow
rate/minute
Number of participants
Colored spots r value P value Significance
1ml 6 3
-1 0.00 HS
2ml 102 2
3ml 72 1
HS: Highly significant Pearson’s correlation: r:-1 p: <0.05
Discussion
Saliva is one such fluid, which can be collected non-invasively from the oral cavity. Saliva is used in numerous diagnostic procedures that include microbial experiments, chemical and biochemical experiments, DNA analysis, drugs, cancer detection, hormones, sialometric analysis etc. Whole saliva is a mixture of oral fluids that includes secretions from the major and minor salivary glands. In addition saliva also contains several constituents of non- salivary origin, these include gingival crevicular fluid, expectorated bronchial and nasal secretions, serum and blood derivatives from oral wounds, bacteria and bacterial products, viruses and fungi, desquamated epithelial cells, other cellular components, and food debris[9] therefore collection of saliva aids in the diagnosis of many oral disorders.
There are several methods for the collection of saliva with specifically designed apparatus that aid in collection of the sample. These methods include cannulation of a single salivary duct [14]
or by a metal or acrylic cup placed over the Stenson's duct for the collection of pure parotid saliva 15 Crevicular fluid can be collected by inserting a micropipette or filter paper directly into the gingival crevice [16.17] These methods can be time consuming in case of screening of patients and require trained personnel for the collection.
Hence, we tried to determine a new method to estimate the flow of saliva using chromatography filter paper wherein
© Indian Journal of Medical Research and Pharmaceutical Sciences http://www.ijmprs.com/
[27]
the salivary flow rate was determined depending on the appearance of coloured spots on chromatography paper that gave remarkably good results.
The theory behind appearance of the coloured spots on the filter paper is the reaction of saliva between starch and potassium iodide in the chromatography paper and the colour reaction of iodine-starch to hydrogen peroxide.[12]
The assay system consisted of 3 spots 1 mm apart containing starch and potassium iodide on the filter paper.
Potassium iodide gets displaced when it comes in contact with saliva, in contrast to this starch does not get displaced and gets retained in the original spot. Thus, when a colouring reagent that contained hydrogen peroxide was added on to the filter paper produced blue coloured spots in those areas that were not infiltrated by saliva. On the contrary, areas where saliva had infiltrated did not show any coloured spots. Hence, we compared the number of coloured spots and the quantity of saliva collected by spitting method. Our results showed a statistical significant difference with a negative correlation by Pearson’s correlation method. This means that as the salivary flow increases the number of coloured spots decrease indicating that the salivary flow is good. Similarly as the flow decreases the spots increase which shows there is alteration in the salivary flow.[8] Figure 1 showing the colour change in the filter paper with one, two and three sports respectively.
This method can be of use in case of patients who need a constant follow up of salivary flow rate for example in case of patients who present with dry mouth after radiotherapy for cancer, screening for xerostomia patients to prevent occurrence of dental caries, in geriatric patients etc. Studies have also shown that resting salivary flow rate is comparatively more reliable than stimulated salivary flow rate in determination of oral dryness.[18,8]Hence this method can be helpful in the early diagnosis of oral dryness.
The main advantage of this technique is that it is of affordable cost, does not need any trained professional, time saving and can be carried out on large scale. The strips can be prepared in advance and stored in a dark container for 3 months.
© Indian Journal of Medical Research and Pharmaceutical Sciences http://www.ijmprs.com/
[28]
Algorithm Of The Test
References
1. Shifa S, Muthu MS, Amarlal D, Rathna Prabhu V. Quantitative assessment of IgA levels in the unstimulated whole saliva of caries‑free and caries‑active children. J Indian Soc Pedod Prev Dent 2008;26(4):158‑61.
2. Grisius MM. Salivary gland dysfunction: A review of systemic therapies. Oral Surg Oral Med Oral Pathol Oral Radiol Endod 2001;92(2):156-62.
3. Atkinson JC, Grisius MM, Massey W. Salivary hypofunction and xerostomia: diagnosis and treatment.
Dent Clin North Am 2005;49(2):309-26.
4. Smith DJ, Taubman MA, Ali‑Salaam P. Immunoglobulin isotypes in human minor gland saliva. J Dent Res 1991;70(3):167‑70.
5. Chen A, Wai Y, Lee L, Lake S, Woo SB. Using the modified Schrimer test to measure mouth dryness: A preliminary study. J Am Dent Assoc 2005;136(2):164-70.
6. Keitel W, Z Gesamte, Spieler C. The Saxon test for objective assessment of xerostomia: A contribution to the diagnosis of Sjögren’s syndrome. Z Gesamte Inn Med 1989;44(11):340-1.
7. de Almeida Pdel V, Grégio AM, Machado MA, de Lima AA, Azevedo LR. Saliva composition and functions: A comprehensive review. J Contemp Dent Pract 2008;9(3):72-80.
8. Longman LP, McCracken CF, Higham SM, Field EA. The clinical assessment of oral dryness is a significant predictor of salivary gland hypofunction. Oral Dis 2000;6(6):366-70.
9. Kaufman E, Lamster IB. The diagnostic applications of saliva – A review. Crit Rev Oral Biol Med 2002;13(2):197-212.
10. Llena-Puy C. The role of saliva in maintaining oral health and as an aid to diagnosis. Med Oral Patol Oral Cir Bucal 2006;11(5):E449-55.
11. Wong DT. Salivary Diagnostics. 1st ed. Ames, Iowa: WileyBlackwell; 2008.
© Indian Journal of Medical Research and Pharmaceutical Sciences http://www.ijmprs.com/
[29]
12. Kanehira T, Yamaguchi T, Takehara J, Kashiwazaki H, Abe T, Morita M, et al. A pilot study of a simple screening technique for estimation of salivary flow. Oral Surg Oral Med Oral Pathol Oral Radiol Endod 2009;108(3):389-93.
13. Kanehira T, Yamaguchi T, Asano K, Morita M, Maeshima E, Matsuda A et al A screening test for capsaicin-stimulated salivary flow using filter paper: a study for diagnosis of hyposalivation with a complaint of dry mouth. Oral Surg Oral Med Oral Pathol Oral Radiol Endod 2011;112(1):73-80
14. Jacobs N, Nicolson NA, Deron C, Derespaul P, van-Os J, Myin-Germeys I. Electronic monitoring of salivary cortisol sampling compliance in daily life. Life Sci 2005;76(21):2431–43.
15. Hu S, Denny P, Xie Y, Loo JA, Wolinsky LE, Li Y et al. Differentially expressed protein markers in human submandibular and sublingual secretions. Int J Oncol 2004;25(5):1423–30.
16. Kivlighan KT, Granger DA, Schwartz EB. Blood contamination and the measurement of salivary progesterone and estradiol. Horm Behav 2005;47(3):367–70.
17. Holm-Hansen C, Tong G, Davis C, Abrams WR, Malamud D. Comparison of oral fluid collectors for use in a rapid point-of-care diagnostic device. Clin Diagn Lab Immunol 2004;11(5):909–12.
18. Kalk WW, Vissink A, Spijkervet FK, Bootsma H, Kallenberg CG, Nieuw-Amerongen AV. Sialometry and sialochemistry: Diagnostic tools for Sjögren’s syndrome. Ann Rheum Dis 2001;60(12):1110-6