Nonlinear Regime of Signal Transmission
I. A. Khovanov∗Department of Physics, Lancaster University, Lancaster LA1 4YB, United Kingdom
Thenonlineartransformation of an external noisy signal by an array of non-interacting elements with internal noise is considered. The array simulates a neuronal system that processes spike trains. It is shown that increasing the number of array elements entails significant extending of the stochastic synchronization region and improvement of the signal-to-noise ratio (SNR). The effects are demonstrated for arrays of triggers, overdamped bistable oscillators and Fitzhugh-Nagumo systems. The interrelation between SNR improvement and the efficiency of information processing is discussed.
PACS numbers: 05.40.-a,05.45.Xt,05.50.+q,84.35.+i
Keywords: stochastic processes; synchronization; nonlinear dynamical systems; noise; neuron
I. INTRODUCTION
The interplay between noise and the nonlinearity of a system can produce nontrivial effects that lead to en-hancement of the system response. A remarkable exam-ple of this is signal processing by a threshold element, when any sub-threshold signals cannot be detected with-out an additional noise component, and by tuning noise intensity one is able to optimize the detection. This ex-ample is a manifestation of a more general phenomenon called stochastic resonance (SR) [1, 2]. Initially, the es-sential ingredients providing SR effect have included a bistable system, a periodic signal and white noise [3, 4], but later they were significantly extended [1, 2], and it has been shown that for a wide range of situations, noise is able to optimize the system response.
Unflagging interest in SR can be explained by the vari-ety of possible combinations of system nonlinearity, sig-nal and noise properties. Another important factor is the relevance of SR to biological processes, especially to neuroscience [5], where fluctuations persist from the molecular level (e.g. ion channels) to networks. This fac-tor induces the study of information transformation via complex networks of elements with external and inter-nal noise sources [5]. It has been shown that a network (or an array of elements) enhances significantly the sys-tem response in comparison with a single element [6–9]. The conclusion is valid for a variety of array configura-tions with or without coupling of elements, with different types of local and global couplings. In the neuroscience context, a parallel array of nonlinear elements with a summing center attracts a lot of attention [10–14]. It has been shown that internal noise in such a parallel ar-ray leads to the optimization of information transmis-sion in a wide range of noise intensity. This optimization can be explained by noise-induced linearization of the nonlinear responses of individual elements [14, 15] and,
∗Electronic address: [email protected]
consequently, the array response can be described in the framework of linear response theory [15].
In this contribution we consider a nonlinear regime of a parallel array with summing and nonlinear end ele-ments. The array encodes an input signal into a sequence of switching events (spikes) [16], and the informational component of the input signal has the same structure as the output of the array. The nonlinear regime in the sys-tem is realized when the amplitude of the signal is large enough. Within the nonlinear regime, many different ef-fects, for example, the generation of higher harmonics [17], can be observed. We concentrate our attention on stochastic synchronization [19] and signal-to-noise-ratio (SNR) improvement [20, 21].
The effect of stochastic synchronization is an impor-tant one from the signal processing point of view. Syn-chronization occurs when noise-induced switchings be-tween system’s states follow the phase of the external signal, and it is observed in the range of noise intensity [18, 19, 22–25]. In [26], it has been shown that switch-ing synchronization can be realized for a random spike train, i.e noise induces switching for each spike. An ex-perimental study of stochastic synchronization in a bio-logical system has been done in [27]. This phenomenon is important for understanding signal processing in the neuronal system, since it specifies the conditions when noise induces a regime of complete (optimal) information transmission by spikes, and it is observed simultaneously over a wide range of noise amplitude.
a limitation on the maximal intensity of internal noise, and starting with a certain value of input SNR (inten-sity of the noise component) the synchronization does not occur. The main result of work [18] consists of the following. A large number of uncoupled elements per-turbed by independent noise sources tends to “remove” the nonlinearity of each element, and the independence of noise sources “removes” output noise during summing. As a result, with increasing the number of elements, the array’s response tends to be linear and noise-free, i.e. it repeats the shape of the input signal. Consequently, synchronization between input and output signals is ob-served. In the present paper the regime is fundamentally nonlinear, so for a large amplitude of input signal the de-scribed linearization does not occur, but the synchroniza-tion can still take place since a larger signal modulates strongly noise-induced switchings, for example, reaching the threshold of the excitable element is possible for a specific range of signal phase only (see [19, 24, 25, 28] for details).
SNR improving (gain) was observed experimentally in a number of systems [20, 21, 29] and corresponding theo-retical support of the experimental results has also been provided later[30]. The gain means that the output value of SNR exceeds the input value [30]. In [21, 31], SNR gain in connection with switching statistics has been dis-cussed. Recently, Cubero et al [32] have numerically shown that an array of coupled nonlinear elements is able to increase significantly SNR gain in comparison with a linear array1. Note that the presence of SNR gain is usually interpreted as an enhancement of signal trans-mission, so we further discuss the interrelation between SNR gain and the efficiency of signal processing.
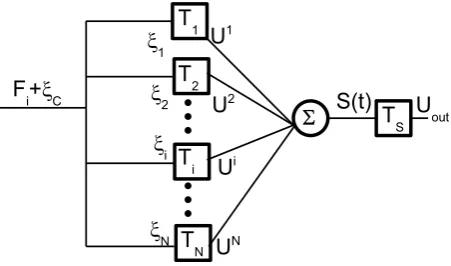
The configuration of the considered array is shown in Fig. 1. The main difference from previously discussed configurations [10–14, 18] is the presence of the last (end) nonlinear element, TS, following after a summing center
∑
. The nonlinear element TS is characterized by the same nonlinearity as the base element,Ti. This modifica-tion leads to the configuramodifica-tion used for neuronal networks in the visual system [5] and corresponds to the cascade model of the neuron [33]. In this case input informa-tion is encoded by the output spike train (a sequence of switchings), but not by the shape of the input signal [10– 13]. In previous investigations [10–14, 18], arrays of both bistable and excitable elements have been considered. In fact, both types of elements are used as a base element of neuronal networks [5, 34]. Therefore, we consider both of them in order to analyze the role of the base element’s dynamics. In Sec. II we investigate arrays of two bistable units: Schmitt triggers and bistable overdamped oscilla-tors. An array of excitable elements is discussed in Sec. III. The conclusions drawn are summarized in Sec. IV.
1 We have to note that some previous reported results of SNR gain
in arrays raised some questions (see comment [31] for details).
Technical details of numerical simulations are presented in the Appendix.
II. BISTABLE ARRAY
Let us, first, consider the Schmitt trigger as a base ele-ment. The trigger is the simplest non-dynamical bistable system with a pure two-state dynamics defined by its hys-teresis loop. In the case of a symmetric loop, the trigger’s dynamics is described by the following equation:
U(t) =U0 sgn(∆U−F(t)), (1)
F(t) =Fi(t) +ξc(t) +ξi(t);
here F(t) is an input signal; “sgn” is the sign function; ∆U = |∆U|sgn[U(t)] are the trigger’s thresholds; the output valueU(t) is equal to either positive or negative U0, i.e. U(t) = ±U0, and it is controlled by the signal
F(t), i.e. ifF(t)>|∆U|, the trigger is in its upper state +U0, and ifF(t)<−|∆U|, then it is in the state−U0.
The input signal F(t) consists of three components. The informational componentFi(t) is a periodic sequence of rectangular pulses with frequency f = 1/T (or an-gular frequency Ω = 2π/T) and amplitude A: Fi(t) = (−1)m(t)A, wherem(t) =⌊2t/T⌋,⌊x⌋= max{n∈Z|n≤
x}is the floor function ofx. The amplitudeAis compara-ble with, but less than, the threshold value, i.e. the infor-mational component is a sub-threshold one and cannot be detected without some additional components. The second component is common noiseξc(t), superimposed on pulsesFi(t). The third component is internal additive noise ξi(t) acting independently in each element. Note that a 3-component input was used in [18], whereas in most cases [10–14, 32], the common noise, ξc(t), is not considered. Both noises are modeled as twice low-pass filtered Gaussian white noise η(t) (see [35] for details) with identical cut-off frequencies, 1/τ = 100, for both filters:
¨ ξ+2
τ ˙ ξ+ 1
τ2ξ= √
2D
τ η(t). (2)
The intensities of the white noise sources areDc for com-mon noise andDfor the internal noise sources. IfDc̸= 0, then a signal with a finite SNR acts on each element.
The sum of trigger outputs S(t) = ∑Ni Ui(t) acts on triggerTs, which in turn produces the output of the con-sidered array Uout. Our aim is to consider the array performance as a function of the intensity D of inter-nal noise. To this aim, two measures are discussed: The mean switching rate (MSR), ⟨f⟩, (or angular frequency
FIG. 1: The configuration of the considered array of elements.
is sufficient to characterize a signal transmission via the bistable array.
The SNR is defined by analogy with the conventional definition, used for a harmonic signal in a noisy linear system, as the common logarithm of the ratio between the weight of the δ-peak, Si, in the power spectrum at the pulse repetition frequency Ω, to the intensity of the noisy background,Sn, at the same frequency [30]:
R= 10 log10
Si(Ω) Sn(Ω)
(3)
and it is measured units of decibels (dB). The definition is based on the fact [30, 31, 38, 39] that the output of a periodically forced system is a superposition of periodic and noisy components.
Let us consider the dynamics of the array in the ab-sence of common noiseξc(t), i.e. Dc= 0. The population dynamics of the single elementni±(t) are defined by the probability thati-element is in one of the states +U0 or −U0. The rate equations for populationsn±(t) have the
forms [40, 41]
˙
n+=−r−n++r+n− (4)
˙
n−=−r+n−+r−n+,
where r±(t) are the threshold crossing rates. For the trigger, the rates are [35]:
r±(t) = 1 2πτ exp
(
−[±|∆U| −Fi(t)]2τ D
)
. (5)
Note that using expression (5) has provided good corre-spondence between theoretical and experimental results (see [25] for details). In Ref. [30], it has been demon-strated that in the case of periodic pulses, the long-time solution of (4) has the form:
n+(t) =−
1 2 +
Fi(t)∆r 2A
[
1 + ∆re
−γ(t−m(t)T /2)
1 +e−γT /2
]
, (6)
where γ =r+(0) +r−(0), ∆r= [r−(0)−r+(0)]/γ.
Ex-pression (6) specifies a periodic function, i.e. n+(t) =
n+(t+T) for any t. In the regime when the
switch-ing rate is comparable with the frequency f, the last term in the brackets is practically constant, and the time dependence of the population coincides with the in-put signal Fi(t), i.e. it is a rectangular shape function with some maximalnmax+ and minimal valuesnmin+ (note
that nmax
+ = 1−nmin− and nmin+ = 1−nmax− ). In the
synchronization regime, nmax± is close to the unit value, whereasnmin
± is close to zero: nmax± >1−ϵ, nmin± < ϵ, maxtr±(t) > f, ϵ ≪ 1. In other words, the difference ∆nm=nmax± −nmin± >1−2ϵis close to the unit value.
The input of the end elementTsis the sum of outputs S(t) = ∑Ni Ui(t), and S(t) is a random discrete-value variable distributed accordingly to the time-dependent Bernoulli law:
P[S(t)] =CjN nj+(t) [1−n+(t)]N−j, (7)
where j = 0.5(S −N) and j = 0,1,2. . . N, CN
j =
N!/(j!(N−j)!) are binomial coefficients, andn+(t) is the
time dependent population of i-element. The discrete-value signal S(t) can be approximated by a continuous signal with a normal distribution [42], which is defined by a time dependent mean value µ(t) =N[2n+(t)−1]
and a varianceσ2(t) = 2N n
+(t)[1−n+(t)]. Dynamics of
the mean valueµ(t) is determined by the population dy-namicsn+(t) and consequently it is a periodic function of
time and repeats the shape ofn+(t). So, in the
synchro-nization regimeµ(t) is a rectangular shape function with some maximal and minimal values±µmand a very nar-row switching region in the case maxtr±(t)> f. Ifµmis larger than the threshold|∆U| and it is larger than 4σ, then the input ofTsis supra-threshold and the switching process is a practically deterministic one and controlled by Fi(t), i.e. ⟨ω⟩ = Ω. It means that the regime of synchronization is realized. The condition µ = 4σ can be considered as the right hand (in respect to maximal noise intensity) synchronization boundary and leads to the following relation for the populationsn± to observe synchronization:
∆nm=nmax± −nmin± >
√
1
N+ 1. (8)
In other words, synchronization can be observed for any arbitrary small difference between populations by in-creasing the number of array elements. It means that by using the array we are able to extend the synchro-nization region in the noise intensity domain up to any arbitrary value.
0.01 0.02
〈
ω
〉
(a)
10−7 10−6 10−5 10−4
40 60 80
D
R
(b)
0 0.01
〈
ω
〉
(c)
10−7 10−6 10−5 10−4
0 20 40 60
D
R
(d)
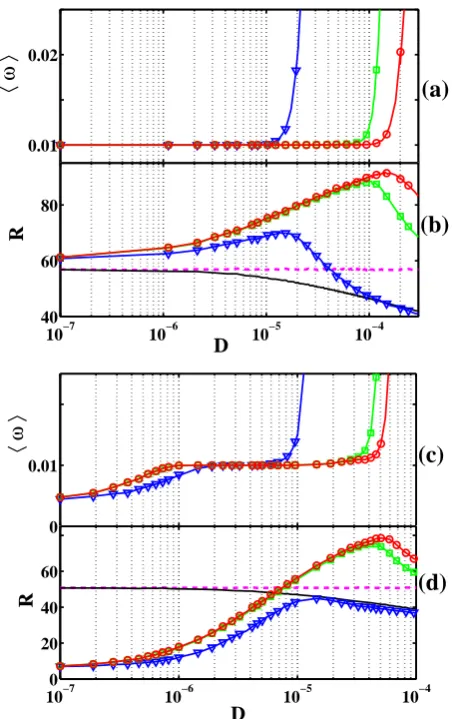
FIG. 2: (Color online) Results of simulations for array of Schmitt triggers. Angular MSR⟨ω⟩(a and c) and SNRR (b and d) are shown as functions of internal noise intensityD. The parameters are Ω = 0.01,τ= 1/100,U0= 1,|∆U|= 0.1 for all simulations. Figures (a) and (b) correspond to the parameters values: A = 0.06 and Dc = 0.00001; figures (c) and (d) correspond to A = 0.025 and Dc = 0.000007. In figures (a) and (c) markers ▽ (blue lines), (green lines) and⃝(red lines) correspond to an array ofN = 1, N = 50 andN= 500 elements respectively. Input SNRs are shown by dashed (magenta) lines (without internal noise,D = 0) and by solid (black) lines (with internal noise,D ̸= 0) in figures (b) and (d). Output SNRs of array are shown by different markers in figures (b) and (d).
intensity Dc. The extension of the synchronization re-gion is clearly demonstrated by increasing the number of elements. The output SNR, R, can exceed both the in-put SNR of the array [dashed lines in Fig. 2 (b) and (d)], when internal noise is not taken into account,D= 0, and the input SNR of an individual element [solid lines in Fig. 2 (b) and (d)], when internal noise is taken into consid-eration,D̸= 0. This SNR gain is a non-trivial nonlinear effect, since by tuninginternal noise only, one is able to improve the SNR of an externalnoisy signal. Note that the recently reported SNR gain by Cubero et al [32] has
0 0.01 0.02
〈
ω
〉
(a)
10−6 10−5 10−4 10−3
0 0.01 0.02
D
〈
ω
〉
(b)
3
2
1
3
2
1
FIG. 3: (Color online) Angular MSRs are shown as func-tions of internal noise intensityDfor different values of com-mon noise intensity: Line 1 (red) Dc = 0 , line 2 (green)
Dc= 0.00001, line 3 (blue) Dc = 0.00002. The dashed lines correspond to theoretical curves, calculated using expression (9). Figures (a) and (b) correspond to an array withN = 500 andN = 50 respectively. Other parameters are specified in the caption of Fig. 2.
been demonstrated when noise in the external signal is absent, i.e. without common noiseDc= 0.
It is clear (Fig. 2) that there is no direct relation be-tween the synchronization and SNR gain, since the gain is observed when there is no synchronization (⟨ω⟩ ̸= Ω). So it is problematic to use SNR as an indicator of the efficiency of information transmission by spike trains.
The role of common noise is illustrated in Fig.3. The noise leads to a decrease in the synchronization region. Note, that forDc = 0 the right hand boundary of the synchronization region can be estimated by calculation of the MSR using the following expression:
⟨ω⟩= Ω + 2πγ/4
[
1−∆r2
(
1−4tanh(γT /4) γT
)]
, (9)
where γ = r+(0) +r−(0), ∆r = [r−(0)−r+(0)]/γ and
the crossing rates are defined by the expressions:
r±(0) = 1 2πτ exp
(
−[±|∆U| −µ(0)]2τ
σ2(0)
)
; (10)
whereµ(0) = N[2n+(0)−1] and σ2(0) = 2N n+(0)[1−
n+(0)], and depend on the numberN of array elements.
The expression (9) is valid only for ⟨ω⟩ ≥ Ω; the first term in (9) reflects the fact thatµ(0)>∆U, whereas the second term is identical to the expression (70) derived in [40]. The correspondence between numerical results and curves defined by (9) becomes visible with increas-ingN, since the error of approximation of the Bernoulli distribution (7) by the continuous normal distribution decreases.
[image:4.595.63.291.48.408.2] [image:4.595.323.552.50.227.2]ba-0 0.01 0.02
D
〈
ω
〉
(a)
10−3 10−2 10−1
0 20 40
D
R
(b)
FIG. 4: (Color online) Results of simulations for an array of overdamped bistable oscillators. Angular MSR ⟨ω⟩ (a) and SNRR(b) are shown as functions of internal noise intensity
D. The parameters are Ω = 0.01, τ = 1/100,A = 0.2 and
Dc = 0.02. Markers▽ (blue lines) and⃝(red lines) corre-spond to an array ofN= 1 andN = 50 elements respectively. In figure (b) input SNRs are shown by the dashed (magenta) line (without internal noise, D = 0) and the solid (black) line (with internal noise,D̸= 0); output SNRs are shown by markers.
sic element. In Fig. 4, the simulation results for bistable overdamped oscillators are shown. In this case, the out-put x(t) of each element of the array is defined by the following equation:
˙
x−x+x3=F(t). (11)
The summing element was modified in comparison with the trigger case by using the limitation of amplitude of signal which acts on the end element: S(t) = tanh[π∑Ni Ui(t)], Ui = xi(t). To model both internal ξi(t) and commonξc(t) noise sources, color noiseξ(t) was used with correlation timeτ= 1/100:
˙ ξ+ 1
τξ=
√
2D
τ η(t), (12)
where η(t) is white Gaussian noise. Results (Fig.4) demonstrate both synchronization enhancement and SNR gain in the array of bistable oscillators.
III. EXCITABLE ARRAY
Finally, we checked the presence of effects in an ar-ray of excitable elements that have been modeled by the Fitzhugh Nagumo (FHN) system. The outputUi=u(t) of each excitable element obeys the equation:
˙
u=u−u
3
3 −v ˙
v=ϵ[u+a−F(t)], (13)
where u and v represent the membrane potential and slow recovery of a neuron respectively;ϵ ≪1 anda are
0 0.001
〈
ω
〉
(a)
0 10 20 30
D
R
(b)
0.05 0.1 0.15 0.2 0.25 0.3 0
0.5 1 1.5
D
Q
(c)
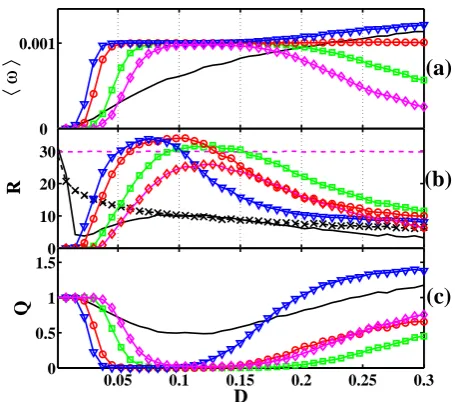
FIG. 5: (Color online) Results of simulations for FHN sys-tems. Angular MSR⟨ω⟩ (a), SNRR(b) and the total error
Q (c) are shown as functions of internal noise intensity D. The parameters are Ω = 0.001,τ = 1/100,ϵ= 0.001,a= 1.1,
A= 0.05 andDc= 0.002,N= 50. The solid (black) lines cor-respond to the output of one element. Markers corcor-respond to an array (N=50) with different values ofu0: ♢(magenta lines) u0 = 20, (green lines)u0 = 27.5,⃝ (red lines) u0 = 40, and ▽ (blue lines) u0 = 45. In figure (b) input SNRs are shown by the dashed (magenta) line (without internal noise,
D = 0) and by markers×(black line) (with internal noise,
D̸= 0).
parameters. Noise sourcesξc(t) and ξ(t) correspond to color noise (12) withτ = 1/100. The input information signal Fi(t) is modified to be close to the output of the FHN system. Fi(t) is a sequence of pulses with period T, amplitude A (Fi(t) is varying between 0 and −A) and pulse ratio 7 (for an array of triggers and bistable oscillators the pulse ratio is equal to 2). The summing element produces the output signal in the form
S(t) =−0.1
[
tanh
(
π N
∑
i=1
Ui(t) +u0
)
+ 1
]
,
where Ui(t) = ui(t). The signal S(t) is limited to the range [0:-0.2] similar to the signalFi(t). The parameter u0 defines the zero level of the sum of the output
sig-nals. Such a configuration with the summing element∑ having the limitation of an output amplitude and vari-able mean level reflects the dynamics of the membrane potential of neurons [33].
Since the stationary state of the FHN system (13) cor-responds to u = −a, then the u0 = −aN/2 defines a
symmetrical output signalS(t). The signalS(t) acts on the end elementTSmodeled by the FHN system too. The threshold value of signal amplitude isA≈0.1 for given T = 2000π. Results of the simulations for N = 50 and different values of parameter u0 are presented in Fig.5.
[image:5.595.326.554.49.250.2] [image:5.595.65.293.51.203.2]trig-gers and bistable oscillators considered above since the FHN system has only one threshold.
In general, the results (Fig. 5) support the conclusion derived from the analysis of triggers and bistable oscil-lators arrays. However, some differences can be seen. Firstly, the synchronization regime does not occur in one element, whereas an array is able toinduce synchroniza-tion. Secondly, parameter u0 changes significantly the
behavior of MSR⟨ω⟩and it is difficult to estimate the ef-ficiency of signal processing by using MSR only, because of the presence of only one threshold. Therefore the total errorQfor pulse detection [37] was also calculated:
Q=Pm+ Pf
n , (14)
wherePm= 1−Pc/nis the fraction of missed pulses,Pc is the number of correctly detected pulses and n is the total number of pulses;Pf is the number of false positive events, i.e. incorrectly detected pulses. We consider that the pulse is being correctly detected if it follows an input spike. We used the time interval 2∆T (here ∆T is the pulse duration of signalFi(t)) after the beginning of the input pulse as the time interval of correct detection.
The total error Q for different values of u0 is shown
in Fig. 5 (c). The use of an array can provide error-free signal transmission, and parameter u0 is an additional
one that can be used for transmission optimization. For example, if an arrayis able to estimate the intensity D of internal noises, then by changingu0 the
synchroniza-tion region can be significantly increased [one can start with u0 = 45 and switch to u0 = 27.5 for D >0.1, see
Fig. 5 (c)].
IV. CONCLUSIONS
Summarizing, it has been demonstrated that the non-linear regime of signal transformation can be optimized for signal processing. Extension of the synchronization region by increasing the size of bistable systems array (triggers and bistable oscillators) has been observed. Ar-ray inducing synchronization in the case of excitable sys-tems has been demonstrated. It has been shown the-oretically that in the absence of common noise, i.e. a noise-free input signal, that the synchronization region can be arbitrarily extended by increasing the number of bistable elements. The synchronization region decreases with an increase of the intensity of common noise. Also, array induced SNR gain has been demonstrated. For all considered cases the output value ofRexceeds its input value in a certain range of internal noise intensity. It has been shown that the presence of the gain does not un-ambiguously mean an optimal signal transmission. The analysis has revealed some differences between bistable and excitable dynamics and showed evidence that the use of an array leads to a significant decrease of error transmission in comparison with a single system. Let us
stress that all results were obtained for an array of uncou-pled elements. It is reasonable to expect the extension of the results to arrays with couplings between elements, although differences might also appear.
V. ACKNOWLEDGMENTS
The author thankfully acknowledges L. Schimansky-Geier for fruitful, continuing collaboration and encour-agement with the most valuable discussions. The author thanks N. Khovanova, A. McCafferty and R. Haley for critical reading of the manuscript, and referees for use-ful comments and the suggestion to provide details of numerical simulations. The research was supported by the Engineering and Physical Sciences Research Council (UK) and partially by Alexander-von-Humboldt Founda-tion.
APPENDIX A
For completeness, here we provide details of numerical simulations of the Langevin equations (2), (11), (12) and (13), and calculations of spectra and MSR⟨ω⟩.
The equations were presented in the normal form as a set of one-dimensional differential equations:
˙
xi=Zi(x) +σiηi(t), (A1)
wherex(t) is the vector of dynamical variables,Zi rep-resent the deterministic parts of the equations, ηi(t) is a white noise source with ⟨η(t)⟩ = 0 and ⟨η(t)η(s)⟩ = δ(t−s), andσiis noise amplitude. In the numerical sim-ulations the Heun integration scheme was used as follows [43]:
˜
xi(tj+1) = xi(tj) +hZi(x(tj)) +σi
√
hGi(tj)
(A2)
xi(tj+1) = xi(tj) + h
2[Zi(x(tj)) +Zi(˜x(tj+1))] + σi
√
hGi(tj),
where his the time step, tj+1 = tj+h, and Gi(tj) are the Gaussian (normal) random numbers with zero mean and unit dispersion (ifσi was equal to zero then the cor-responding stochastic term was excluded from the equa-tion). The Box-Muller algorithm [44] was used to gen-erateGi(tj). An independent random number generator with an independent initialization was used for each noise source ηi(t). The time step was chosen as h = T /2n, where T is the period of the pulses sequence and n is an integer number. The following values ofnwere used: n = 17 for bistable arrays of triggers and overdamped bistable oscillators, andn= 21 for an array of FHN sys-tems.
The difference scheme used for equation (1) is given by
The power spectrum P(ω) was calculated by the periodogram method with a rectangular time win-dow, and signal amplitude spectrum X(ω) was calcu-lated by the base-2 fast Fourier transform: P(ωj) = (N1)∑Nk=1Xk2(ωj), whereN = 200 is the number of pe-riodograms. Each periodogram was calculated from ran-dom initial conditions after skipping a relaxation time. The length of the periodogram was equal to L= 65536 points and the time sampling interval was ∆t = 2mh, where mis an integer (m= 6 for arrays of triggers and bistable overdamped oscillators andm= 10 for array of FHN systems). These chooses of the sampling interval ∆t and time steph=T /2n provide the absence of the leak-age effect for a periodic signal of frequency Ω = 2π/T, i.e. one frequency bin ∆ωcontains all the power of signal harmonics ω = lΩ, where l = 1,2. . .. To avoid alias-ing, a low-frequency linear filter with cut-off frequency α=π/(2∆t) was used of the form:
˙
xf =−αxf+αx. (A4)
The filter outputxf(t) was used for the spectrum calcula-tion, whereasx(t) corresponds to the considered signals. These can be the output of an array unitUi(t), the out-put of arrayUout(t), or the input signalFi(t)+ξc(t)+ξi(t) with orFi(t) +ξc(t) without internal noise.
As follows from [38, 39], the output signalsUi(t) and Uout(t) consist of periodic and noisy components. The periodic component corresponds to the informational sig-nal Fi(t) and contains discrete constituents P(kΩ) = Skδ(ω−kΩ), wherek is an integer number, i.e. it con-tains harmonics of frequency Ω. The spectrum calcula-tion methos described above defines the weight ofδ-peak on the frequency Ω asSi(Ω) =P(Ω).
Following [1, 2, 30] the noise componentSn(Ω) was es-timated using the power spectrumP(Ω) in the following way
Sn(Ω) = ∆ω 1 2m
j∑=i+l
j=i−l,j̸=i P(ωj)
, (A5)
where ∆ω= 2π/(L∆t) is the frequency resolution in the numerically calculated power spectrum P(ωj); ωi = Ω andl= 6 defines a bandwidth to approximate the noise background at signal frequency Ω.
Note that the inputRallows verification of the results of numerical simulations, since the inputRfor a periodic sequence of rectangular pulses Fi(t) can be calculated directly as
R= 10 log10
A2
2(Dc+D)∆ω
. (A6)
For the parameters given above the error of SNR calcu-lations is less than 1 dB, i.e. it is comparable with size of the markers in the figures.
For the calculation of MSR ⟨ω⟩, time intervals ∆tj = tj −tj−1 between two successive transitions from the
given state to another state (for bistable arrays) and be-tween two successive spikes (for an excitable array) were determined in parallel to periodogram calculations. To determine the transition momenttjthe outputx(t) of the bistable oscillator (11) was additionally filtered by a sym-metrical trigger with thresholds ∆U =±0.5 to produce a dichotomous (two-state) signalxd(t) confined to the val-ues±|xm|only, wherexm= 1. Similar filtering was used for the outputu(t) of the FHN system. MSR was deter-mined as ⟨ω⟩ = 2π/⟨∆t⟩, where ⟨∆t⟩ = (M1)∑Mj=1∆tj andM is the number of transitions (spikes) during the simulation time. The simulation time was always larger than 5000 periodsT of the information componentFi(t).
[1] L. Gammaitoni, P. H¨anggi, P. Jung, and F. Marchesoni, Rev. Mod. Phys. 70, 223 (1998).
[2] V. S. Anishchenko, A. B. Neiman, F. Moss, and L. Schimansky-Geier, Phys. Usp.42, 7 (1999).
[3] R. Benzi, A. Sutera, and A. Vulpiani, J. Phys. A: Math. Gen. 14, L453 (1981).
[4] C. Nicolis, Tellus34, 1 (1982).
[5] A. Destexhe, and D. Contreras, Science314, 85 (2006). [6] J. J. Collins, C. C. Chow, A. C. Capela, and T. T. Imhoff,
Phys. Rev. E54, 5575 (1996).
[7] J. F. Lindner, B. K. Meadows, W. L. Ditto, M. E. In-chiosa, and A. R. Bulsara, Phys. Rev. Lett.75, 3 (1995). [8] M. E. Inchiosa, and A. R. Bulsara, Phys. Rev. E 53,
R2021 (1996).
[9] U. Siewert, and L. Schimansky-Geier, Phys. Rev. E58, 2843 (1998).
[10] J. J. Collins, C. C. Chow, and T. T. Imhoff, Nature (Lon-don)376, 236 (1995).
[11] P. C. Gailey, A. Neiman, J. J. Collins, and F. Moss, Phys. Rev. Lett.79, 4701 (1997).
[12] D. R. Chialvo, A. Longtin, and J. M¨uller-Gerking, Phys. Rev. E55, 1798 (1997).
[13] N. G. Stocks, Phys. Rev. Lett.84, 2310 (2000); N. G. Stocks, and R. Mannella, Phys. Rev. E 64, 030902(R) (2001); D. Rousseau, F. Duan, and F. Chapeau-Blondeau, Phys. Rev. E68, 031107 (2003); A. Nikitin, N. G. Stocks, and R. P. Morse, Phys. Rev. E75, 021121 (2007).
[14] A.-H. Sato, M. Ueda, and T. Munakata, Phys. Rev. E 70, 021106 (2004).
[16] F. Rieke, D. Warland, R. de Ruyter van Steveninck, and W. Bialek, Spikes: Exploring the Neural Code (Cam-bridge, Massachusetts: The MIT Press; 1999).
[17] R. Bartussek, P.H¨anggi, and P. Jung, Phys. Rev. E49, 3930 (1994).
[18] A. Neiman, in Stochastic Processes in Physics, Chem-istry, and Biology, Edited by J.A. Freund and T. Poeschel (Springer, Berlin, 2000) p. 190.
[19] B. Shulgin, A. Neiman, and V. Anishchenko, Phys. Rev. Lett.75, 4157 (1995).
[20] K. Loerincz, Z. Gingl, and L. B. Kiss, Phys. Lett. A224, 63 (1996).
[21] I. A. Khovanov, and V. S. Anischenko, inApplied Non-linear Dynamics and Stochastic Systems Near the Millen-nium, edited by J.B. Kadtke and A. Bulsara, AIP Conf. Proc. 411 (AIP, Woodbury, New York, 1997) p. 267. [22] J. A. Freund, A. B. Neiman, and L. Schimansky-Geier,
Europhys. Lett.50, 8 (2000).
[23] R. Rozenfeld, J. A. Freund, A. B. Neiman, and L. Schimansky-Geier, Phys. Rev. E64, 051107 (2001). [24] J. Casado-Pascual et al, Phys. Rev. E71, 011101 (2005). [25] I. A. Khovanov, and P. V. E. McClintock, Phys. Rev. E
76, 031122 (2007).
[26] A. Neiman, L. Schimansky-Geier, F. Moss, B. Shulgin, and J. J. Collins, Phys. Rev. E60, 284 (1999).
[27] S. Bahar, A. Neiman, L. A. Wilkens, and F. Moss, Phys. Rev. E 65, 050901(R) (2002).
[28] V. Anishchenko, A. Neiman, A. Astakhov, T. Vadi-vasova, and L. Schimansky-Geier,Chaotic and Stochastic Processes in Dynamical Systems, Springer-Series on Syn-ergetics (Springer, Berlin, 2002).
[29] Z. Gingl, P. Makra, and R. Vajtai, Fluct. Noise Lett.1, L181 (2001).
[30] J. Casado-Pascual, J. G´omez-Ord´o˜nez, M. Morillo, and P. H¨anggi, Phys. Rev Lett.91, 210601 (2003).
[31] I. A. Khovanov, and P. V. E. McClintock, Phys. Rev. E 67, 043901 (2003).
[32] D. Cubero, J. Casado-Pascual, J. G´omez-Ord´o˜nez, J. M. Casado, and M. Morillo, Phys. Rev. E75, 062102 (2007). [33] P. Poirazi, T. Brannon, and B. W. Mel, Neuron37, 989
(2003).
[34] D. Durstewitz, and J. K. Seaman, Neuroscience139, 119 (2006); A. A. Koulakov, S. Raghavachari, A. Kepecs, and J. E. Lisman, Nat. Neurosc.5, 775 (2002).
[35] P. Jung, Phys. Rev E 50, 2513 (1994); P. Jung, A. Neiman, M. K. N. Afghan, S. Nadkarni, and G. Ullah, New J. Phys.7, 17 (2005).
[36] H. van Trees,Detection, Estimation and Modulation The-ory(Wiley, New York, 1978).
[37] G. Wenning, T. Hoch, and K. Obermayer, Phys. Rev. E 71, 021902 (2005).
[38] R. L. Stratonovich, Topics in theory of random noise (New-York: Gordon and Breach, 1963).
[39] P. Jung, Phys. Rep.234, 175 (1993).
[40] J. Casado-Pascual et al, Phys. Rev. E71, 011101 (2005). [41] B. McNamara, and K. Wiesenfeld, Phys. Rev. A39, 4854
(1989).
[42] W. Feller,An Introduction to Probability Theory and its Applications(New York : John Wiley & Sons, 1968). [43] P. E. Kloeden, and E. Platen, Numerical solution of
stochastic differential equations(Springer-Verlag, Berlin, 1992).