warwick.ac.uk/lib-publications
A Thesis Submitted for the Degree of PhD at the University of Warwick
Permanent WRAP URL:
http://wrap.warwick.ac.uk/101139
Copyright and reuse:
This thesis is made available online and is protected by original copyright. Please scroll down to view the document itself.
Please refer to the repository record for this item for information to help you to cite it. Our policy information is available from the repository home page.
Snoring: A Flow-Structure Interaction
by
Richard Martyn Howell
A thesis submitted in partial fulfilment of the requirements
for the degree of
Doctor of Philosophy in Engineering
University of Warwick, School of Engineering
Fluid Dynamics Research Centre
Contents
Contents i
List of Figures xv
List of Tables xvi
Acknowledgments xvii
Declaration xviii
Abstract xix
Nomenclature xxi
1 Introduction 1
1.1 Overview . . . 1
1.2 The Snoring Phenomenon . . . 5
1.2.1 The Upper Airway . . . 5
1.2.2 Pathophysiology of Snoring . . . 5
1.2.3 Acoustic Properties of Snores . . . 8
1.2.4 Pathology of Snoring . . . 9
1.2.5 Treatment of Snoring . . . 11
1.2.6 Models of the Snoring Phenomenon . . . 12
1.3 Summary . . . 13
2 Literature Review 14
2.1 Flow-Induced Structural Instabilities . . . 14
2.1.1 Flapping Flags . . . 16
2.1.2 Flutter and Divergence . . . 18
2.2 Flexible Surfaces in an Unbounded Flow . . . 19
2.3 Flexible Surfaces in a Channel Flow . . . 25
2.4 Motivation . . . 28
3 Theory 32 3.1 The Flexible Surface Model . . . 32
3.1.1 General Formulation . . . 34
3.1.2 Boundary Conditions . . . 35
3.1.3 Natural Frequencies . . . 36
3.2 The Velocity Model . . . 38
3.2.1 General Formulation . . . 38
3.2.2 Application to Present Geometry . . . 43
3.3 The Vorticity Model . . . 48
3.3.1 General Formulation . . . 48
3.3.2 Present Model . . . 50
3.4 The Unsteady Model . . . 52
3.4.1 Statement of the Unsteady Pressure Equation . . . 52
3.4.2 Tangential Perturbation-Velocity Calculation . . . 52
3.4.3 Unsteady Velocity-Potential Calculation . . . 53
3.4.4 Pressure Components . . . 56
3.4.5 Computational Model Formulation . . . 57
3.5 Fluid-Structure Phenomena . . . 59
3.6 Non-Dimensional Ratios. . . 61
4 Validation of the Computational Model 63 4.1 Flexible Surface Model Validation . . . 64
4.2 Velocity Model Validation . . . 71
4.2.1 Absence of Rigid Walls . . . 71
4.2.2 Rigid Walls Close to the Central Surface . . . 73
4.3 Vorticity Model Validation . . . 80
4.4 Unsteady Model Validation . . . 83
4.4.1 Joint Velocity-Flexible Surface Model . . . 83
4.4.2 The Steady State . . . 86
4.4.3 Numerical Experiment Setup . . . 89
4.5 Summary . . . 91
5 Numerical Experiments 92 5.1 Fluid-Structure Phenomena at ¯L= 1 . . . 92
5.1.1 Isolated Flexible-Surface . . . 93
5.1.2 Effect of Unsteady Model Variations . . . 103
5.2 Snore Modelling . . . 114
5.2.1 Physical Properties & Dynamics of the Upper Airway . . . 114
5.2.2 Potential Snores . . . 116
5.2.3 Snore Treatment . . . 122
5.3 Further Fluid-Structure Phenomena . . . 124
5.3.1 L¯ = 0.001 to ¯L= 1000 . . . 124
5.3.2 Further Applications . . . 136
6 Conclusions 137 6.1 Thesis Concept and Motivation . . . 137
6.2 Summary of Main Results & Conclusions . . . 139
6.3 Further Research Recommendations . . . 141
6.3.1 Unsteady Model Development . . . 141
6.3.2 Future Research Direction . . . 142
References 144
A Medical Information ii
A.1 The Upper Airway . . . ii
A.1.1 Passage of Air . . . ii
A.1.2 Bone & Tissue Structure . . . iii
A.1.3 Upper Airway Functions . . . iv
A.2 The Palate . . . v
A.2.1 Musculature . . . vii
A.2.2 Blood Supply . . . viii
A.2.3 Nervous System . . . viii
A.3 Glossary of Medical Terms . . . ix
B Equation Derivations xii B.1 Perturbation-Velocity Influence-Coefficients . . . xii
B.1.1 General Influence-Coefficients . . . xiv
B.1.2 Self-Induced Panel Influence-Coefficients . . . xvii
B.1.3 Y Y = 0 Influence-Coefficients . . . xx
B.1.4 Normal and Tangential Influence-Coefficients . . . xxii
B.2 Velocity-Potential Influence-Coefficients . . . xxiii
B.2.1 General Influence-Coefficients . . . xxiii
B.2.2 Self-Induced Panel Influence-Coefficients . . . xxvi
B.2.3 Y Y = 0 Influence-Coefficients . . . xxviii
B.3 Derivation of XX and YY . . . xxix
B.4 The Unsteady Model . . . xxxi
B.4.1 Unsteady Pressure Equation . . . xxxi
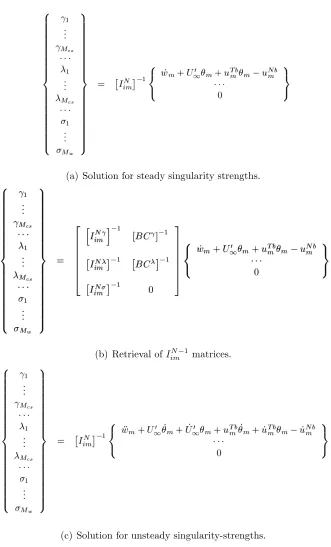
B.4.2 Steady Singularity Strengths . . . xxxiii
B.4.3 Unsteady Singularity Strengths . . . xxxiv
B.5 Divergence & Flutter Speeds . . . xxxvi
B.6 Validation of the Hydrodynamic Inertia Term . . . xxxviii
C Additional Material xl
List of Figures
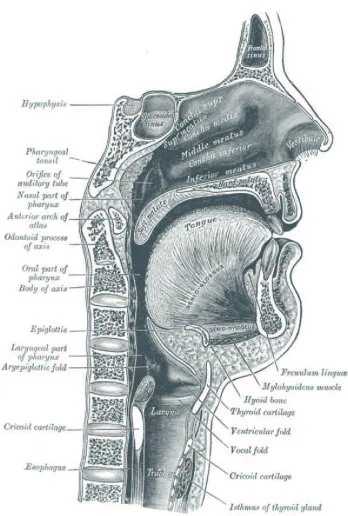
1.1 Saggital view of the human skull and neck (from Gray (1936)). . . 3
1.2 The flow-structure geometry of interest in this thesis. . . 4
1.3 Pathophysiology of snoring. . . 6
2.1 Local buckling in the skin of a delphinidae (top photograph) and a homo sapiens (bottom photograph) (both adapted from Aleyev (1977)). . . 21
2.2 Ejection of vortices from bodies in a free-stream flow: (a) a stationary cylinder; (b) a swimming fish; (c) a thread (adapted from Huber (2000)). 29 3.1 Flow-structure system and co-ordinate axes. . . 33
3.2 Flexible surface discretisation. . . 33
3.3 First six natural eigenmodes of vibration for a cantilevered free plate; two hundred flexible-surface mass-points. . . 37
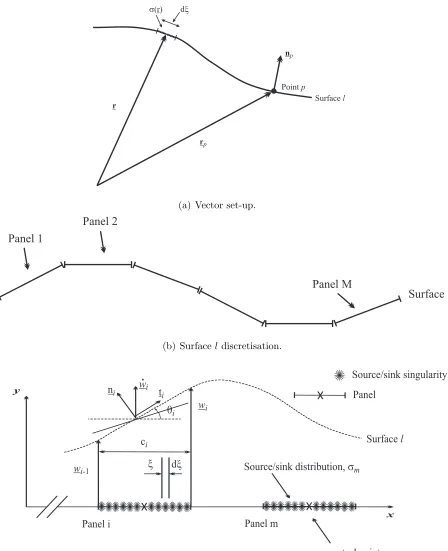
3.4 Panel method definitions. . . 42
3.5 Application of panel method to present geometry. . . 46
3.6 Execution of the panel method. . . 47
3.7 Discrete-vortex method set-up. . . 51
3.8 Execution of the unsteady model. . . 55
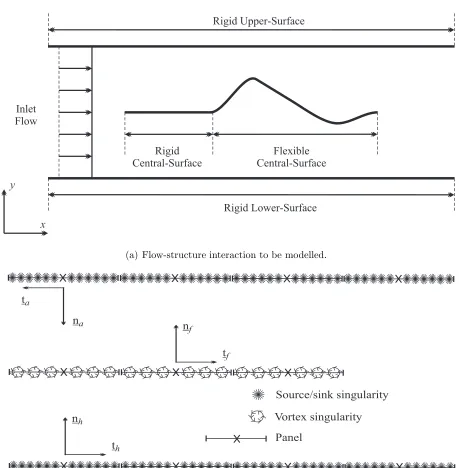
4.1 The flow-structure geometry modelled. . . 66
4.2 Flexible surface discretisation. . . 66
4.3 First six natural eigenmodes of vibration for a cantilevered free flexible surface; two-hundred mass-points. . . 67
4.4 Flexible-surface oscillationsin vacuowhen initial deflection is of the form
of one of the first six eigenmodes of vibration for a cantilevered-free plate;
two-hundred mass-points. . . 68
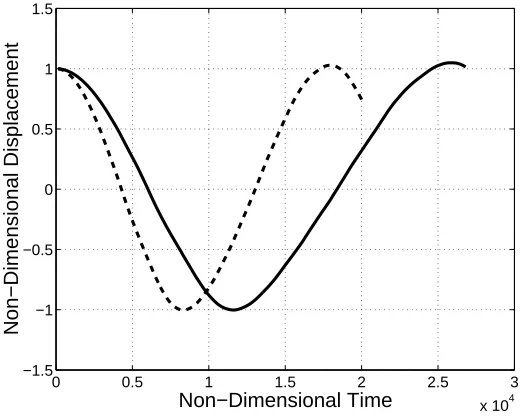
4.5 Displacement in vacuo of mass-point 140 in time; initial deflection is the
fourth eigenmode, two-hundred mass-points. . . 69
4.6 Displacement of mass-point 15 in time; fifty mass-points: (a)in vacuo,
ini-tial deflection is the second eigenmode; (b)in vacuowithd= 0.05 kg/sm2,
initial deflection is the second eigenmode; (c) d = 0.05 kg/sm2, δp =
5×10⁻⁸
N/m2, initial deflection is the second eigenmode; (d) in vacuo;
initial deflection is a sinusoidal wave, w(x) = Asin (6πx/L) where A =
0.00001L . . . 70
4.7 Application of panel method to the flow-structure geometry. . . 75
4.8 Validation of the prediction of the hydrodynamic stiffness component of
the pressure by the velocity model: (a) Initial deflection; (b) Steady
pres-sure distribution: − velocity model, - - model of Lucey and Carpenter (1992a); ¯L= 738, U¯ = 5.51×10⁻²
, two-hundred panels. . . 75
4.9 NACA 2412 Aerofoil (central line is the chord line). . . 76
4.10 Square of velocity calculated over NACA 2412 aerofoil using current
veloc-ity model (values plotted are those at panel control points);ρf = 1 kg/m3,
U∞ = 1 m/s, one-hundred panels. . . 76
4.11 Non-dimensional pressure distributions for first three natural eigenmodes
of vibration for a cantilevered-free flexible surface; ¯L = 1, U¯ = 1,
two-hundred panels. . . 77
4.12 Effect on non-dimensional pressure distribution of rigid central-surface at
leading edge of flexible surface deflected as the second eigenmode: (a)
ini-tial deflection; (b) pressure distribution: −rigid central surface included, - - rigid central surface absent; ¯L= 1, U¯ = 1, 50 flexible-surface panels. . 78
4.13 Effect of flexible surface discretisation on the second eigenmode
non-dimensional pressure distribution: (a) initial deflection; (b) pressure
4.14 Effect of channel wall proximity on the non-dimensional pressure
distri-bution along the flexible-surface deflected as the fourth-eigenmode: (a)
initial deflection; (b) pressure distribution: x ¯H = 10, - ¯H = 1, * ¯H = 0.1; ¯
L= 1, U¯ = 1. . . 79
4.15 Effect of channel wall discretisation on the non-dimensional pressure
dis-tribution along the flexible-surface deflected as the fourth-eigenmode: (a)
initial deflection; (b) pressure distribution: − 150 panels, * 50 panels, x 10 panels, o 5 panels; ¯L= 1000, ¯U = 1, ¯H = 0.1. . . 79
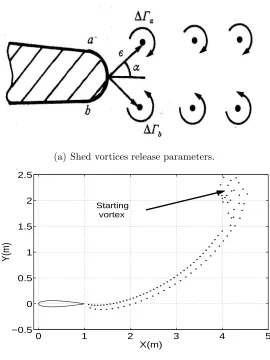
4.16 The figure shown in (a) is adapted from Lewis (1991). In (b), the wake
behind a NACA 0012 aerofoil at 20oangle of attack is modelled, each circle
representing a vortex blob; parameters were: U∞ = 1 m/s, chord length
= 1 m, release parameters were = 5% of chord length andα= 30o, core
size αb = 3
×10−4
m, 50 time steps, δt= 0.1 s. . . 81
4.17 Figure illustrating the effect of modifying blob physical parameters on the
position of blobs of vorticity after being ejected from a two-dimensional
jet at different time steps: ∗ 50 time steps, x 100 time steps, + 150 time steps, ◦ 200 time steps, / 250 time steps; fifty blob pairs, blob strength (unless otherwise specified) = 1 s−1
, core size (unless otherwise specified)
= 0.5 m, initial blob pair vertical spacing = 1 m, δt = 0.01 s, positions
calculated using a predictor-corrector method. . . 82
4.18 Validation of the prediction of the hydrodynamic inertia component of
the pressure by the unsteady model, oscillation of mass point at 0.48L: − present model, −− Lucey and Carpenter (1992a); ¯L = 738, U¯ = 5.51× 10⁻²
, two-hundred mass points. . . 85
4.19 Validation of the prediction of the hydrodynamic damping component of
the pressure by the unsteady model, oscillation of entire flexible surface:
−initial deflection,−−deflection after 0.01 s; ¯L= 738, U¯ = 5.51×10⁻² ,
two-hundred mass points. . . 85
4.20 Fluid-structure behaviour at critical velocity where (a) and (c) depict the
oscillation of the flexible surface (the thick line is the initial deflection)
and (b) and (d) are the respective total energies expended: in (a) and (b), ¯
U = 5.452, second eigenmode initial deflection; in (c) and (d), ¯U = 5.452,
first eigenmode initial deflection; fifty mass points, ¯L= 1. . . 87
4.21 Fluid-structure behaviour at critical velocity where (a) and (c) depict the
oscillation of the flexible surface (the thick line is the initial deflection)
and (b) and (d) are the respective total energies expended: in (a) and
(b), ¯U = 5.452; in (c) and (d), ¯U = 22; ¯L= 1, two-hundred mass points,
initial deflection is the sixth eigenmode. . . 88
4.22 Fluid-structure behaviour at critical velocity where (a) and (c) depict the
oscillation of the flexible surface (the thick line is the initial deflection)
and (b) and (d) are the respective total energies expended: in (a) and (b), ¯
U = 5.452, fifty mass points; in (c) and (d), ¯U = 5.452, two-hundred mass
points; ¯L= 1, initial deflection is the second eigenmode. . . 90
5.1 Fluid-structure behaviour where (a) and (c) depict the oscillation of the
flexible surface (the thick line is the initial deflection) and (b) and (d) are
the respective total energies expended: in (a) and (b), ¯U = 0.0; in (c) and
(d), ¯U = 0.28; ¯L = 1, ¯H = 1, fifty mass points, initial deflection is the
second eigenmode. . . 96
5.2 Total fluid work done on the whole flexible surface and also on its upstream
and downstream halves over a period of several oscillations: −(thin) total fluid work done on upstream half of plate (Rtp
0 W˙u(t)dt), −− total fluid
work done on downstream half of plate (Rtp
0 W˙d(t)dt),−(thick) total fluid
work done (Rtp
0 ( ˙Wu(t) + ˙Wd(t))dt); ¯U = 0.28, ¯L = 1, ¯H = 1, fifty mass
points, initial deflection is the second eigenmode. . . 97
5.3 Values of non-dimensional flexible-surface velocity and fluid pressure in
time at selected mass-points along the flexible-surface length: ◦ pressure value, ∗ flexible-surface velocity value; (a) mass-point values at 0.3L, (b) mass-point values at 0.5L, (c) mass-point values at 0.7L; ¯U = 0.28, ¯L= 1,
¯
H= 1, fifty mass points, initial deflection is the second eigenmode. . . . 98
5.4 Fluid-structure behaviour where (a) and (c) depict the oscillation of the
flexible surface (the thick line is the initial deflection) and (b) and (d) are
the respective total energies expended: in (a) and (b), ¯U = 2.75; in (c)
and (d), ¯U = 5.452; ¯L= 1, ¯H = 1, fifty mass points, initial deflection is
the second eigenmode. . . 99
5.5 Fluid-structure behaviour where (a) depicts the oscillation of the flexible
surface (the thick line is the initial deflection) and (b) is the total energy
expended: ¯U = 5.51, ¯L= 1, ¯H = 1, fifty mass points, initial deflection is
the second eigenmode. . . 100
5.6 Total fluid work done on the whole flexible surface and its upstream and
downstream halves over a period of several oscillations: −(thin) work done on upstream half of plate (Rtp
0 W˙u(t)dt),−−work done on downstream half
of plate (Rtp
0 W˙d(t)dt), −(thick) total work done (
Rtp
0 ( ˙Wu(t) + ˙Wd(t))dt);
(a) ¯U =Uc = 5.452, (b) ¯U = 6.0; ¯L= 1, ¯H = 1, fifty mass points, initial
deflection is the second eigenmode. . . 100
5.7 Values of non-dimensional flexible-surface velocity and fluid pressure in
time at selected mass-points along the flexible-surface length: ◦ pressure value, ∗ flexible-surface velocity value; (a) mass-point values at 0.3L, (b) mass-point values at 0.5L, (c) mass-point values at 0.7L; ¯U = 5.474,
¯
L= 1, ¯H = 1, fifty mass points, initial deflection is the second eigenmode. 101
5.8 Trend of non-dimensionalUc for range of ¯L. Note that Huang’s derivation
of ¯U is different to that presented in this thesis. In (a), G is growth rate
with G = 1 equivalent to the steady state. In (b), the line G = 1 is
replotted. . . 102
5.9 Fluid-structure behaviour at critical velocity where (a) is the total energy
expended and (b) is the total fluid work done on the whole flexible surface
and also on its upstream and downstream halves: −(thin) total fluid work done on upstream half of plate (Rtp
0 W˙u(t)dt), −− total fluid work done
on downstream half of plate (Rtp
0 W˙d(t)dt),−(thick) total fluid work done
(Rtp
0 ( ˙Wu(t) + ˙Wd(t))dt); ¯U = 5.452 with shed vorticity included, αm =
5.94 ×10⁻⁴
; ¯L = 1, fifty mass points, initial deflection is the second
eigenmode. . . 107
5.10 Fluid-structure behaviour where (a) depicts the oscillation of the flexible
surface (the thick line is the initial deflection) at the critical velocity and
(b) is the total fluid work done on the whole flexible surface and also on
its upstream and downstream halves: see figure 5.9 for description; in (a) ¯
U = 5.066; in (b) ¯U = 5.573; ¯L = 1, ¯H = 0.1, fifty mass points, initial
deflection is the second eigenmode. . . 107
5.11 Values of non-dimensional flexible-surface velocity and fluid pressure in
time at selected mass-points along the flexible-surface length: ◦ pressure value, ∗ flexible-surface velocity value; (a) mass-point values at 0.3L, (b) mass-point values at 0.5L, (c) mass-point values at 0.7L; ¯U = 5.086,
¯
L= 1, ¯H = 0.1, fifty mass points, initial deflection is the second eigenmode.108
5.12 Fluid-structure behaviour at critical velocity where (a) and (c) depict the
oscillation of the flexible surface (the thick line is the initial deflection;
early oscillations have been removed to provide a clearer view of the critical
modes) and (b) and (d) are the total fluid work done on the whole flexible
surface and also on its upstream and downstream halves: −(thin) total fluid work done on upstream half of plate (Rtp
0 W˙u(t)dt), −− total fluid
work done on downstream half of plate (Rtp
0 W˙d(t)dt),−(thick) total fluid
work done (Rtp
0 ( ˙Wu(t) + ˙Wd(t))dt); (a) and (b) ¯U = 13.22, ¯H = 1; (c) and
(d) ¯U = 12.28, ¯H = 0.1; ¯L = 1, rigid central-surface, fifty mass points,
initial deflection is the second eigenmode. . . 109
5.13 Values of non-dimensional flexible-surface velocity and fluid pressure in
time at selected mass-points along the flexible-surface length: ◦ pressure value, ∗ flexible-surface velocity value; (a) mass-point values at 0.3L, (b) mass-point values at 0.5L, (c) mass-point values at 0.7L; ¯U = 13.27,
¯
L= 1, ¯H = 1, rigid central-surface, fifty mass points, initial deflection is
the second eigenmode. . . 110
5.14 Values of non-dimensional flexible-surface velocity and fluid pressure in
time at selected mass-points along the flexible-surface length: ◦ pressure value, ∗ flexible-surface velocity value; (a) mass-point values at 0.3L, (b) mass-point values at 0.5L, (c) mass-point values at 0.7L; ¯U = 12.33,
¯
L= 1, ¯H = 0.1, rigid central-surface, fifty mass points, initial deflection
is the second eigenmode. . . 111
5.15 Effect of stiffness and damping distributions on the total work done by
the fluid on the flexible surface: −total fluid work done on flexible surface
W(tp) (=
Rtp
0 W˙ (t)dt), −− total energy dissipated by the flexible surface
D(tp) (=
Rtp
0 D˙(t)dt), × overall work done (=
Rtp
0 ( ˙W(t)−D˙(t))dt); (a)
Damping gradient (32d¯→ d¯where ¯d = 1), (b) Stiffness gradient (32B → B); ¯U = 6.058, ¯L = 1, fifty mass points, initial deflection is the second
eigenmode. . . 112
5.16 Plots of total energy against time showing the effect of unsteady mean
flow initiated at ¯t= 0.7; ¯L= 1, ¯H = 1, fifty mass points, initial deflection
is the second eigenmode. . . 113
5.17 Fluid-structure behaviour at critical velocity where (a) and (c) depict the
oscillation of the flexible surface (the thick line is the initial deflection)
and (b) and (d) are the total fluid work done on the whole flexible surface
and also on its upstream and downstream halves: −(thin) total fluid work done on upstream half of plate (Rtp
0 W˙u(t)dt), −− total fluid work done
on downstream half of plate (Rtp
0 W˙d(t)dt),−(thick) total fluid work done
(Rtp
0 ( ˙Wu(t) + ˙Wd(t))dt); (a) and (b) U∞ = 1.45 m/s, ¯H = 1; (c) and (d)
U∞ = 2.34 m/s, ¯H = 0.1; ¯L= 0.42, rigid central surface, fifty mass points,
initial deflection is the second eigenmode. . . 119
5.18 Snore 3 values of non-dimensional flexible-surface velocity and fluid
pres-sure in time at selected mass-points along the flexible-surface length: −− pressure value, − flexible-surface velocity value, (a) mass-point values at 0.3L, (b) mass-point values at 0.5L, (c) mass-point values at 0.7L;U∞
in-creases from zero to 3.675 m/s in one second (approximately one human
inhalation during sleep) with only the final 2% of the inhalation depicted, ¯
L= 0.42, ¯H = 0.1, rigid central surface, fifty mass points, initial deflection
is the second eigenmode. . . 120
5.19 Fluid-structure behaviour at critical velocity where (a) depicts the
oscilla-tion of the flexible surface (the thick line is the initial deflecoscilla-tion, −4and
−O are deflections at ¯t = 4.24 and 4.28 respectively) and (b) is the total fluid work done on the whole flexible surface and also on its upstream
and downstream halves: −(thin) total fluid work done on upstream half of plate (Rtp
0 W˙u(t)dt), −− total fluid work done on downstream half of
plate (Rtp
0 W˙d(t)dt),−(thick) total fluid work done (
Rtp
0 ( ˙Wu(t)+ ˙Wd(t))dt);
U∞ increases from zero to 3.675 m/s in one second (approximately one
human inhalation during sleep) with only the final 2% of the inhalation
depicted, ¯L= 0.42, ¯H = 0.1, rigid central surface, fifty mass points, initial
deflection is the second eigenmode. . . 121
5.20 Plots of total energy against time showing the effect of the variation
of flexible-surface stiffness on the stability of the steady state; U∞ =
2.34 m/s, ¯L = 0.42, ¯H = 0.1, rigid central surface, fifty mass points,
initial deflection is the second eigenmode. . . 123
5.21 Fluid-structure behaviour where (a) and (c) depict the oscillation of the
flexible surface (the thick line is the initial deflection) and (b) and (d) are
the respective total energies expended: in (a) and (b), ¯U = 0.0; in (c) and
(d), ¯U = 5.51×10⁻⁵
; ¯L= 1000, ¯H= 1, fifty mass points, initial deflection
is the second eigenmode. . . 127
5.22 Fluid-structure behaviour where (a) depicts the oscillation of the flexible
surface (the thick line is the initial deflection) and (b) is the respective
total energies expended: ¯U = 1.1×10⁻⁴
, ¯L = 1000, ¯H = 1, fifty mass
points, initial deflection is the second eigenmode. . . 128
5.23 Total fluid work done on the whole flexible surface and also on its upstream
and downstream halves: −(thin) total fluid work done on upstream half of plate (Rtp
0 W˙u(t)dt), −− total fluid work done on downstream half of
plate (Rtp
0 W˙d(t)dt),−(thick) total fluid work done (
Rtp
0 ( ˙Wu(t)+ ˙Wd(t))dt);
¯
U = 5.51×10⁻⁵
, ¯L= 1000, ¯H = 1, fifty mass points, initial deflection is
the second eigenmode. . . 128
5.24 Fluid-structure behaviour where (a) depicts the oscillation of the flexible
surface (the thick line is the initial deflection) and (b) is the respective
total energies expended: ¯U = 2.75×10⁻⁴
, ¯L = 1000, ¯H = 1, fifty mass
points, initial deflection is the second eigenmode. . . 129
5.25 Total fluid work done on the whole flexible surface and also on its upstream
and downstream halves: −(thin) total fluid work done on upstream half of plate (Rtp
0 W˙u(t)dt), −− total fluid work done on downstream half of
plate (Rtp
0 W˙d(t)dt),−(thick) total fluid work done (
Rtp
0 ( ˙Wu(t)+ ˙Wd(t))dt);
¯
U = 2.75×10⁻⁴
, ¯L= 1000, ¯H = 1, fifty mass points, initial deflection is
the second eigenmode. . . 129
5.26 Fluid-structure behaviour where (a) and (c) depict the oscillation of the
flexible surface (the thick line is the initial deflection) and (b) and (d) are
the respective total energies expended: in (a) and (b), ¯U = 5.51×10⁻⁴ ; in
(c) and (d), ¯U = 9.91×10⁻⁴
; ¯L= 1000, ¯H = 1, fifty mass points, initial
deflection is the second eigenmode. . . 130
5.27 Total fluid work done on the whole flexible surface and also on its upstream
and downstream halves: −(thin) total fluid work done on upstream half of plate (Rtp
0 W˙u(t)dt), −− total fluid work done on downstream half of
plate (Rtp
0 W˙d(t)dt),−(thick) total fluid work done (
Rtp
0 ( ˙Wu(t)+ ˙Wd(t))dt);
¯
U = 9.91×10⁻⁴
, ¯L= 1000, ¯H = 1, fifty mass points, initial deflection is
the second eigenmode. . . 131
5.28 Fluid-structure behaviour where (a) and (c) depict the oscillation of the
flexible surface (the thick line is the initial deflection) and (b) and (d) are
the respective total energies expended: in (a) and (b), ¯U = 1.49×10⁻³ ;
in (c) and (d), ¯U = 2.2×10⁻³
; ¯L= 1000, ¯H = 1, fifty mass points, initial
deflection is the second eigenmode. . . 132
5.29 Total fluid work done on the whole flexible surface and also on its upstream
and downstream halves: −(thin) total fluid work done on upstream half of plate (Rtp
0 W˙u(t)dt), −− total fluid work done on downstream half of
plate (Rtp
0 W˙d(t)dt),−(thick) total fluid work done (
Rtp
0 ( ˙Wu(t)+ ˙Wd(t))dt);
¯
U = 1.49×10⁻³
, ¯L= 1000, ¯H = 1, fifty mass points, initial deflection is
the second eigenmode. . . 133
5.30 Critical modes for different ¯L, where µ = ¯L−1
, from Watanabe et al.
(2002b). Modes were calculated via numerical experiment except for result
shown atµ= 0.37 which is an experimental result. . . 133
5.31 Fluid-structure behaviour where (a) and (c) depict the oscillation of the
flexible surface (the thick line is the initial deflection) and (b) and (d) are
the respective total energies expended: in (a) and (b), ¯U = 0.0; in (c)
and (d), ¯U = 1.04×10⁵; ¯H = 1, ¯L = 1×10⁻³
, fifty mass points, initial
deflection is the second eigenmode. . . 134
5.32 Uc at different ¯L, where Us∗ =UcL¯
3
2 and µ= ¯L−1. . . 135
A.1 Saggital view of the human skull and neck: (a) pharynx; (b) nasophar-ynx; (c) oropharnasophar-ynx; (d) laryngopharnasophar-ynx; (e) retropalatal segment; (f) retroglossal segment (from Amatoury (2004)). . . iii
A.2 Views of the human palate. . . vi
B.1 Set-up of the panel method. . . xiii
B.2 Calculation of the lengths XX and YY. . . xxx
C.1 Plot of Uc at different ¯L, including data from several published studies,
adapted from Watanabeet al.(2002b). Experimental Data: From
Watan-abe et al. (2002b) ◦ flag type paper, • long-type paper, 4 elastic sheet;
♦Huang (1995); + Korneckiet al. (1976); Theoretical Models: −(thick) Watanabe et al. (2002b) with CD = 0 (boundaries at the bottom of the
graph show the predominant eigenmodes in the form of the critical mode
calculated by this model);− (thin) Huang (1995);−.Guo and Pa¨ıdoussis (2000); 2 Kornecki et al. (1976); −− Present numerical model, different data-point markings on this line signify different predominant eigenmodes
in form of the critical mode: ∗ second eigenmode, 5 third eigenmode, × fourth eigenmode. . . xliii
List of Tables
4.1 Theoretical and calculated oscillation periods for in vacuo oscillations of
the first six eigenmodes for different discretisations;E = 7×10⁷N/m2, ρ=
2100 kg/m3, h= 5×10⁻⁴
m, andL= 1.355 m. . . 69
5.1 Values ofUc,f and ˙Et for observed flutter instabilities determined via
nu-merical experiment for flow-structure interaction of a cantilevered flexible
surface embedded in a potential flow for different unsteady model
varia-tions; ¯L= 1, fifty mass points, initial deflection was the second eigenmode. 104
5.2 Human soft-palate properties and those used for the flexible surface in
numerical experiments. . . 115
5.3 Values ofUcand its equivalent ¯U,fand ˙Etfor observed flutter instabilities
determined via numerical experiment for flow-structure interaction of a
cantilevered flexible surface embedded in a potential flow for different
unsteady model variations; ¯L = 0.42, fifty mass points, initial deflection
was the second eigenmode. . . 117
5.4 Values ofUc,f and ˙Et for observed flutter instabilities determined via
nu-merical experiment for flow-structure interaction of a cantilevered flexible
surface embedded in a potential flow for variations in ¯L; fifty mass points,
initial deflection was the second eigenmode. . . 124
Acknowledgments
“Centuries ago the Howeitat came from Hejaz, and their nomad clans prided themselves
on being true Bedu. Auda was their master type. His hospitality was sweeping; except to
very hungry souls, inconvenient. His generosity kept him always poor, despite the profits
of a hundred raids. He had married twenty-eight times, had been wounded thirteen times;
while the battles he provoked had seen all his tribesman hurt and most of his relations
killed. He himself had slain seventy-five men, Arabs, with his own hand in battle: and
never a man except in battle. Of the number of dead Turks he could give no account:
they did not register...Auda raided as often as he had opportunity, and as widely as he
could...and was careful to be at enmity with nearly all the tribes in the desert, that he
might have proper scope for raids...His patience in action was extreme: and he received
and ignored advice, criticism, or abuse, with a smile as constant as it was very
charm-ing.”Seven Pillars of Wisdom, T. E. Lawrence.
I would like to thank Professors Tony Lucey and Peter Carpenter for their unerring
support at the unspecified and numerous times when I have asked for their help and
advice. I would like to thank my parents for their unending aid through this turbulent
time in my life and resisting all my attempts to turn them into amateur snoring experts.
My peer group in the Ph.D office has seen many characters pass through in my time
here and I would like to thank them all for their almost infinite availability for beverage
and chat. I would like to thank the rest of my family and friends for the essential and
numerous excursions and distractions they have provided me with. Finally, I am very
grateful to the EPSRC for the four years funding they provided me with during the
course of this research.
Declaration
All investigations presented in this thesis are my own work except where specific
refer-ence has been made to the work of others. No part of this thesis has been submitted to
any other university for credit or award. Some of the work presented in this thesis has
been published in the following paper:
Howell, R. M., Lucey, A. D. & Carpenter, P. W. 2004 Numerical simulation of a
can-tilevered flexible plate embedded in an unbounded inviscid flow. In Proceedings of the
8th international conference on Flow-Induced Vibrations, Paris, France (edited by F.
Axisa and E. de Langre), pp:167-171.
Abstract
A novel method for calculating the linear fluid-structure interaction of a cantilevered
flexible surface centrally positioned in an ideal channel flow, incorporating the effects of
vorticity shed downstream, is described. The perturbation pressure is modelled using a
linearised boundary-element method. The flexible surface deflection is modelled using
linearised one-dimensional beam theory. The shed vorticity is modelled using a linearised
discrete vortex method. The computational model can therefore be used to conduct
numerical experiments where no presupposition of the flexible surface deflection is made.
This linear model can accurately capture the onset of instability in this fluid-structure
system. The flexible surface is infinitely thin; the upper and lower sides of the surface can
therefore be considered stream lines of the flow, with a step jump in pressure between
them across the surface. The discontinuity of tangential velocity across the flexible
surface generates lift. The flexible surface is therefore modelled by a distribution of
vortex singularities with a Kutta condition applied at the surface’s trailing edge. The
individual models of the flexible surface and the fluid velocity and vorticity, together with
the action of the individual hydrodynamic pressure components created when the models
are combined to form a single unsteady model, are validated via a series of numerical
experiments and by quantitative comparison with an appropriate, previously developed
computational model.
Unique, highly detailed investigations into the ideal fluid-structure phenomena
ob-served in numerical experiments conducted over a wide range of mass ratio and inlet
velocity are documented. For the first time, detailed numerical investigation of the
ef-fect on this fluid-structure interaction of channel walls, a rigid central surface (upstream
and adjacent to the flexible surface), unsteady mean flow, the variation of stiffness and
damping properties along the flexible surface and the vorticity shed at the trailing edge
of the flexible surface have been quantified. Calculations of the critical velocity show
good correlation with other published work and examples of the possible application
of the unsteady model to different physical fluid-structure phenomena are outlined. Of
central importance is the application of the unsteady model to the investigation of the
human snoring phenomenon. Further insight into the operation of two types of snore
is made and a new type of snore is discovered, incorporating the effects of inhalation.
The numerical experiments demonstrate that the location (on the flexible surface) of the
destabilising phase shift between the flexible surface velocity and fluid pressure leading to
instability change drastically for a small shift in mass ratio. Coupled with knowledge of
further snore mechanisms from other published work, these results show the uniqueness
of treatment required to provide effective surgical treatment to individual patients
suffer-ing from snorsuffer-ing; furthermore, this highlights the need for more realistic fluid-structure
models to be created.
Nomenclature
A Channel cross-sectional area (m2)
[A] Matrix used in solution of perturbation velocity in §3.4.2
B Flexural rigidity (Nm)
[B] Matrix used in solution of unsteady velocity potential in §3.4.3
c Wave speed of the flexible surface (m/s)
cf o Coefficient of fluid friction cm Length of panel m (m)
[C] Matrix used in solution of mass point acceleration in §3.4.5
δx Mass-point spacing (m)
d Damping coefficient (kg/sm2)
¯
d Non-dimensional damping coefficient (kg/sm2)
˙
D Dissipation rate of energy by the fluid (Nm)
[D] Matrix used in solution of zero-order vortex strengths in §3.4.5
E Elastic (Young’s) modulus (N/m2)
Ek Flexible surface kinetic energy (Nm) Es Flexible surface strain energy (Nm)
Et Total energy (Nm)
˙
Et Growth rate of fluid-structure instability (Nm/s) Ff Force of the fluid exerted on the flexible surface (N) Fp Restorative structural force of the flexible surface (N) h Flexible surface thickness (m)
H Half channel height (m)
¯
H Non-dimensional channel height
i Horizontal polar co-ordinate
Iim Influence coefficient (influence on ith panel owing tomth panel) j Vertical polar co-ordinate
l Wall/fluid interface
L Flexible surface length (m)
Lr Length scale (m)
¯
L Non-dimensional flexible surface length (mass ratio)
M Discretisation denoter (M panels, etc...)
n Unit normal vector (m)
Nb Number of vortex blobs p Surface pressure (N/m2)
Q Inspiratory volumetric flow rate (m3/s)
Re Reynolds number
t Time (s)
tr Time scale (s)
t Unit tangential vector (m)
u Total flow velocity (m/s)
u0
Total perturbation velocity (m/s) ¯
U Non-dimensional flow velocity
Uc Critical flow velocity (m/s) UD Divergence speed (m/s) UF Flutter speed (m/s)
U∞ Free stream flow-speed (m/s)
U∞ Free stream flow-velocity (m/s)
w Flexible surface displacement term (m)
w0 Initial deflection of flexible surface att = 0
wmax Maximum magnitude of deflection of flexible surface att = 0
˙
w Flexible surface speed term (m/s) ˙
w Flexible surface velocity term (m/s) ¨
w Flexible surface acceleration term (m/s2)
W Work done by the fluid on the flexible surface (Nm) ¯
W Non-dimensional work done by the fluid on the flexible surface ˙
W Rate of work done by the fluid on the flexible surface (Nm)
x Horizontal location (m)
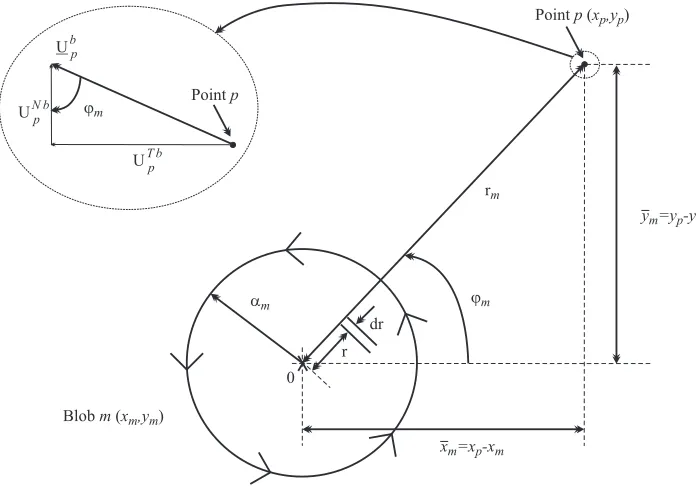
XX Horizontal distance between influencing point and point of influence (m)
y Vertical location (m)
Y Y Vertical distance between influencing point and point of influence (m)
α Vortex blob core size (m)
γ Zero-order vortex singularity strength
δ Denotes a small change in a property
ζ Vorticity in the free stream
θ Panel angle relative to horizontal (rad)
κ Wave-number (1/s)
λ First-order vortex singularity strength
ν Poisson ratio
ξ Horizontal co-ordinate (m)
π 3.141592654...
ρ Flexible surface density (kg/m3)
ρf Fluid density (kg/m3)
σ Zero-order source/sink singularity strength
φi Discretised velocity-perturbation potential
ϕ Angle between influencing point and point of influence (rad)
ψ Stream function
ω Angular frequency of oscillation (rad/s) / Vorticity field Γ Total vortex singularity strength
Φ Total velocity-perturbation potential
Superscripts
b Vortex blob property
D Downstream half of flexible surface
L Lower side of flexible surface
N Normal component
T Tanegential component
U Upper side of flexible surface / Upstream half of flexible surface 0
Perturbation / Transient property
Subscripts
b Vortex blob property
cs Central surface property
i Discretisation denoter (ith panel, etc...) m Discretisation denoter (mth panel, etc...)
p A point p being influenced
T E Trailing edge of the flexible surface
w Channel wall property
xp Across the flexible surface
Chapter 1
Introduction
1.1
Overview
“Now there was Jim (snoring), alarming the whole desert, and yanking the animals out,
for miles and miles around to see what in the nation was going on up there; there warn’t
nobody nor nothing that was as close to the noise as he was, and yet he was the only
cretur that wasn’t disturbed by it.” Tom Sawyer Abroad, Mark Twain (1894).
The snoring phenomenon: an unfortunate human side effect of evolution; no longer
a humorous affliction but a social pest and the precursor of more serious ailments and
their subsequent effects on our health. This thesis investigates the pathophysiology of the
snoring phenomenon via numerical simulation. Numerical experiments are conducted
us-ing a novel fluid-structure model that also provides insight into an area of fluid-structure
interactions that demands improved understanding.
Snoring occurs in the human upper airway, specifically in the human pharynx, see
fig-ure 1.1. The linear model developed in this thesis is used to conduct numerical
experi-ments on a simplified geometry of the pharynx (see figure 1.2) and utilises the linearised
theory of infinitely thin flexible-surfaces, ideal fluids and shed vorticity. Both the linear
flexible surface and fluid components of the model are spatially discretised and when
1.1 Overview 2
coupled (along with the vorticity model) into a single linearised unsteady model,
un-steady numerical-experiments can be conducted. A numerical model of this kind can
predict the onset of fluid-structure instabilities that are one route to the generation of
audible snores. The models are coded in FORTRAN77 and can be run on a standard
PC. All post processing of results was carried out in MATLAB. The separate flexible
surface and fluid components of the model are initially validated against well-established
results. However, when the components are coupled to produce the unsteady model, only
similar results from the published literature are available to compare with. The author
sets out a logical investigation into the validity of the unsteady model that suggests the
model is at least physically correct for the cases studied. Full validation would require
careful experimental work.
This study of snoring belongs to the field of bioengineering, combining (the knowledge
of) engineering and medicine. It is hoped that properly validated numerical models can
economise on expensive or highly complexin vivo experiments and be used to determine
correct treatment for individual patients. On a personal note, the author was surprised
at the extent of passion exhibited in the response of people who discovered he was
in-vestigating the snoring phenomenon. The number of offers of various family members,
friends and partners for study was unprecedented. Although humorous, this points to
the stressful effect snoring has on our everyday lives. It also highlights the dangerous
effect snoring may have on those who cannot escape the burden of a snorer when faced
with a stressful situation; for example, when astronauts are enclosed in a small space
for a considerable length of time (Balint and Lucey, 2003). The following section of
this chapter details current knowledge on the snoring phenomenon: its pathogenesis,
characteristics, side affects, treatments and published models. This information is used
in later chapters to set up suitable numerical experiments that investigate further the
1.1 Overview 3
1.1 Overview 4
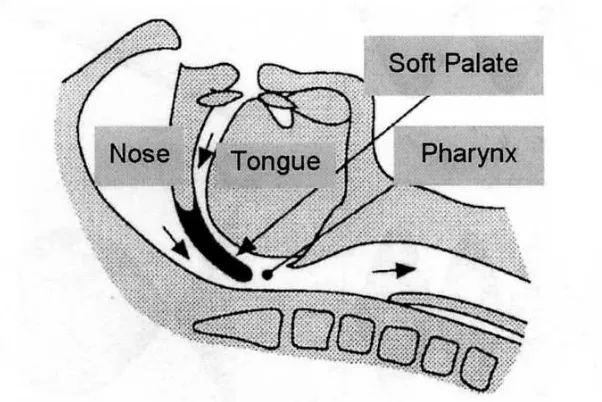
(a) The human upper-airway (adapted from Aur´egan and Depollier
(1995)).
Inlet Flow
Rigid Central-Surface
Flexible Central-Surface
Rigid Lower-Surface Rigid Upper-Surface
y
x
[image:29.612.157.458.155.356.2](b) Simplification of pharynx to be modelled numerically.
1.2 The Snoring Phenomenon 5
1.2
The Snoring Phenomenon
1.2.1
The Upper Airway
The upper airway, see figure 1.1, extends from the external entrance of the nares and
oral cavity to the junction between the oesophagus and the tracheal airway. The upper
airway can be categorised into three anatomical regions:
• nasal cavity: extending from the external nares to the posterior nasal concha;
• oral cavity: extending from the lips to the tip of the soft palate;
• pharynx: extending from the posterior nasal concha to the glottis of the larynx.
These can all be included in the respiratory system along with the trachea, the bronchus,
bronchioles and lungs. The pharynx (approximately 0.12m−0.14m long) can be further subdivided into three regions:
• nasopharynx: extends from the posterior nasal concha to the tip of the soft palate;
• oropharynx: extending from the caudal margin of the soft palate to the base of the tongue;
• laryngopharynx: extending from the base of the tongue to the larynx.
Further description of the upper airway and the palate and their functions can be found
respectively in Appendices §A.1 and §A.2, along with a short glossary of several of the medical terms used in this thesis in Appendix §A.3.
1.2.2
Pathophysiology of Snoring
Snoring is the acoustic manifestation of the vibration of soft flexible-tissues in the
1.2.2 Pathophysiology of Snoring 6
increases. This leads to an increased Reynolds Number,Re, and hence increasingly
per-turbed flow through the region. Subsequently, pressure fluctuates rapidly and initiates
flow-induced structural instabilities (FISI) within the soft tissues. At a critical flow
ve-locity these tissue vibrations will be strong enough, provided the frequency is in human
auditory range, to manifest as the sound of snoring. Tissue structures involved in the
production of snoring are the soft palate, uvula and the pharyngeal walls and to a lesser
extent the tonsils and the base of the tongue. Martin (2002) and Amatoury (2004) both
reason that soft tissues exist in the upper airway as an engineering compromise has been
made in human evolution between the upper airway’s rˆoles of deglution and aspiration.
If the only function of the upper airway was to peristaltically pass masticated food on its
journey to the stomach, the soft tissues would be far more pliable. On the other hand,
if the upper airway had only to facilitate the passage of air to the lungs, the tissues
would be rigid. In fact, the upper airway must do both and so its mechanical properties
are somewhere in between. There are a multitude of physical attributes that define a
snorer. These can generally be divided into two classes of pathophysiological mechanism:
abnormally soft upper airway tissues and abnormally high U∞, as outlined in figure 1.3
below. Snoring will occur in the former class at low U∞ values. To demonstrate the
process in the latter class of generating abnormally high U∞, consider the inspiratory
Snoring
Abnormally Flexible
Airway
Abnormally High Flow Velocity
Abnormally Low Cross-Sectional Area
Abnormally High Flow Rate
1.2.2 Pathophysiology of Snoring 7
volumetric flow rate,Q, of a human. Q is equated as
Q = U∞A, (1.1)
where A is the averaged cross-sectional area of the upper airway. Q is maintained at a
constant level by the body. Therefore, as again shown in figure 1.3,U∞can be abnormally
high via two mechanisms:
• abnormally small A: usually referred to as high upper-airway resistance. The cross-section of a snorer’s upper-airway is likely to be either circular or slightly
elliptical in nature with the narrowing predominantly at the tongue base and hyoid
bone level (Schwab et al., 1995). Other physical features could be a receding chin,
enlarged tonsils and small degree of mouth opening;
• abnormal Q required: owing to poor ventilation, increased lung capacity, hy-poxia or hypocapnia.
The physical attributes described above lead to snoring via a single pathophysiological
mechanism. During sleep, the patency of the upper airway reduces and leads to the
production of snoring via all three mechanisms; this process will now be described.
Am-atoury (2004) defines patency as the upper airway’s tendency to narrow and hence cause
partial or complete airway obstruction, further saying that in normal sleeping subjects,
airway patency increases significantly when compared with the awake state. Amatoury
states that airway patency is chiefly determined by the balance between the activity
of the respiratory muscles (the chest wall and diaphragm; these generate inspiratory
negative pressure within the upper-airway lumen), and the upper-airway dilator
mus-cles (that act to oppose upper-airway collapse). The limited rigidity the upper airway
does have is partly maintained by dilator muscle tension rather than the inherent
phys-ical properties of its tissues. Therefore during sleep when dilator muscle activity falls
and these supporting muscles relax, the upper airway becomes soft (abnormally
flexi-ble) and narrows (abnormally small A). Therefore, the work involved in breathing is
1.2.3 Acoustic Properties of Snores 8
This increased activation leads to a greater suction pressure on the upper airway (and
therefore, abnormally high U∞). Alongside the hypotonia of the dilator muscles and
the drop in intraluminal pressure, a greater pressure is exerted inwards on the upper
airway which increases the likelihood of further collapse and the possibility of snoring
initiation. Other physical factors that lead to snoring combining several or all of the
pathophysiological mechanisms mentioned above are age, gender, alcohol consumption,
a relatively long soft palate, obesity, behavioral state and nasal congestion. Snoring is
more likely to occur during the inspiration period of the respiratory phase, as an
ab-normally high U∞ leads to increased negative pressure in the upper airway (to create a
pressure difference such that air can flow into the lungs), greater intraluminal pressure
and therefore a high susceptibility to collapse. Upper-airway narrowing during sleep may
not involve the complete pharynx but may be limited to specific segments. Narrowing
is facilitated by head and neck position and also sleeping in the supine position, where
gravitational forces acting on the soft tissues of the upper airway, especially the tongue
and soft palate, force them to collapse, falling back towards the posterior pharyngeal
wall.
1.2.3
Acoustic Properties of Snores
As there are several mechanisms that govern snoring and many physical factors that
influence the phenomenon, it follows there will be several different types of snores. By
measuring the acoustic properties of snores, it is possible to distinguish and categorise
snores into different types. Snoring generates acoustic noise via the vibration, and hence
compression and rarefaction, of adjacent mediums; the bones of the ear detect these
vibrations. Amatoury (2004) describes how snoring acoustic characteristics are defined
by comparing the upper airway to a guitar. Increasing the stiffness of a guitar string
increases the sound frequency produced. Frequency can also be altered by placing a
finger on the string to change the length. Similarly, increasing the stiffness or reducing
the length of the soft palate will increase the acoustic oscillation frequency of the snore
1.2.4 Pathology of Snoring 9
and hence the more mass in the upper airway the lower the snore frequency. Sound
intensity is proportional to the strength of the picking; in a snorer, it is proportional
to the strength of inspiration. A loud snorer can produce a sound of 85 dB though
its intensity in a regular snorer is usually around 50−60 dB (Schoenstein, 1997). A study by Miyazakiet al. (1998) found that snores generated at different locations in the
upper airway had characteristic frequency ranges. When a snore initiates, the site of
the snore can be identified using several pressure transducers; frequency values can then
be assigned to particular sites. Sites of snores and their respective characteristic sound
frequencies were: soft palate 102.8±34.9 Hz, the tonsil/tongue 331.7±144.8 Hz, the soft palate/tongue 115.7±58.9 Hz and larynx∼250 Hz. Beck et al.(1995) acoustically grouped snores into simple- and complex-waveform types. Complex-waveform snores
were characterised by a repetitive, equally spaced train of sound waves that began with
a large deflection followed by a decaying amplitude wave. In the frequency domain, there
was a peak power surrounded by smaller equally spaced peaks. Simple-waveform snores
exhibited a shape in the time domain close to that of a sine wave with slight deflections
such that there was almost no sign of secondary internal oscillations. Therefore in the
frequency domain there was a dominating single peak followed by one or two much
smaller peaks. Beck et al. suggested that complex-wave form snores are produced from
complete momentary closure of the upper airway, developing tissue vibrations as a result
of the slam when the walls meet to be followed by a rapid popping when the airway
reopens. Simple-waveform snores therefore represented oscillations of the upper airway
wall (or other associated structures) about a base point without reaching absolute closure.
Expiratory snores have also been measured by Perezet al.(1993) and are found to have
a higher fundamental frequency and wider spaced harmonics. Perez et al. suggested
that this was due to a change in the source of vibration to the tonsil.
1.2.4
Pathology of Snoring
Apart from the obvious social infraction, snoring is the precursor and progenitor of
1.2.4 Pathology of Snoring 10
disorders that come under the heading of sleep-disordered breathing (SDB). The SDB
spectrum can be separated into two broad categories:
• those associated with abnormalities of central respiratory drive;
• those associated with obstruction and narrowing of the upper airway.
Sleep disorders in the first category are known as central sleep-apnœa. Snoring comes in
the second category. Also in this second category are:
• upper-airway-resistance syndrome (UARS): frequent arousals from sleep due to increase in upper-airway resistance;
• hypopnœa: partial obstruction of the upper airway coupled with a drop in tidal volume;
• obstructive sleep-apnœa: characterised by repeated obstruction of the upper air-way leading to periods of complete cessation of airflow, associated with continued
inspiratory efforts, oxygen desaturation and frequent arousals from sleep.
Obstructive sleep apnœa and hypopnœa are closely related and therefore are referred
to under one name as obstructive sleep apnœa-hypopnœa (OSAH). An individual with
UARS or OSAH will almost certainly exhibit snoring. A snorer has a greater likelihood
of developing one of the more serious disorders listed above than a non-snorer. These
dis-orders and snoring in particular have been linked to cardiovascular disease (CVD). CVD
is disease of the heart and blood vessels. It includes all diseases of the circulatory system
such as myocardial infarction (heart attack). One CVD is cerebrovascular disease which
usually refers to stroke (cerebral infarction) and transient ischaemic attacks (strokes
that are relatively mild). During stroke, blood to the brain is cut off or significantly
re-duced, reducing oxygen supply and thus killing brain cells. The main pathophysiological
mechanism leading to CVD is clogging of the arteries due primarily to atherosclerosis.
Artherosclerosis manifests as plaque-like material building up in arteries. The causes of
1.2.5 Treatment of Snoring 11
that the plaque build-up is a reaction to injury (Ross, 1986). Amatoury (2004) proposes
that damage to the carotid artery due to snoring vibration over several years could lead
to artherosclerosis. CVD can also be caused by hypertension. Hypertension refers to
abnormally high blood pressure in an individual, even when at rest. Snoring has been
related to hypertension in several studies, for example see Bixleret al. (2000).
1.2.5
Treatment of Snoring
It has been shown that there are many types of snore. Also, the parts of the body
in-volved are by no means simple in construction. The soft palate which plays a large part
in all types of snores has a highly complex muscular structure, blood supply and nerve
system (see §A.2 for further description of the soft palate). It therefore follows there will be no singular or simple cure for all types of snoring. Despite being a well known
condition, treatments are still rudimentary and unsophisticated. Commercial appliances
developed to treat sleeping breathing disorders aim to keep the oral and nasal airways
open (Lowe, 2000). The main surgical procedure to treat snoring,
uvulopalatopharyn-goplasty, concentrates on reducing flutter of the soft palate. Ellis et al. (1993) explain
that this operation removes a large section of the soft palate and that although it is
a successful operation, it is also a drastic one with attendant morbidity and mortality.
They executed a new procedure, palate stiffening, where part of the soft palate is
re-moved with a laser. The scar tissue that forms over the wound following the operation
is stiffer than the original skin, making the soft palate less susceptible to flutter. Other
treatments for snoring include the application of constant-positive airway-pressure via a
face mask whilst sleeping, nose clips to keep the nostrils open and the removal of mucous
membrane from the inside of the nose. The sophistication of snoring treatments will
increase with quality of the research conducted into its pathophysiology. To that end,
Armstrong et al. (2003) have developed an optical-coherence tomography system that
can be used to monitor upper-airway size, shape and function during sleep. Coupling
this information with a fluid-structure numerical model of the upper airway yields a
1.2.6 Models of the Snoring Phenomenon 12
that have been published are now described.
1.2.6
Models of the Snoring Phenomenon
Several studies have been published that model different parts of the upper airway and
are related to the snoring phenomenon. In general, they focus on explaining the
oc-currence of instabilities which lead to snoring. Gavriely and Jensen (1993) carried out
analytical and experimental investigations of the snoring phenomenon. Experimental
results found typical snoring sounds with frequencies in the region of 30 to 100 Hz. They
created an analytical lumped parameter model of a piston on one surface of a fixed
channel. Using this simple model they determined that instability was dependent on, in
order of importance: a) flow rate; b) length, diameter and elastance of the collapsible
segment; and c) the resistance of the upper airway and the fluid density. Aur´egan and
Depollier (1995) used analytical linearised-theory to model a flexible surface in a
sim-plified resistance-model of a channel, also carrying out an experimental analysis. Their
model showed that snoring was controlled by two parameters, one related to soft-palate
characteristics and the other related to flow conditions and discovered two types of snore
termedpureand apnœicsnores. Pure snorers generated snores through the instability of
the soft palate. Apnœic snorers generated snores through the opening and closing of the
oropharynx. They argued a non-linear model was required to model the abrupt large
pressure changes, resulting from the closing of the pharyngeal channel, that lead to sound
production. Huang has conducted several studies. Huang (1995) modelled palatal
snor-ing analytically and experimentally ussnor-ing a cantilevered flexible surface in an unbounded
flow. He found a specific flutter speed accompanied by a specific mode shape for the
range of different flexible surfaces studied. Huang et al.(1995) described three different
types of snoring: a) palatal with one airway open; b) palatal with both airways open;
and c) pharyngeal snoring. In an experimental model of palatal snoring, they found the
model palate lost stability due to flutter. Huang and Ffowcs Williams (1999) showed
how neuromechanical forces changed the patency of the airway when oxygen levels were
1.3 Summary 13
the addition of a spring modelling the airway response to oxygen levels. They found that
if the time of the response was delayed, as during sleep, the reactive stiffening of the
airway could cause instability rather than stability. Aittokallioet al. (2001) analytically
modelled the upper airway with a flow in a flexible channel with the interesting addition
of time-dependentQ, wall stiffness and muscle tone. Analytical results produced output
Q at the exit of the laryngopharynx similar to those seen in snorers. Balint (2001) and
Balint and Lucey (2005) numerically modelled a flexible surface in a viscous channel
flow at low Re. With both airways open, the flexible surface lost stability by flutter,
but with one airway closed the flexible surface lost stability by divergence. In the latter
case, when damping was included it promoted divergence by facilitating the formation
of a critical deformation shape. However, for low values of damping at flow speeds below
divergence onset, flutter can exist. At higher flow speeds a combination of flutter and
divergence instability mechanisms can be responsible for oscillatory growth.
1.3
Summary
From the information presented in this chapter, it is proposed that the snoring
phe-nomenon is a disease with serious side-effects and there is a need for better treatments
to alleviate its causes. It has been shown that there are many pathophysiological
mecha-nisms that cause snoring and, therefore, there are several different types of snore.
More-over, snore generation occurs in the human pharynx, a highly complex part of the human
anatomy. It follows that there is no simple, single cure for any one patient and any
treatment must be tailored to the individual. With the advent of real-time measuring
techniques of the upper airway of snorers during sleep, there is a need for computational
models that can interpret the measured data to ascertain the type of snoring occurring
in the individual and allow the testing and optimisation of a treatment based on the
individual’s case. Such a model is described in this thesis; how it extends the results of
Chapter 2
Literature Review
This chapter examines existing literature on fluid-structure interaction phenomena and
methods of modelling these phenomena relevant to this thesis. Each section covers a
different topic and the main findings and key remaining questions are summarised in the
final section; this provides an opportunity to describe the novel academic contribution
made by this thesis.
2.1
Flow-Induced Structural Instabilities
When a fluid and structure interact, instabilities can occur. This subject area contains
a variety of academic problems. Early studies by Rayleigh (1879, 1945) considered how
flags flapped in wind; Gray (1936) considered the use dolphins made of their flexible skin
to enhance their movement in water. The latter study was taken to the experimental
stage by Kramer (1960a,b) who measured substantial drag reduction on a submersible
covered with a flexible coating. This sparked a large amount of academic interest into
flows over flexible surfaces, seminal works being conducted by Benjamin (1960, 1963)
and Landhal (1962). From these studies a pattern began to emerge as to the types
of flow-induced structural-instabilities (FISI) that could be generated. There are many
excellent reviews of this area of academic work, for instance Carpenter (1990). Using
2.1 Flow-Induced Structural Instabilities 15
the description by Huang (1998), the main types of instability can be divided into three
groups:
• Class A: the flexibility-modified Tollmien-Schlichting instability (TSI);
• Class B: the travelling-wave flutter (TWF);
• Class C: the static divergence and Kelvin-Helmholtz instability.
The fundamental sources of these instabilities are, respectively, fluid viscosity, vorticity
gradient and fluid inertia. Structural damping has a destabilising effect on class A waves
but a stabilizing role on class B waves. For elucidation on TWF in flexible surfaces
see Carpenter and Garrad (1986), Gad-el-Hak (1986) and Lucey and Carpenter (1995).
This subject area now incorporates several other geometries: a flexible surface in an
unbounded flow, a flexible surface in a channel flow and flow in a flexible channel.
Re-search into flexible channels has roots in the nuclear industry, for examples see Pa¨ıdoussis
(1966a,b). Larose and Grotberg (1997) described the link between these geometries as
the similar ways the introduction of damping, a finite length to the structure or the
presence of fluid viscosity can all be destabilising. Kornecki (1978) reviewed FISI in
these different geometries and these were also recently summarised by Pa¨ıdoussis (1998,
2004). The next geometry to be studied would be to couple a flexible surface and a
flexible channel flow. In general, these different geometrical cases are modelled using
linearised ideal-flow theory coupled with linear flexible surface-models. There are
ex-ceptions with examples of viscous fluid work by Carpenter and Garrad (1985, 1986) and
non-linear walls being included by Luceyet al.(1997). Most work is analytical and based
on the use of the Galerkin method, first utilised by Weaver and Unny (1970). Again,
there are some exceptions. Lucey and Carpenter (1992a) have utilised panel methods to
discretise the solution space. Their model and that of Noguchiet al.(1995) is similar to
that created for the research in this thesis. Panel methods originated in the aerospace
industry, a detailed description of these found in the work of Hess and Smith (1966). A
large amount of research was conducted in the aerospace industry on aeroelastic
2.1.1 Flapping Flags 16
(1957) and Scanlan and Rosenbaum (1960); importantly, the work of Dowell (1975) paid
particular attention to the aeroelastic properties of plates. The subject remains topical,
with articles appearing in the popular science press (for examples, see New Scientist
(1997, 1999, 2000)). Examples of commercial FISI packages are given in the work by
Knightet al.(2001), who describe a methodology using a commercial CFD code coupled
with an independently developed two- and three-dimensional structural solver and Berry
et al.(1999), who used the commercial structural solver ABAQUS to model the dynamics
of the soft palate. Theoretical research in general has not utilised commercial software
because it is interested in the initiation of the instabilities and therefore simplified linear
models are used. Once unit effects are understood, the incorporation of further effects
such as viscosity can be made, though the usual next step would be to make initial linear
models non-linear.
2.1.1
Flapping Flags
Flags flap. Consider a flag in a mild breeze where the airflow is laminar. The flag is a
flexible object that bends easily and stretches with difficulty. Huber (2000) asks: why
does the flag flap in an unstable motion (flag flutter) and not extend straight out in
the direction of the breeze parallel to the streamlines? Rayleigh (1879), who likened the
problem to that of Kelvin-Helmholtz instability, predicted that any perturbation to the
flag or the breeze would lead to flag flutter. Thoma (1939) showed that the mass of
the flag had an important rˆole to play in the formation of flag flutter. Stearman (1959)
studied the problem experimentally and theoretically, finding a critical velocity,Uc; above
this fluid velocity the flag would enter into unstable oscillations owing to a particular
type of instability. Taneda (1968) obtained experimental results showing that when the
flag did not flutter, von Karm´an-like vortices were shed from the trailing edge; when
the flag did flutter, the flow separated from the surface, accompanied by a large eddy
wake and the Kutta conditionseemingly not being satisfied. Referring to Houghton and
Carpenter (2003), the Kutta condition states that a stagnation point should be present
2.1.1 Flapping Flags 17
of an infinitely thin or cusped trailing edge, it is sufficient to require that the velocities
above and below the surface be equal at the trailing edge. This condition ensures that
fluid flow does not occur from one side of the trailing edge to the other. Essentially,
Balint and Lucey (2005) describe that the deforming flag is a variable-lift thin aerofoil
and the Kutta condition reflects the (changing) lumped bound-vorticity that is the sum
of the spatially-distributed vorticity located in the boundary layers on the upper and
lower sides of the flag. The Kutta condition holds for linear deformations of the flag, but
for larger oscillations additional fluid forces are such that the Kutta condition maybe
violated, as in the observations of Taneda detailed above. Datta and Gottenberg (1975)
showed that their derived governing equation of a flag, approximated as a cantilevered
flexible surface, in an air flow was similar to that of a suspended fluid-conveying pipe; this
similarity remained valid in the non-linear case. Recently, Rayleigh’s original idea was
contradicted by Zhang et al. (2000), who discovered a stable oscillation at Uc, a steady
state,1 of a flapping flag, modelled by a filament in a thin-film flow. Also, when instability
was observed, it was not caused by vorticity shed from a flag pole as would be the case
with a flag; the instability was initiated by the dynamic interaction of the filament’s
tension, elastic rigidity and mass with the fluid flow. When the steady-state oscillation
occurred, filament mass had come into balance with fluid mass, while the elastic energy
of the filament balanced the kinetic energy of the fluid. In this thesis the fluid is modelled
as an ideal fluidi.e. a fluid that is inviscid, irrotational and incompressible. If the flexible
surface is initially flat, no instability occurs as observed in the experiments of Zhang et
al. FISI can still occur but the model requires a kick in the form of an initial deflection
of the flexible-surface or an applied pressure perturbation. This shows that the kick in
the experiments of Zhanget al. was provided by the viscosity and compressibility of the
flow and the flow’s ability to rotate.
1