publisher policies. Please scroll down to view the document itself. Please refer to the repository record for this item and our policy information available from the repository home page for further information.
To see the final version of this paper please visit the publisher’s website. access to the published version may require a subscription.
Author(s): Stephen Broadberry with Ghosal, S
Article Title: Technology, Organisation and Productivity Performance in Services: Lessons from Britain and the United States Since 1870 Year of publication: 2003
Link to published version:
1870-1990
Stephen Broadberry and Sayantan Ghosal
Department of Economics, University of Warwick, Coventry CV4 7AL [email protected]
[email protected] 3 October 2002 Files: servmod1; netapp2
This paper first documents the comparative productivity performance of the United States and Britain since 1870, showing the importance of developments in services. We identify the transition in market services from customised, low-volume, high-margin business organised on a network basis to standardised, high-volume, low-margin business with hierarchical management, as a key factor. A model of the interaction between technology, organisation and economic performance is then provided, focusing on the transition from networks to hierarchies. Three general lessons are drawn: (1) developments in services must be analysed if the major
changes in comparative productivity performance among nations are to be understood fully (2) different technologies and organisational forms can co-exist efficiently (3) technological change can cause difficulties of adjustment in technology-using sectors if it is not suited to the social capabilities of the society.
JEL classification: N10, O40, C79
I. INTRODUCTION
This paper uses the experience of Britain and the United States to draw some lessons concerning the role of services in overall productivity performance and the difficulties of raising productivity in technology-using sectors. The United States overtook
Britain in comparative productivity levels for the whole economy primarily as a result of trends in services rather than trends in industry. US overtaking of Britain in market services occurred during the transition from customised, low-volume, high-margin business organised on a network basis to standardised, high-volume, low-margin business with hierarchical management from the 1870s. This development was dependent on technologies that improved communications and information
processing. Although the transition to high-volume, low-margin business occurred across a wide range of services, some activities remained better suited to low-volume, margin business. Since Britain was more successful in these low-volume, high-margin sectors, British relative economic decline was modest. Nevertheless, the overall transformation was dependent on the existence of appropriate social capabilities, including a high level of education and a willingness to accept an intensification of the labour process. The technologies were slower to diffuse in Britain as a result of lower levels of education and stronger labour force resistance to intensification.
After documenting the historical productivity trends in section II, we model the transition from networks to hierarchies in section III. We show that networks are more suitable for customised ventures while hierarchies are more suitable for
change may create difficulties of adjustment for a society with a history of success based upon networks. Section IV combines the historical and theoretical analysis to draw three lessons: (1) we need to analyse developments in services if we are to understand fully the major changes in comparative productivity performance among nations (2) different technologies and organisational forms can co-exist efficiently (3) technological change can cause difficulties of adjustment in technology-using sectors if it is not suited to the social capabilities of the society.
II. HISTORICAL TRENDS
1. Comparative productivity in services and the aggregate economy
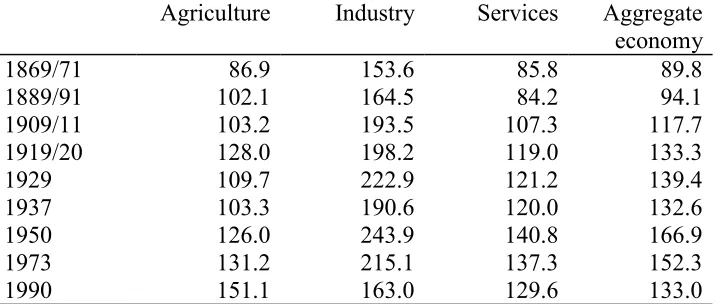
Broadberry (1997a) notes that the US productivity lead in manufacturing increased across World War I and again across World War II, but in both cases the increase was not sustained. Also, Broadberry (1998) notes that the shift out of agriculture, a low value-added activity, occurred later in the United States, contributing to the US catching up. But again, even in shorter-run fluctuations, services dominate; the correlation coefficient R between the comparative productivity in the aggregate economy and in services in Table 1 is 0.98, compared with 0.85 between the aggregate economy and industry and 0.65 between the aggregate economy and agriculture.
2. Comparative productivity patterns within services
Trends in comparative productivity in services as a whole are driven by trends in comparative productivity in market services, where output can be measured
There are some more disaggregated estimates of comparative productivity for a number of benchmark years in Table 3, which add some more detail to the picture. First, the comparative productivity trend in transport and communications is mirrored in the trend on the railways, but with an even more dramatic US lead emerging. A substantial productivity gap had also opened up in communications before World War I and in road transport, shipping and air transport after World War II. In financial services more narrowly defined, the United States had pulled slightly ahead of Britain before World War I and built up a bigger lead during the 1920s. The US banking crisis of the 1930s shows up more clearly in these estimates, and the US lead since World War II is more decisive.
3. Modern business enterprise and productivity performance in market services The emergence of the US productivity lead in services is associated with the
was divided into geographic divisions, and each division was further subdivided by function and managerial hierarchies appeared (Chandler, 1980: 16). By the beginning of the twentieth century, the modern corporate form had spread to other parts of the transport and communications sector, including steamship lines, urban traction systems and the telegraph and telephone systems (Chandler, 1977: 189-203).
These changes in transport and communications were accompanied by the emergence of modern business enterprise in distribution, although it did not diffuse as widely in distribution as in transport and communications. For one thing, there were limits to the degree of centralisation and standardisation that consumers found acceptable in retailing, particularly given the relatively low levels of population density in the United States (Hall et al., 1961: 131-138; Field, 1996: 27). And second, as Field (1996: 25-27) notes, there were restraints on competition which acted to support small retail outlets. In particular, resale price maintenance retained an ambiguous legal status until 1975 and limited price competition, making it easier for small independent retailers to survive (McCraw, 1996). In addition, state legislation aimed at supporting the independent retailers applied escalating tax rates to businesses with two or more retail outlets (Tedlow, 1996: 182-258; Perkins, 1999: 119-120).
relatively small transactions, reputation and personal contact have often remained important on large transactions. Hence we should not be surprised to see that low-volume, high-margin business has continued to be important in financial services, particularly in international finance, where networks of personal contacts can be more important than modern business enterprise in generating high value added (Jones, 1993). Nevertheless, it seems clear that the emergence of modern business enterprise in banking and finance in the United States has also been limited by regulation. In particular, regulations prevented the growth of inter-state banking, keeping
concentration in US banking relatively low (White, 2000: 749). Calomiris (1995) also cites the Glass-Steagall Act and Regulation Q as helping to keep American banks small by keeping apart commercial and investment banking and by setting a ceiling on interest rates that could be paid on bank deposits.
The appearance of modern business enterprise in services is associated with the transformation from the counting house to the modern office (Anderson, 1976: 4; Lockwood, 1958: 23-24). This transformation was permitted by developments in information and communications technologies, which allowed a high-volume approach to business (Yates, 1989; Campbell-Kelly, 1992). The key developments included the telegraph and the telephone, which are well known, but also new
technologies of written communication and data processing, which have received less attention.
The telegraph and telephone opened up new possibilities for rapid exchanges of information across large distances, and hence had their biggest impact on
railways, merchant wholesalers and international banks. In terms of office management and the switch to productivity-enhancing high-volume business, however, the impact was rather limited, since the telegraph was most often used for ad hoc communications and the telephone for informal communications (Yates, 1989:
21-22). The introduction of the new technologies of written communication and data processing had a more pervasive effect on business organisation. The typewriter, the duplicating machine and the vertical filing system, radically changed the way that a business could produce, reproduce and store documents, while calculating machines transformed the way that firms could process data (Yates, 1989: 21-64; Cortada, 1993).
These technological developments played an important role in the emergence of the modern business enterprise, facilitating the standardisation of tasks within large organisations and permitting easier monitoring of employees. The modern office thus became a more intensive working environment than the counting house, with reduced autonomy for workers. These aspects of the transformation of office work are
documented by Lockwood (1958: 41-96), who notes that: (1) the modern office typically employed more clerks than the counting house (2) there was a much higher degree of specialisation of tasks with reduced autonomy for individual clerks (3) recruitment became more impersonal, less dependent on the personal networks of the counting house era (4) hence there were reduced prospects of promotion to
partnership within the firm as a narrower range of tasks was undertaken (5) the material status advantages that clerks enjoyed over the mass of manual workers were eroded in the modern office.
to market services, where regulation meant that restrictions on competition were much more systematic and persistent than in manufacturing.
III. A MODEL OF TECHNOLOGY, ORGANISATION AND PRODUCTIVITY PERFORMANCE
1. The model
We now present a model of technology, organisation and economic performance, which provides a framework of analysis for changing productivity leadership that is centred on services. A more formal model is presented in the appendix, but here we rely on a diagrammatic exposition.
An example, based on British shipping in the late nineteenth century will help to clarify the situation being considered. As Boyce (1995) notes, shipping ventures at the time were usually conducted by networks. A group of agents would each make an initial investment, which would allow the purchase of a ship and other necessary items. The aim of the venture might be to take a cargo between two cities (say
persistence of group membership, however, can be used to provide a solution to the incentive problem and deter opportunistic behaviour.
Now consider the case where there has been an increase in the scale of
business between London and Buenos Aires and an improvement in communications, so that agents in London can keep in continuous contact with agents in Buenos Aires by telephone. It may now be feasible to establish a regular scheduled service between the two ports, requiring an investment in a fleet of ships, the establishment of a bureaucracy to run the regular service and a marketing organisation to secure sufficient demand to fill the capacity. The establishment of a shipping line can therefore be seen as requiring Chandler’s (1977) three-pronged investment in production, management and marketing. The key development from our point of view, however, is the standardisation of the business and the possibility of moving to a hierarchical form of organisation. The entrepreneur can now specify more closely the actions to be taken by agents and verify that they have been carried out. Wage contracts can now be used to ensure that appropriate actions are taken by venture members.
Time periods are indexed by t=0,1,2… and there is a collection of individuals indexed by i, each of whom is endowed in each period with a consumption good, x, and a set of actions a. Within each period t, utility depends positively on the
consumption good and negatively on the cost of matching actions to shocks. Each individual agent i has a discount factor δ, where 0<δ <1. We use this discount
of an individual agent. When δ is low, an individual is impatient and puts a higher
utility weight on current consumption relative to future consumption. When δ is close
to one, an individual is patient and discounts future consumption less.
There is an entrepreneur, agent 0, who is endowed with information about a venture. The venture can be either customised or standardised, and we shall refer to this as the venture technology. In the customised venture, individual agents must make decisions in the light of individual information. There is a minimum venture size K+1, with agent 0 and K other agents. All agents, including agent 0, must invest their good and choose actions a to match participant-specific shocks θ. There is a
highest level of venture output K c
q if there is a match between action and shock for all
agents. Output will be lower than this if even one agent does not match action and shock. In this formulation of the customised venture, the information relevant to discerning the appropriateness of individual actions is privately observed and efficient operation of the venture requires participants to choose different actions in response to their privately observed shocks. Participants are thus autonomous and have
considerable discretion in choosing their actions.
The standardised venture is similar to the customised venture, but with one key difference. Now, each participant has to choose an action to match the
The two types of venture technology (customised or standardised) can be operated by either of two organisational forms, a hierarchy or a network. A network involves decentralised decision making: All venture members choose actions
independently, and the share of venture output of each current venture member is
fixed at
+1 1
K . A hierarchy involves centralised decision making: agent 0 invests
in a monitoring technology, that allows him to verify at a fixed cost M the actions of all other agents. Agent 0 also chooses the action profile of all participants, specifies payment as a function of those actions and verifies that they have been carried out.
Within each period, there are two stages. In the first stage, common to both organisational forms, agent 0 chooses the venture technology and the set of current venture members, while new and existing members decide whether or not to participate in the venture. In the second stage, the interaction between venture
members depends on the organisational set-up and the type of venture. In a network, individual venture members choose their actions in the light of their individual shocks. In a hierarchy, agent 0 invests in the monitoring technology, and specifies the actions of venture members and their payments, subject to feasibility and participation constraints.
that all members of a venture behave and are treated in the same way, both within and across periods.
2. Results
In this section, we state some results which characterise the dynamic equilibria, using a simple diagrammatic exposition.
RESULT 1: A network may operate a customised venture efficiently through a group
reputation mechanism, while a hierarchy may not.
With a customised venture, there are individual shocks, which cannot be observed by the entrepreneur. In a network, the share of output for each agent is fixed in
proportion to his initial investment. However, each agent participating in today’s venture gets a future reward from continuing to be selected for membership of the network in the future (this future reward is discounted by δ). In a network, individuals
are induced to match actions to shocks through a group reputation mechanism, together with the associated persistence of membership, since although individual effort cannot be monitored, group output can. An individual who is tempted to behave opportunistically must weigh up the short run gains against the loss of future utility from network participation when his membership is terminated.
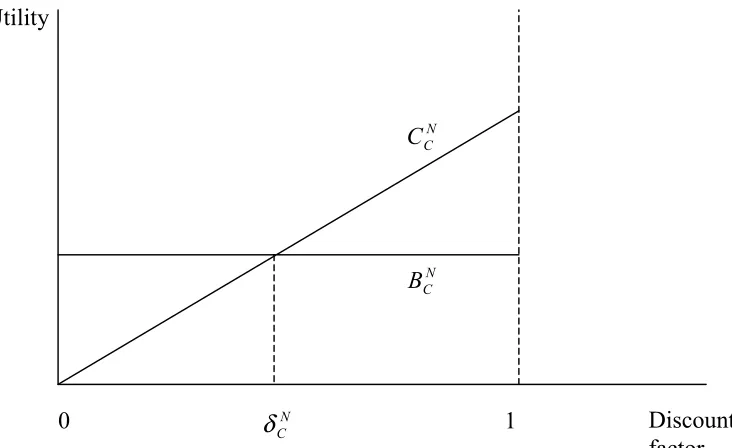
The essence of the result can be shown diagrammatically in Figure 1, where we study the trade-off faced by a single current venture member, given that all other current and future venture members choose appropriate actions. The benefit of
deviating from the appropriate action N c
B is a one-shot gain, and hence does not vary
venture output is reduced. Therefore, agent 0 will detect that some current member has chosen an inappropriate action. This allows agent 0 to condition future
membership in the venture as a function of other agents’ actions. Therefore, the cost
of deviating from the appropriate action N c
C arises from the loss of the discounted
future utility as a result of membership termination. Under our assumptions, this is a linear function of the discount rate δ. If the discount rate δ is too low (i.e. if
individuals are too impatient), then the benefit of deviating exceeds the cost, and it is
not possible to sustain a high output equilibrium. Above the critical value N c
δ ,
however, it is possible for networks to run the customised venture efficiently.
In a hierarchy, it is not possible to sustain the efficient outcome with high output in a customised venture, because the shocks are privately observed and agent 0 does not have sufficient information to specify from the centre the correct actions to be taken by individual venture members.
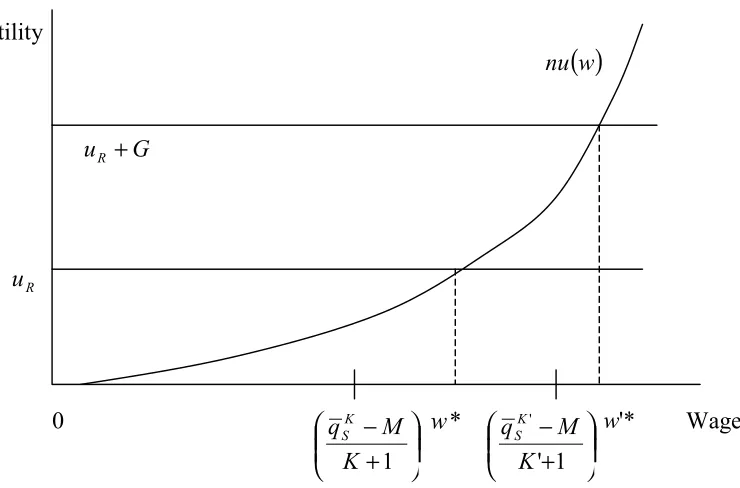
RESULT 2: A hierarchy may operate a large-scale standardised venture efficiently, but a small-scale standardised venture may be operated efficiently only by a network.
Figure 2, agent 0 picks the wage w* that equate the utility from the outside option (uR)
to the net utility cost of choosing the appropriate action nu(w), which depends on the
wage. If the per capita venture output net of monitoring costs
+ − 1 K M qK
S is lower
than w*, the hierarchy is not feasible. On the other hand, when the per capita venture
output net of monitoring costs
+ − 1 ' ' K M qK
S for a larger venture of size K’, is higher
than w*, then the hierarchy is feasible. Hence a large enough standardised venture can be run efficiently by a hierarchy.
For a smaller standardised venture, a network can use a reputation mechanism to run the venture efficiently without investing in the monitoring technology. The group reputation mechanism is used as in Figure 1.
Results 1 and 2 characterise how customised and standardised ventures may be operated efficiently by networks and hierarchies. These results suggest that in general, we would expect to see customised ventures run by networks and
standardised ventures run by hierarchies. Next, we take changes in venture technology as exogenously determined and examine the organisational response. We show that technological change that favours large-scale standardised ventures may create some difficulties of adjustment for an economy with a history of networks operating small-scale customised ventures.
RESULT 3: As venture scale increases, a hierarchy is more likely to operate a
standardised venture efficiently, while a network is less likely to operate a customised
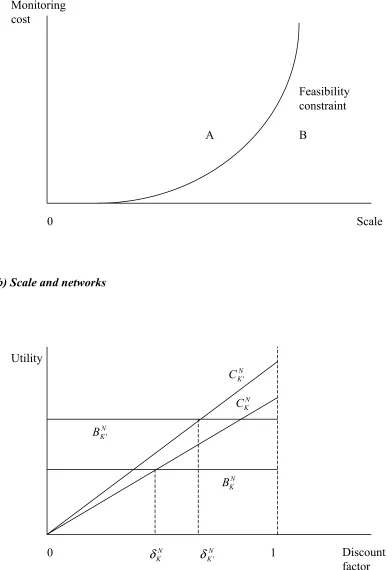
A hierarchy is more likely to be feasible when the scale of the venture is large. This is illustrated in Figure 3(a), where a point represents a particular combination of
monitoring cost and scale, so that each venture technology corresponds to a point. For a hierarchy to be feasible, the venture technology mist lie to the south east of the feasibility constraint, which is upward sloping since higher fixed costs of monitoring must be spread over a larger scale of venture output. At the venture technology given by point A, the entrepreneur will use the network form of organisation. A change in venture technology with larger scale, such as point B, makes it feasible for the entrepreneur to use the hierarchical form of organisation to run the venture. A fall in monitoring costs holding scale constant will also make a hierarchy more feasible.
We can illustrate the difficulties faced by a network operating a customised
technology as scale increases using Figure 3(b). Note that N K
B and N K
C are the
benefits and costs of deviating from the appropriate action in a venture of size K, as in
Figure 1, while N ' K
B and N ' K
C are the benefits and costs of deviating from the
appropriate action in a larger scale venture of size K’. Also, note that, as in Figure 1, we consider the trade-off for a current venture member, given that all other current and future venture members will choose the appropriate action. The crucial feature that illustrates the difficulty a network faces in adapting to the increase in scale is the fact that the minimum value of δ for which the network operates the larger scale
venture efficiently, N ' K
δ , is higher than N K
δ , the minimum value of δ for which the
network operates the smaller scale venture efficiently. The logic behind this result can be understood as follows. First, as scale increases, individual deviation has a smaller
proportional negative effect on venture output, which means that N ' K
B lies above N K B .
scale case because the future payoff from continued membership is higher with the
higher productivity associated with the increase in scale. Hence N ' K
C also lies above
N K
C . So long as the productivity increase is moderate, the first effect must dominate,
and N ' K
δ must lie to the right of N K
δ . This is a reasonable assumption to make when
considering a moderate relative productivity decline such as Britain compared with the United States.
Result 3 suggests that networks may have to transform themselves into hierarchies to operate the standardised technology efficiently. So far, we have assumed that the utility cost of matching an action to a shock in a hierarchy is the same as in a network. However, there are at least two reasons for thinking that this will not be the case. First, there is a loss of autonomy as after the transition to a hierarchy, network members submit themselves to centralised decision making. We assume that this loss of autonomy is reflected in an additional utility cost G of matching an action to a shock. The second reason for higher utility costs in the standardised venture would be if some additional education or training is required. Similarly for the entrepreneur, G can be thought of as measuring the utility cost of the extra burden of responsibility in the transition to a hierarchy from a network.
RESULT 4: A network operating a small-scale customised venture may fail to adapt
successfully to an exogenous change in technology that favours large-scale
standardised ventures, because network members resist the transition to hierarchy.
+ − 1 K M qK
S . Ignoring the extra utility costs associated with the loss of autonomy or
retraining (i.e. setting G=0), a hierarchy is feasible with the new technology, since the required wage is below the higher per capita output net of monitoring costs
+ − 1 ' ' K M qK
S . However, if G is positive, then this additional utility cost must be added
to the reservation utility
( )
uR , which pushes up the wage payment needed tocompensate existing network members. If G is sufficiently large, then the new wage needed to compensate existing network members (w'*) may be greater than the per
capita output net of monitoring costs
+ − 1 ' ' K M qK
S . Therefore, the post-transition
hierarchy is no longer feasible. Hence existing network members will face an incentive to resist transition if they care sufficiently about the loss of autonomy associated with the adoption of a hierarchical form of organisation or if they face sufficiently large education or training costs. A society with a low level of general education may therefore be expected to face a higher adjustment cost G. Note also that a low level of education may lead to a low reservation level of utility (uR),
making it easier to sustain a network, which requires the payment received by venture members to be above uR.
IV. LESSONS FROM HISTORY 1. The importance of services
Further discussion of this issue, including more quantitative evidence, is presented in Broadberry (1998) and Broadberry and Ghosal (2002).
2. Co-existence of different technologies and organisational forms
We have noted that US overtaking occurred during the transition to high-volume business in market services. This inevitably suggests a critical assessment of the performance of the British market service sector, and we shall consider later the possible factors slowing down the British transition to the new technologies and organisational forms. First, however, it is important to emphasise the moderate nature of the British relative economic decline, which illustrates the possibility of efficient co-existence of different technologies and organisational forms. This is a point which has been recognised in the literature on manufacturing, with the co-existence of mass production and flexible production methods widely seen as efficient (Sabel and Zeitlin, 1997; Broadberry, 1997a). However, there has been little recognition of the significance of this point for services.
Britain avoided becoming part of the Third World by continuing to succeed in parts of the economy that remained suited to network forms of organisation. We have already noted how the later and more limited spread of high-volume, low-margin business into distribution and finance is associated with the later emergence and smaller scale of productivity gaps in these sectors, compared with transport and communications. However, the continued success of British networks in market services also shows up in a more nuanced way in the contribution of these sectors to the current account of the balance of payments. For, as Imlah (1958: 55) notes, shipping remained the largest contributor to the substantial surplus on business services before 1914, with distribution and finance combined generating a smaller surplus. By the interwar period, however, Sayers (1976: Appendix 32, Table A) suggests a larger positive contribution from financial services than from shipping.
Although the distinction between sectors where high-volume business became important and sectors which remained dominated by low-volume business appears to show up in the productivity data, then, the balance of payments data are more
consistent with the co-existence of the two forms of business within each sector. This reflects the pattern identified in the manufacturing literature, that even where high-volume business became important, there was still space for flexible, low-high-volume producers in market niches. Despite the growth of competition from foreign shipping lines before World War I, British networks retained a strong position in tramp
network form of organisation, despite the growing dominance of large-scale
hierarchical banks in the domestic retail banking market (Jones, 1993). The continued role of London as a major centre of international finance has also been based on the network form of organisation (Cassis, 1994; Kynaston, 2001).
3. Difficulties of adjustment
The second lesson, that technologies and organisational forms can co-exist, helps us to understand why British relative decline was quite modest. However, there is a danger of taking the rehabilitation of Britain’s twentieth century economic performance too far (Rubinstein, 1993; Booth, 2001). It is therefore important to balance the second lesson with our third lesson, that technological change can cause difficulties of adjustment in technology-using sectors if it is not suited to the social capabilities of the society. This reminds us that the move to high-volume business originated in the United States, and created difficulties of adjustment in Britain. Those difficulties of adjustment account for the moderate British relative decline which did occur.
A society’s ability to absorb new technology is limited by its social capability, a concept first introduced by Ohkawa and Rosovsky (1973) and developed by
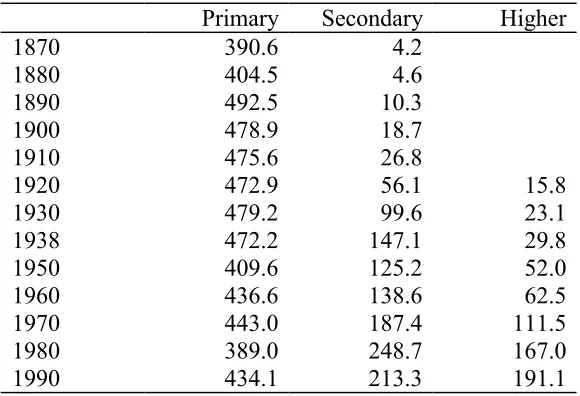
provision of mass primary education until about 1900, as has been widely noted in the history of education literature. Second, Britain lagged behind the United States in the development of mass secondary education between the two World Wars. This has been noted by historians of education such as Ringer (1979: 252-253), and has also been emphasised recently in the work of Goldin (1998). Third, Britain lagged behind the United States in the provision of mass higher education after World War II. By 1990, tertiary enrolment ratios in Britain were still a long way behind US levels.
Three points should be borne in mind when interpreting these trends. First, the transfer from primary to secondary education has generally occurred at a later age in the United States than in Britain, affecting the breakdown between primary and secondary education. Second, however, it is not possible to give enrolment ratios for narrower age bands, as the difference between primary and secondary education was a matter of class as well as age before World War II. Third, some of the educational deficiency in Britain may have been made up by part-time commercial education, particularly with the growth of shorthand courses at the end of the nineteenth century (Anderson, 1976: 101-104; Guerriero Wilson, 1998: 60-62). However, the limited evidence of enrolments on such courses in Glasgow and Lancashire and Cheshire suggests that this could not have overturned the substantial US educational advantage (Guerriero Wilson, 1998: 134; Anderson, 1976: 92, 97). The higher enrolment rates in the United States clearly reflect a greater investment in human capital per person than in Britain.
partly as a result of the focus on industry, where the link between formal schooling and the tasks performed by most workers is rather tenuous. In services, by contrast, the link between the tasks performed by most office workers and education
(particularly the three R’s and languages) is rather closer. However, it also partly reflects the fact that estimates of comparative education levels by Maddison (1991) put the United States behind Britain in terms of years of education thorughout the twentieth century, a finding that would be difficult to square with the enrolments data, and which has been rejected decisively by Goldin (1998; 2001).
A second aspect of social capability is the willingness of the labour force to accept the intensification of work and the intrusiveness of monitoring associated with the transition to high-throughput methods. As with mass production technology in manufacturing, modern office technology in services reduced the autonomy of workers, creating an army of workers performing standardised tasks and subject to close monitoring (Braverman, 1974: 321). It is worth noting that the pattern of British trade union densities in Table 6 shows high union densities in the large-scale
hierarchically organised transport and communications sector, and lower union densities in the distribution and financial services sectors. It seems likely that the degree of employment concentration acts as a proxy for the amount of autonomy experienced by individual workers, with the working conditions of workers becoming increasingly standardised in larger organisations (Lockwood, 1958: 141; Anderson, 1976: 110).
Campbell-Kelly (1998: 24) finds managers in the Post Office Savings Bank as
strongly opposed as the workers to the introduction of modern office technology. The decision to retain bound ledgers, for example, was supported by management with the argument that a card-based system would be “most troublesome and distasteful to the clerks” and would “render their daily duties more irksome and difficult”. As
Campbell-Kelly (1998: 24) notes, the concern of the managers with the welfare of the workers rings rather hollow given their previous record, but there can be no doubt about their distaste for modern office technology. It is not simply that unionised workers resisted the attempts of managers to introduce new technology. Rather, workers and managers shared rents arising from a sheltered competitive environment.
development of telephone usage in Britain may reflect simply the supply policies of the Post Office, which had a monopoly of the telephone service for much of the period under consideration (Foreman-Peck and Millward, 1994: 252).
However, we can show that Britain was also slow to adopt data processing machinery and other office machinery such as the typewriter. In Table 8, we present some flow data on sales of office machinery in Britain and the United States from the early 1900s to the late 1960s. The starting date reflects the fact that office machinery was not recorded separately in British trade statistics before 1908, while the end date reflects the growing importance of the electronic computer. Sales have been
calculated by subtracting exports from the sum of production and retained imports. In the case of typewriters, the volume of units is available, and this has been used in the comparison of sales between the countries. In the case of cash registers, calculating machines and other office machinery, the lack of adequate volume data means that the value of sales must be used in the comparison between countries. Sales values are converted to a common currency using a unit value price ratio, reflecting deviations from purchasing power parity. Finally, current prices in sterling are converted to constant 1929 prices using the UK deflator for GDP at constant factor cost.
For typewriters, the US/UK comparative sales per 1000 population ratio fluctuates around a level of about 3-to-1, giving the US a considerable lead. For cash registers, calculating machines and other office machinery, the ratio fluctuates rather more, but around a higher level of the order of 5-to-1. The flow data on office
Although nobody has previously assembled data on the diffusion of modern office equipment, there have been a number of case studies of office mechanisation in Britain, which it is helpful to reconsider in the light of our findings on comparative productivity performance. Campbell-Kelly (1998) demonstrates the existence of conservative attitudes towards new technology in the Post Office Savings Bank (POSB) before World War I. Thus the POSB resisted the introduction of the
typewriter before 1914 on the grounds that given the scale of operations, pre-printed standard responses were cheaper, with more than 550 standard replies in use by 1885, rising to one thousand by 1914 (Campbell-Kelly, 1998: 22). Similarly, calculating machines were of little value to the POSB because the bank had developed an accounting system that required balances to be calculated only at the end of the year when interest calculations were made. Furthermore, interest computations could easily be made manually since the interest rate of 2.5 per cent corresponded to an exact halfpenny per pound per month and interest was paid only on whole pounds for whole months. The objection to loose-leaf filing depended on a perceived threat to security, since it was almost impossible to lose an account or to create a phantom account by inserting a fresh page in a bound ledger book. In this latter case, the nature of the business set limits to the diffusion of modern office technology. In all three cases, however, note that conservative attitudes to new technology were consistent with economic efficiency. It is therefore important to note that in financial services, there was no substantial Anglo-American productivity difference before World War I.
Campbell-Kelly’s (1994) study of the Railway Clearing House is thus able to uncover examples of persistent inefficiency that remained sheltered from competitive
pressures. Thus, for example, the Office Appliances Committee established by the Railway Clearing House in 1920 recommended mechanising the calculation of local ton-mile statistics by buying six Comptometers at £100 16s 0d each (Campbell-Kelly, 1994: 70) Since this allowed the replacement of 70 male clerks by six female clerks, it yielded an annual saving of over £18,000 for a one-time outlay of a little over £600! Campbell-Kelly notes that there were many similar examples, none of which elicited any critical comment from the Office Compliances Committee. It is important that the Railway Clearing House was effectively a monopoly, free from the competitive pressures that would have forced the adoption of the efficient technology.
V. CONCLUSIONS
We began by considering a specific historical episode, the changing comparative productivity performance of Britain and the United States since 1870. We noted that (1) the United States overtook Britain in comparative productivity levels for the whole economy primarily as a result of trends in services rather than trends in industry (2) US overtaking of Britain in market services occurred during the transition to
standardised, high-volume, low-margin business with hierarchical management from the 1870s (3) this development was dependent on technologies that improved
communications and information processing
decentralised decision-making is a more suitable organisational form than a hierarchy with centralised decision making and monitoring for carrying out customised ventures where venture members must make decisions in the light of individual information (2) a hierarchy is a more suitable organisational form than a network for carrying out standardised ventures where the decisions of venture members depend on common venture-wide information rather than individual information (3) a rise in venture scale or decrease in monitoring cost increases the feasibility of hierarchies and decreases the feasibility of networks (4) technological change that favours large scale
standardised ventures may create difficulties of adjustment for a society with a history of success based upon (and hence social capabilities suited to) networks.
Finally, we drew out three general lessons that follow from this historical and theoretical analysis. First, an understanding of the major changes in comparative productivity performance among modern economies requires an understanding of developments in services. The study of economic growth has been focused for too long on industry. This point has been made recently by Bernard and Jones (1996) for the period since 1970, but it applies equally to the previous century. Second, different technologies and organisational forms can co-exist efficiently. This has been
recognised in the literature on manufacturing with the co-existence of mass
TABLE 1: Comparative U.S./U.K. labor productivity levels by sector, 1869/71 to 1990 (U.K.=100)
Agriculture Industry Services Aggregate economy
1869/71 86.9 153.6 85.8 89.8
1889/91 102.1 164.5 84.2 94.1
1909/11 103.2 193.5 107.3 117.7
1919/20 128.0 198.2 119.0 133.3
1929 109.7 222.9 121.2 139.4
1937 103.3 190.6 120.0 132.6
1950 126.0 243.9 140.8 166.9
1973 131.2 215.1 137.3 152.3
1990 151.1 163.0 129.6 133.0
Notes: Benchmark estimates of comparative productivity levels for 1937 are projected to other years using time series for output and employment from historical national accounting sources.
Sources: Derived from Broadberry (1997b).
TABLE 2: Comparative U.S./U.K. labor productivity levels in market services, 1869/71 to 1990 (U.K.=100)
Transport & communications
Distribution Finance, professional & personal services
1869/71 110.0 66.9 64.1
1889/91 167.1 97.0 53.2
1909/11 217.4 120.0 77.9
1919/20 250.6 109.0 103.6
1929 231.5 121.9 101.5
1937 283.4 119.8 96.1
1950 348.4 135.2 111.5
1973 303.3 149.6 118.0
1979 302.7 153.8 118.3
1990 270.5 166.0 101.0
Notes: Benchmark estimates of comparative productivity levels for 1937 are projected to other years using time series for output and employment from historical national accounting sources.
[image:31.595.87.391.433.629.2]TABLE 3: Benchmark estimates of U.S./U.K. comparative labor productivity levels in market services, 1870-1993 (U.K.=100)
1870 1890 1910 1924 1930 1937
Railways 76.2 158.2 215.5 342.2 447.9 390.6
Communications 143.5 136.1 166.5 270.0
Distribution 118.7 119.8
Finance 43.3 68.9 119.9 155.8 103.0 86.4
1950 1968 1993
Railways 620.7 395.0 370.3
Road transport 167.2
Shipping 170.0
Air transport 152.0
Communications 144.6 302.0 152.9
Distribution 148.4 143.6
Finance 138.7 117.7
Notes: Benchmark estimates based on direct observation for the years stated. Sources: Broadberry (1997b). Railway estimates for 1870 and 1890 derived from Fishlow (1966), Mitchell (1988), Cain (1980) and Hawke (1970). Additional figures for 1968 from Pryke (1971), for 1973 from Smith et al. (1982), for 1993 from O’Mahony et al. (1998).
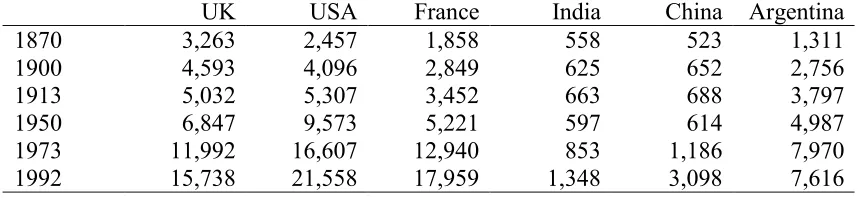
TABLE 4: GDP per capita, 1870-1992 (dollars of 1990 purchasing power)
UK USA France India China Argentina
1870 3,263 2,457 1,858 558 523 1,311
1900 4,593 4,096 2,849 625 652 2,756
1913 5,032 5,307 3,452 663 688 3,797
1950 6,847 9,573 5,221 597 614 4,987
1973 11,992 16,607 12,940 853 1,186 7,970
1992 15,738 21,558 17,959 1,348 3,098 7,616
[image:32.595.83.514.506.605.2]TABLE 5: Educational enrolment rates per 1000 population under age 20, 1870-1990
A. Britain
Primary Secondary Higher
1871 118.6
1881 238.4
1891 285.8
1901 344.7 1.6
1911 374.1 11.1
1921 371.8 24.1 3.8
1931 380.6 31.7
1938 357.1 37.1 4.8
1951 323.1 164.4 8.7
1961 299.8 233.2 13.9
1971 337.4 258.0 26.0
1981 327.4 327.4 30.5
1991 333.1 279.1 46.8
B. United States
Primary Secondary Higher
1870 390.6 4.2
1880 404.5 4.6
1890 492.5 10.3
1900 478.9 18.7
1910 475.6 26.8
1920 472.9 56.1 15.8
1930 479.2 99.6 23.1
1938 472.2 147.1 29.8
1950 409.6 125.2 52.0
1960 436.6 138.6 62.5
1970 443.0 187.4 111.5
1980 389.0 248.7 167.0
1990 434.1 213.3 191.1
Sources: Britain: Primary and secondary school enrolments: Mitchell (1988: 799-810); Education Statistics for the United Kingdom; Higher enrolments: Halsey (1988: 270-272); Education Statistics for the United Kingdom; Population: Mitchell (1988: 15); Annual Abstract of Statistics.
TABLE 6: Union density in services, Great Britain, 1892-1971 (%)
1901 1911 1921 1931 1951 1961 1971
Railways 11.3 16.9 59.1 55.3 84.8 85.1 91.2
Road transport 14.6 33.3 59.2 48.8 93.0 91.8 85.4 Sea transport 10.6 83.3 73.4 55.7 80.4 84.0 89.8 Inland waterways 38.2 86.0 80.2 67.4 90.2 77.3 82.6
Air transport 56.1 49.3 68.9
Post &
telecommunications
42.7 59.2 64.2 62.4 81.2 85.3 84.9
Distribution 2.7 5.4 9.0 7.2 15.0 12.3 11.6
Insurance, banking & finance
2.4 6.7 22.4 17.5 29.5 31.3 34.7
Source: Bain and Price (1981).
TABLE 7: Telephones per 100 population, 1900-1980 Total telephones Business telephones
U.K. U.S. U.K. U.S.
1900 0.005 1.8
1905 0.08 4.9
1910 0.2 8.3
1915 1.7 10.5
1920 2.0 12.5 4.0
1925 2.9 14.6 2.1 4.8
1930 4.1 16.3 2.9 5.6
1935 5.1 13.7 3.4 5.0
1940 6.9 16.6 4.1 6.4
1950 10.2 28.4 6.2 8.5
1960 15.0 41.3 8.4 11.6
1970 25.1 59.0 12.3 16.2
1980 47.5 79.6 17.4 21.1
Sources: U.K.: Total and business telephones: Mitchell (1988: 566-567);
[image:34.595.85.380.376.587.2]TABLE 8: Office machine sales per 1000 population, 1908-1968 A. Typewriters (units)
1908 1924 1930 1935 1948 1958 1968
U.K. 0.50 1.29 1.32 1.78 1.74 3.65 5.70
U.S. 1.13 3.68 4.34 6.08 7.76 8.91 18.62
B. Cash registers, calculating machines and other office machinery (£ at constant
1929 prices)
1930 1935 1948 1958 1968
U.K. 28.3 33.3 106.0 289.5 509.2
U.S. 128.9 187.8 252.1 757.6 2,352.6
FIGURE 1: Customised venture
FIGURE 2: Standardised venture Utility N C C N C B 0 N C δ 1 Utility 0 R u
FIGURE 3: Interactions between scale and organisation
(a) Scale and hierarchy
(b) Scale and networks
Monitoring cost
0
Utility
N K C
N K B
0 N
K
δ 1
Scale Feasibility constraint
A B
N K' δ N
K B '
N K C '
FIGURE 4: Adjustment costs
Utility
0 R u
( )
w nu* w
+ − 1 K
M qK
S
+ − 1 ' '
K M qK
S w'*
G uR +
REFERENCES
Abramovitz, M. (1986), “Catching Up, Forging Ahead and Falling Behind”, Journal of Economic History, 46, 385-406.
Anderson, G. (1976), Victorian Clerks, Manchester: Manchester University Press. Bain, G.S. and Price, R. (1980), Profiles of Union Growth: A Comparative Statistical
Portrait of Eight Countries, Oxford: Blackwell.
Bernard, A.B. and Jones, C.I. (1996), “Comparing Apples to Oranges: Productivity Convergence and Measurement Across Industries and Countries”, American Economic Review, 86, 1216-1238.
Booth, A. (2001), The British Economy in the Twentieth Century, Basingstoke: Palgrave.
Boyce, G. (1995), Information, Mediation and Institutional Development: The Rise of Large-Scale Enterprise in British Shipping, 1870-1919, Manchester:
Manchester University Press.
Braverman, H. (1974), Labor and Monopoly Capital: The Degradation of Work in the Twentieth Century, New York: Monthly Review Press.
Broadberry, S.N. (1997a), The Productivity Race: British Manufacturing in International Perspective, 1850-1990, Cambridge: Cambridge University Press.
Broadberry, S.N. (1997b), “Forging Ahead, Falling Behind and Catching-Up: A Sectoral Analysis of Anglo-American Productivity Differences, 1870-1990”, Research in Economic History, 17, 1-37.
Broadberry, S.N. (1998), “How did the United States and Germany Overtake Britain? A Sectoral Analysis of Comparative Productivity Levels, 1870-1990”, Journal of Economic History, 58: 375-407.
Broadberry, S.N. and Crafts, N.F.R. (1992), “Britain’s Productivity Gap in the 1930s: Some Neglected Factors”, Journal of Economic History, 52, 531-558.
Broadberry, S.N. and Ghosal, S. (2002), “From the Counting House to the Modern Office: Explaining Anglo-American Productivity Differences in Services, 1870-1990”, Journal of Economic History, (forthcoming).
Cain, P.J. (1980), “Private Enterprise or Public Utility? Output, Pricing and Investment on English and Welsh Railways, 1870-1914”, Journal of Transport History, (3rd series), 1, 9-28.
Calomiris, C. (1995), “The Costs of Rejecting Universal Banking: American Finance in the German Mirror, 1870-1914”, in Lamoreaux, N.R. and Raff, D.M.G. (eds.), Coordination and Information: Historical Perspectives on the Organization of Enterprise, Chicago: Chicago University Press.
Campbell-Kelly, M. (1992), “Large-scale Data Processing in the Prudential, 1850-1930”, Accounting, Business and Financial History, 2, 117-139.
Campbell-Kelly, M. (1994), “The Railway Clearing House and Victorian Data Processing”, in Bud-Frierman, L. (ed.), Information and Acumen: The Understanding and Use of Knowledge in Modern Business, London: Routledge, 51-74.
Campbell-Kelly, M. (1998), “Data Processing and technological Change: The Post Office Savings Bank, 1861-1930”, Technology and Culture, 39, 1-32.
Cassis, Y. (1994), City Bankers, 1890-1914, Cambridge: Cambridge University Press. Chandler, A.D., Jr. (1977), The Visible Hand: The Managerial Revolution in
American Business, Cambridge, MA: Harvard University Press.
Comparative Perspectives on the Rise of the Modern Industrial Enterprise, Cambridge, MA: Harvard University Press, 9-40.
Cortada, J.W. (1993), Before the Computer: IBM, NCR, Burroughs andRemington Rand and the Industry they Created, 1865-1956, Princeton, NJ: Princeton University Press.
Feinstein, C.H. (1972), National Income, Expenditure and Output of the United Kingdom, 1855-1965, Cambridge: Cambridge University Press.
Field, A.J. (1996), “The Relative Productivity of American Distribution, 1869-1992”, Research in Economic History, 16, 1-37.
Fishlow, A. (1966), “Productivity and Technological Change in the Railroad Sector, 1840-1910”, in Brady, D.S. (ed.), Output, Employment and Productivity in the United States After 1800, Studies in Income and Wealth Volume Thirty, New York: National Bureau of Economic Research and Columbia University Press. Foreman-Peck, J. and Millward, R. (1994), Public and Private Ownership of British
Industry, 1820-1990, Oxford: Clarendon Press.
Goldin, C. (1998), “America’s Graduation from High School: The Evolution and Spread of Secondary Schooling in the Twentieth Century”, Journal of Economic History, 58: 345-374.
Goldin, C. (2001), “The Human-Capital Century and American Leadership: Virtues of the Past”, Journal of Economic History, 61, 263-292.
Guerriero Wilson, R. (1998), Disillusionment or New Opportunities? The Changing Nature of Work in Offices, Glasgow 1880-1914, Aldershot: Ashgate.
Hall, M., Knapp, J. and Winsten, C. (1961), Distribution in Great Britain and North America: A Study in Structure and Productivity, Oxford: Oxford University Press.
Hannah, L. (1974), “Managerial Innovation and the Rise of the Large-Scale Company in Interwar Britain”, Economic History Review, 27(2), 252-270.
Halsey, A.H. (ed.) (1988), Trends in British Society Since 1900: A Guide to the Changing Social Structure of Britain, (2nd edition), London: Macmillan. Hawke, G.R. (1970), Railways and Economic Growth in England and Wales,
1840-1870, Oxford: Oxford University Press.
Imlah, A.H. (1958), Economic Elements in the Pax Britannica: Studies in British Foreign Trade in the Nineteenth Century, New York: Russell & Russell. Jones, G. (1993), British Multinational Banking, 1830-1990, Oxford: Clarendon
Press.
Jones, G. (2000), Merchants to Multinationals: British Trading Companies in the Nineteenth and Twentieth Centuries, Oxford: Oxford University Press. Kynaston, D. (2001), The City of London, Volume IV: A Club No More, 1945-2000,
London: Chatto & Windus.
Lewchuk, W. (1987), American Technology and the British Vehicle Industry, Cambridge: Cambridge University Press.
Lindert, P.H. (2001), “Democracy, Decentralization, and Mass Schooling Before 1914: Appendices”, Working Paper No.105, Agricultural History Center, University of California, Davis.
Lockwood, D. (1958), The Blackcoated Worker: A Study in Class Consciousness, London: Allen and Unwin.
McCloskey, D.N. (1990), If You’re So Smart: The Narrative of Economic Expertise, Chicago: University of Chicago Press.
Maddison, A. (1991), Dynamic Forces in Capitalist Development, Oxford: Oxford University Press.
Maddison, A. (1995), Monitoring the World Economy, 1820-1992, Paris: Organisation for Economic Co-operation and Development.Mitch, D.F. (1992), The Rise of Literacy in Victorian England: The Influence of Private Choice and Public Policy, Philadelphia, PA: University of Pennsylvania Press. Mitchell, B.R. (1988), British Historical Statistics, (second edition) Cambridge:
Cambridge University Press.
O’Mahony, M., Oulton, N., and Vass, J. (1998), “Market services: Productivity Benchmarks for the UK”, Oxford Bulletin of Economics and Statistics, 60, 529-551.
Ohkawa, K. and Rosovsky, H. (1973), Japanese Economic Growth: Trend Acceleration in the Twentieth Century, Stanford, CA: Stanford University Press.
Perkins, E.J. (1999), Wall Street to Main Street: Charles Merrill and Middle-Class Investors, Cambridge: Cambridge University Press.
Pryke, R. (1971), Public Enterprise in Practice: The British Experience of Nationalization over Two Decades, London: MacGibbon & Kee.
Ringer, F.K. (1979), Education and Society in Modern Europe, Bloomington, IN: Indiana University Press.
Rubinstein, W.D. (1993), Capitalism, Culture and Decline in Britain, 1750-1990, London: Routledge.
Sabel, C. F. and Zeitlin, J. (eds.) (1997), World of Possibilities: Flexibility and Mass Production in Western Industrialization, Cambridge: Cambridge University Press.
Sayers, R.S. (1976), The Bank of England, 1891-1944, (2 volumes + appendices), Cambridge: Cambridge University Press.
Smith, A.D., Hitchens, D.M.W.N. and Davies, S.W. (1982), International Industrial Productivity: A Comparison of Britain, America and Germany, Cambridge: Cambridge University Press.
Tedlow, R. (1990), New and Improved: The Story of Mass Marketing in America, New York: Basic.
Tyack, D.B. (1967), (ed.), Turning Points in American Educational History, Lexington, MA: Xerox.
White, E. N. (2000), “Banking and Finance in the Twentieth Century”, in Engerman, S.L. and Gallman, R.E. (eds.), The Cambridge Economic History of the United States, Volume III: The Twentieth Century, Cambridge: Cambridge University Press, 743-802.