Bachelor thesis in completion of the bachelor mental health promotion at the faculty
psychology of the University of Twente.
Titel:
Is there a negative influence of fatigue on Quality of life?
Supervisors:
Dr. E. Taal & Dr. C. Bode
Date:
June 2011
Author:
Amaia Borde Ondarra Nurmistraße 36
48301 Nottuln, Germany (t) 02502-25313
Table of Contents
1.
Abstract……….….1
2.
Abstract (NL)……….…2
3.
Introduction...3
3.1
Arthritis………...3
3.2
Fatigue………4
3.3
Quality of life concept………....5
3.4
The relationship between fatigue and role-physical functioning………...6
3.5
The relationship between fatigue and social functioning………...7
3.6
The relationship between fatigue and role-emotional functioning………...7
3.7
The relationship between fatigue and mental health………...8
3.8
In summary………...………..9
3.9
Usefulness of the study……….……. 10
3.10 Assumptions and Research questions of the current study……….. 11
4.
Methods………13
4.1
Participants………13
4.2
Procedure………...18
4.3
The measure of fatigue……….………18
4.4
The measure of health related Quality of life………...19
4.5
The measurement of pain………..24
4.6
Analysis……….24
5.
Results………...27
5.1
Correlations among the concepts……….……27
6.
Discussion……….35
6.1
Findings – Methodological reasons……….……….35
6.1.2 Findings – Content reasons………...36
6.1.3 Fatigue coping………37
6.1.4 Social functioning………..39
6.2
Limitations of the study………..……...39
6.3
Implications………...40
6.4
Treatment options………..………...41
7.
Conclusion………...44
8.
References...46
9.
Appendix………...52
9.1
Appendix A: The SF-36v2……….……..52
1. Abstract
Objectives. Fatigue is a commonly experienced symptom of patients with musculoskeletal diseases. The purpose of this study was to identify the extent to which fatigue interferes with the patients’ physical and psychological
quality of life while controlling for the effects of pain and physical functioning.
Methods. Participants were 207 patients with musculoskeletal diseases of an Outpatient clinic for Rheumatology in Enschede, the Netherlands. The correlation coefficients were calculated between four dimensions of health
related quality of life, fatigue, pain and physical functioning. In addition, a two-step bloc wise regression
analysis was conducted in order to find out what the unique informative value of fatigue is in the explanation of
health related quality of life. In the first step, pain and physical functioning served as independent variables,
while in the second step three dimensions of fatigue (fatigue severity, effect and coping) were attached as
additional independent variables.
Results. Strong correlations were found between the four concepts of quality of life as measured by the SF-36. In addition, relative strong correlations were found between the independent variables, especially among the
three dimensions of fatigue and between pain, fatigue severity and effect. After controlling for physical
functioning and pain, fatigue explained between 4.2% and 8.2% of patients role, social and psychological
functioning.
Conclusions. The current study indicates that RA related fatigue is – besides pain – an important factor in the explanation of patients health related quality of life. As RA fatigue affects quality of life, an intervention that
improves the impact of fatigue might be expected to change the wider well-being of patients. A combined
2. Abstract (NL)
Doelstellingen. Vermoeidheid is een algemeen ervaren symptoom van patiënten met aandoeningen van het bewegingsapparaat. Het doel van deze studie was om de mate waarin vermoeidheid interfereert met de patiënten
fysieke en psychische kwaliteit van leven te identificeren, terwijl voor de effecten van pijn en fysiek
functioneren werd gecontroleerd.
Methoden. De deelnemers waren 207 patiënten met aandoeningen van het bewegingsapparaat van een polikliniek voor Reumatologie in Enschede, Nederland. De correlatiecoëfficiënten werden berekend tussen de
vier dimensies van de gezondheid gerelateerde kwaliteit van leven, vermoeidheid, pijn en fysiek functioneren.
Daarnaast werd een twee-staps blok regressie-analyse uitgevoerd om erachter te komen wat de unieke
informatieve waarde van vermoeidheid is in de verklaring van de gezondheid gerelateerde kwaliteit van leven. In
de eerste stap, pijn en fysiek functioneren diende als onafhankelijke variabelen, terwijl in de tweede stap drie
dimensies van vermoeidheid (vermoeidheid ernst, effect en coping) werden toegevoegd als bijkomende
onafhankelijke variabelen.
Resultaten. Sterke correlaties werden gevonden tussen de vier concepten van kwaliteit van leven zoals gemeten door de SF-36. Daarnaast werden relatief sterke correlaties gevonden tussen de onafhankelijke variabelen, vooral
bij de verschillende dimensies van vermoeidheid en vermoeidheid ernst, effect en pijn. Na controle voor fysiek
functioneren en pijn, verklaarde vermoeidheid tussen 4.2% en 8.2% van de patiënten rol, sociaal en psychisch
functioneren.
Conclusies. RA gerelateerde vermoeidheid is - naast de pijn - een belangrijke factor in de verklaring van de gezondheid gerelateerde kwaliteit van leven. Als RA vermoeidheid invloed heeft op de kwaliteit van leven, zou
een interventie die de impact van vermoeidheid verbetert naar verwachting ook de rest van het welzijn van
patiënten verhogen. Een gecombineerde behandeling van pijn, fysiek functioneren en vermoeidheid is mogelijk
3. Introduction
The following research will concentrate on established disabling musculoskeletal diseases in general and
especially on Rheumatoid arthritis (RA).
Because fatigue proved to be an important but still neglected factor in RA treatment, the current study
concentrates on this symptom in order to further strengthen the awareness that fatigue is a serious aspect of
musculoskeletal diseases with far reaching consequences on the person’s daily life. Because it turned out that
fatigue is – besides pain – the most annoying symptom to handle (Hewlett et al., 2005), new knowledge about
the relationship between fatigue and psychological and physical functioning might help to inform about new
strategies and to improve existing treatments to combat fatigue.
I will include all forms of musculoskeletal diseases in my analysis, although most current explanation focus on
RA and I will refer mainly to that literature. Thus, RA patients will be the focus of my interpretation efforts. This
makes sense not only because most literature refers to RA, but also because RA patients constitute the majority
of the actual study sample.
3.1 Arthritis
Arthritis is a term used to describe a group of conditions that is characterized by damage to the joints of the
body, which results in symptoms as pain, swelling, stiffness and reduced movement. Today over 100 different
forms of arthritis are known. The most common types of arthritis include Osteoarthritis, Rheumatoid arthritis
(RA) and Gout (“Arthritis Basics”, 2005).
RA is a long-lasting systematic and chronic inflammatory disease which is causing joint pain, destruction and
swelling. A result of the disease is that the immune system mistakenly attacks itself which leads to the swellings
of the joints. The most frequently affected parts of the body involve the hands, wrists and knees. The
inflammation may spread to nearby tissue and finally damage cartilage and bones. In the most severe cases of
RA, the disease can also lead to a destruction of the skin, eyes, lungs or wrist joints (“Arthritis Basics”, 2005).
Around 1% of the population in western countries is affected by the disease and women are stricken three times
3.2 Fatigue
The majority of the RA patients report – besides pain – a considerable amount of fatigue (Rupp, Boshuizen,
Jacobi, Dinant & Van de Bos, 2004). Because of differences in the definition of fatigue and its measurement,
prevalence rates vary between 42% and 80% in RA patients (Repping-Wuts, Van de Riel & Van Achterberg,
2008).
Affected individuals described fatigue as an “overall sense of tiredness and heaviness that was associated with a
desire to sleep” and as “the kind of fatigue which one never recuperates from” (Tack, 1990). Other patients
described fatigue as “an overwhelming, sustained sense of exhaustion and decreased capacity for physical and
mental work” (Repping-Wuts et al., 2008). Chronic fatigue can be constant or recurrent, it is not improved
easily by sleep or rest and it can have considerable negative impact on the person’s quality of life.
Most RA patients report that fatigue is present on most days and that fatigue varies in intensity and frequency
(Hewlett, Nicklin & Treharne, 2008). Affected people likewise described sudden and overwhelming “wipe outs”
that come without warning. In general, two different types of fatigue are described by patients: fatigue can be
experienced as heaviness or weight and as an extreme and overwhelming exhaustion which forces the patient to
stop immediately his or her current activity and to lie down. This later form of fatigue usually has a sudden and
dramatic onset and is experienced as unpredictable (Hewlett et al., 2005). Thus, patients clearly differentiated
fatigue from “normal” tiredness as experienced by healthy individuals (Hewlett et al., 2005).
Furthermore, patients usually distinguish between a sort of physical and mental fatigue (Nikolaus, Bode, Taal &
Van de Laar, 2010).
There seems to be a J-shaped curve in the strength of fatigue throughout the day: levels of fatigue become less in
the course of the morning and increase to a peak in the late evening hours (Stone, Broderick, Porter & Kaell,
1997). Likewise, the characteristic course of the disease creates a J-shaped curve: the initial fall of medical
complaints is due the instant benefits of treatment and the subsequent gradual increase of problems is due to the
inability of contemporary medical treatments to fully suppress or prevent the damage of the joints (Pollard, Choy
3.3 Quality of life concept
The quality of life concept used in the actual study calls for some further explanation. Originally, the concept of
physical functioning is often used along with several other dimensions of role-, social and psychological
functioning as an indicator of health related quality of life. In contrast, in the actual case, physical functioning is
treated as a cause of impairments rather than an indicator of well-being per se. Thus, physical functioning served
as independent control variable when I tried to understand the patients’ quality of life impairments. For a good
comprehension I will use the world quality of life to refer to the role-, social and psychological functioning of
patients while excluding all forms of physical functioning. At the same time, one must keep in mind that this
distinction is frequently not made in previous measurements and studies of health related quality of life with the
consequence that this concept remains somewhat ambivalent.
3.4 The relationship between fatigue and role - physical functioning
The concept of role-physical functioning is used to refer to impairments in the fulfilment of daily roles as a
consequence of disease related physical restrictions.
In a recent longitudinal study, it turned out that RA related physical fatigue and pain have a statistically
significant relationship with limitations in physical activities of affected individuals. Patients who experience
higher amounts of exhaustion and pain are especially likely to reduce physical activities (Rupp et al., 2004).
Affected individuals report a loss of physical energy and a heightened need for rest (Hewlett, 2005). In line with
this, the majority of patients state that they are constricted in their activities and their mobility because of fatigue
(Nikolaus et al., 2010). Several RA patients report that physical play with their children is severely impaired and
that fatigue in general constrains their ability to fulfil their normal roles within the family. The interviewed
persons justified their reduced activity level by stating that they must preserve their restricted energy for the most
important daily activities (Hewlett et al., 2008).
In addition, physical impairments due to fatigue are an important reason why numerous RA patients become
unable to work. Increased physical impairments frequently lead to work disability which in turn is associated
with considerable individual and economic harm. It has been assessed that RA accounts for round 2.5 billion
dollar in lost wages each year (Kosinski, 2002).
In sum, on the basis of the current literature, I assume that level of fatigue and the ability to maintain daily roles
3.5 The relationship between fatigue and social functioning
The concept of social functioning is used to describe patients’ ability to sustain their social contacts and leisure
activities.
In a study by Rupp et al. (2004) it was found that the maintenance of a social life is negatively influenced by
physical fatigue, reduced activity, pain and depressive symptoms. Especially women felt that fatigue negatively
influenced their social contacts because they regularly have to cancel appointments because they feel
overwhelmed by fatigue (Nikolaus et al., 2010). Fatigue is a frequently mentioned cause to explain why RA
patients give up enjoyable leisure activities and hobbies. Patients report that they feel that they must save their
energies for the more essential duties of everyday life (Hewlett et al., 2008).
Several women likewise reported that fatigue makes it harder for them to help und support other people in their
surrounding (Nikolaus et al., 2010).
In the light of these findings, I assume that I will find a negative relationship between levels of fatigue and the
ability to maintain social contacts for RA patients.
3.6 The relationship between fatigue and role-emotional functioning
The concept of role-emotional functioning is used to describe the extent of limitations in the fulfilment of daily
roles as a consequence of disease related emotional problems.
Role limitations due to negative emotions were found to be statistically significant correlated with symptoms of
depression, pain, reduced activity and mental fatigue (Rupp et al., 2004).
The far-reaching consequences of fatigue reduce the patients’ self-esteem, heighten irritability, bitterness and
feelings of loss of control and usefulness (Hewlett et al., 2005). In addition, some women felt that they are
unable to work in certain occupations while others stated that they are frequently tired and worn out at work
which makes it difficult to concentrate (Nikolaus et al., 2010).
For this reason, I expect to find a negative relationship between fatigue and the fulfilment of daily roles as a
3.7 The relationship between fatigue and mental health
Mental health is not alone indicated through the absence of psychological distress. Rather, mental health
describes a state in which a person acknowledges his or her abilities, is able to cope with normal levels of stress
and can productively work and contribute to the functioning of his or her community (“Mental health:
strengthening our responses”, 2010).
RA patients who experience a considerable amount of fatigue are likely to report worse mental health than the
general population. A possible explanation is that restrictions due to fatigue in an array of life domains give rise
to a broad array of negative emotional consequences. Frustration, irritability, loss of control, bitterness and
tearfulness are often experienced by RA patients (Hewlett et al., 2008).
A recent qualitative study indicated that especially younger women with several daily roles reported negative
emotions as a response to RA fatigue (Nikolaus et al., 2010). Women described their condition as “being
oversensitive, becoming irritated more quickly, not being able to deal with things or being catty” (Nikolaus et al.,
2010). Furthermore, women reported that they are frequently angry, in a bad or sad mood, feeling miserable,
rebellious, frustrated, anxious, self-pitying and misunderstood (Nikolaus et al., 2010).
Overall, mental health was found to be negatively associated with depressive symptoms and mental fatigue
(Rupp et al., 2004). Depression, which is frequently related to a higher level of fatigue, is assumed to be present
in at least 25% of all RA patients (Frank, Beck & Parker, 1988).
However, because of an overlap of symptoms in depression and RA (such as fatigue, insomnia or less appetite),
it is still challenging to reliable asses depression in RA patients and results must be interpreted with some
cautious (Blalock & DeVellis, 1992).
In general, greater trait anxiety is likely to exaggerate the effects of fatigue (Mancuso, Rincon, Sayles & Paget,
2006). Likewise, people with a history of mood disorders, such as depression or generalized anxiety, run a higher
risk to experience a considerable amount of fatigue (Filfield, McQuillian & Tennen, 2001). Poorer mood in
everyday life and daily stress also increase fatigue experiences (Schanberg, Sandstrom & Starr, 2000).
Likewise, the perception that RA will have severe negative consequences is usually followed by increased
fatigue (Treharn, Lyons & Hale., 2008). Similarly, lower self- efficacy and perceived personal control over the
course of the disease give rise to more complaints regarding fatigue (Brekke, Hjortdahl & Kvien, 2001).
Thus, current research suggests that I will find a negative relationship between fatigue and the general mental
3.8 In summary
RA patients report considerable diminished functioning and overall well-being compared to the general
population (Kosinski et al., 2002). Disease related fatigue turned out to be a key determinant in patients` health
related well-being. In a recent study, fatigue explained between 1% and 14% in the variance of RA patients`
health related quality of life (Rupp et al., 2004). The consequences of fatigue seem to permeate into every sphere
of life. Many activities are reduced extremely or are stopped completely. Patients undergo restrictions in
everyday tasks, in the work domain and leisure activities (Hewlett et al., 2008). Many RA patients believe that
fatigue restricts them in housekeeping, gardening and childcare (Hewlett, 2008). Affected people likewise
struggle to maintain social engagements and close relationships (Hewlett et al., 2008).
3.9 Usefulness of the study
Because currently there is no well-established treatment that prevents or cures RA, the primary management aim
is to reduce disability in RA patients and improve their overall quality of life (Pollard et al., 2005).
In general, fatigue is likely to aggravate pain and disability. When treatment addresses fatigue, a wider cluster of
symptoms is likely improve as a consequence (Hewlett et al., 2005).
Nevertheless, both patients and medical professionals still lack knowledge about how to best manage fatigue and
actual treatment primary concentrate on pain release (Repping-Wuts et al., 2009).
In line with this, current treatment primarily leads to an improvement in the physical functioning and pain
experience of RA patients. Attendances for the improvement of emotional health and well-being are less well
developed (Kosinski, 2002). Thus, further understanding of the social and emotional aspects of the disease
become now increasingly important.
One can conclude that it is necessary to collect more information about the nature of fatigue and its relationship
with health related quality of life. More needs to be done to optimise the effects of treatment which partly
depends on the routine measurement of disease’s impact. Additional knowledge about fatigues influence of
quality of life might be used to further strengthen the awareness that fatigue is a severe symptom which should
be addressed in RA treatment. Likewise, more knowledge about the relationship between fatigue and quality of
3.10 Assumptions and Research questions of the current study
The examination is based on the assumption that those individuals who experience higher amounts of fatigue
will also report lower levels of health related quality of life and those patients who have more negative quality of
life experiences on a regular basis will likewise experience more fatigue. Thus, I expect that data will reveal a
bidirectional relationship between fatigue and four selected dimensions quality of life (role-physical functioning,
social functioning, role-emotional functioning, and mental health).
To test my assumption, the subsequent examination intents to answer the following general research question: Is
there a negative relationship between fatigue and health related quality of life?
In order to make this question more specific, four sub questions should be examined:
1. Is there a negative relationship between fatigue and role-physical functioning in patients with musculoskeletal
disease?
2. Is there a negative relationship between fatigue and social functioning in patients with musculoskeletal
disease?
3. Is there a negative relationship between fatigue and role-emotional functioning in patients with
musculoskeletal disease?
4. Is there a negative relationship between fatigue and general mental health in patients with musculoskeletal
disease?
Pain and/or physical functioning might operate as a third variable in the explanation of the relationship between
fatigue and impairments in the daily functioning of RA patients.
Physical functioning and bodily pain will serve as control variables in the analysis because current literature
suggests that fatigue correlates strongly with both pain and impaired physical functioning. Pain and disability, as
fatigue, negatively affect the patients psychological condition, social functioning and general feeling of
well-being (Katz & Yelin, 1993). In addition, fatigue generally correlates with depressive symptoms, pain, disturbed
sleep, increased physical effort and psychosocial factors (Huyser et al., 1998).
Thus, pain, physical functioning and fatigue along with several other factors are likely to form an interrelated
bundle of RA symptoms that are difficult to separate from one another. In addition, each symptom is likely to
have multiple causes. A combination of variables might be the underlying cause of both fatigue and related daily
life impairments.
The question is whether fatigue as a separate variable adds informative value to the explanation of RA symptoms
detached from the effects that pain and physical disability induce. Although little is yet known about the indirect
effect of these items, there seems to be widespread consensus over the far-reaching impact of fatigue on the daily
4. Methods
4.1 Participants
Altogether 207 patients in an Outpatient clinic for Rheumatology participated in the original survey. Overall, the
sample consisted of 69 men and 138 women with collectively 12 different diagnoses. Fewer men than women
participated in the survey which may reduce the generalizability of the results. However, the spreading of the
sample nearly corresponds to the epidemiological distribution in RA as women are more often affected by the
disease than men (Lipsky, 1994).
The mean age of the actual participant sample was 56 years (SD= 14. 92) with an age range from 19 years of the
youngest participant to 93 years of the oldest participant. The average disease duration was about 12 years
[image:13.595.46.513.389.780.2](SD=11.49).
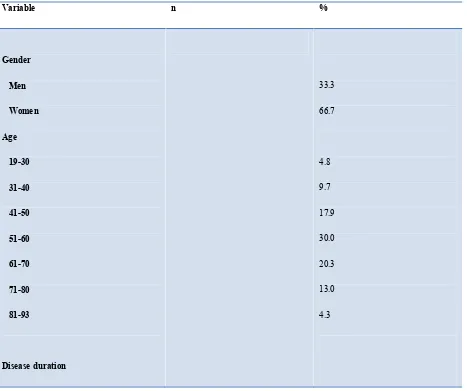
Table 1: Sociodemographic and disease characteristics of the study population (N=207)
Variable n %
Gender Men Women Age 19-30 31-40 41-50 51-60 61-70 71-80 81-93
Disease duration
33.3 66.7
0-10 11-20 21-30 31-40 41-50 51-60 Disease distribution RA Fibromyalgia Osteoarthritis Bechterew disease Psoriatic arthritis Articular gout Back pain Osteoporosis SLE Tendinitis Scleroderma Reiter`s syndrome Other Marital status Unmarried/living alone Unmarried/living with sb.
Unknown
Number of children No children
All children moved out Children at home a
Children at home b
Unknown
Education level No apprenticeship Basis education Lower work education c MAVO, (M)ULO d Middle work education e 5 year school f
Higher work education g University
Unknown
Working situation Fulltime Work Part time Work Household In education Out of work Inability to work h
Pensioners Unknown
15.5 26.1 0.5
a = all children are 15 years or older. b= at least one child is younger than 15 years. c=LBO, home economics course, LEAO, LTS etc. d= 3 year HBS,VMBO. e= for example MTS,
MEAO. f= HBS, HAVO, MMS, secondary school. g= for example HTS, HEAO. h= WAO/WIA.
Table 1 indicates that the biggest group in the sample consists of RA patients, followed by fibromyalgia,
osteoarthritis, Bechterew disease, psoriatic arthritis, articular gout, back pain and osteoporosis patients (N=223).
The remaining four disease patterns (SLE, Tendinitis, Scleroderma and Reiter’s syndrome) are to a marginal
extent present among the participants (n=5).
As shown in table 1, the majority of the participants in the current study are married and a substantial percentage
has at least one child (80.2 %). Among those participants that have offspring, around half of them no longer have
children living at home. This finding is probably explained through the fact that a greater percentage of older
participants with adult offspring participated in the current study.
As indicated in table 1, the education level of the participant sample is fairly regular distributed, with relatively
few participants without any apprenticeship and relatively few participants with a university degree.
Comparatively many participants work full or part time (38.6%), while few are students or out of work. A
considerable amount of all participants are unemployable. This condition might be a result of the patient’s
musculoskeletal disease. This explanation seems reasonable, since RA is a crucial risk factor of becoming
unemployed (Kosinski, 2002). About a quarter of the participants are pensioners. This is very likely a
consequence of the relative high age of the actual sample.
4.2 Procedure
Before they had their appointment with the rheumatologist, all patients were asked if they were willing to
participate in the current study. There was no money paid for the participation and we have no information about
which patients for what reasons refused to participate in the study. Altogether, 207 patients filled in
questionnaires on a computer via a touch screen in a Rheumatology clinic in the Netherlands.
Participants answered questions about demographic variables (sex, age, education, working situation and marital
status), disease related information (condition, disease duration), pain, general well-being, functional restrictions,
[image:16.595.45.512.71.146.2]4.3 The measurement of Fatigue
As qualitative research indicates, fatigue has several dimensions that are experienced to varying degrees by
different patients (Hewlett et al., 2005). For this reason, an instrument which assesses the three dimensions of
fatigue (severity, its impact and the perceived ability of patients to cope) independent from one another, is best
suited to capture the multidimensional nature of fatigue.
Research indicated satisfactory criterion and construct validity of the three visual analog scales used in the
current study (Nicklin et al., 2010), which makes them suitable measurement tools for the current purpose.
Three 100 mm visual analog scales with two descriptive anchors were used to measure the severity of fatigue, its
effect and the patient’s ability to cope with it. The following questions were provided:
Severity: “tip with your finger on the place of the line to indicate your overall severityof fatigue over the last
seven days (0= no fatigue, 100= “Absolutely no energy at all”).”
Effect: “tip with your finger on the place of the line to indicate the overall effect of fatigue for you over the last
seven days (0=no effect, 100= very strong effect).”
Coping: “tip with your finger on the place of the line to indicate your overall ability to cope with fatigue during
the last seven days (0= absolute not good, 100= very good).”
4.4 The measurement of health related quality of life
In order to measure health related quality of life, the second version of the SF-36 was used (see Appendix A).
The SF-36 questionnaire turned out to be practical, reliable and a valid tool for measuring physical and mental
well-being (Hewlett, Hehir & Kirwan, 2007). In general, it is assumed that the questionnaire can be completed
within five to ten minutes. The SF-36 questionnaire is a generic health survey because it can be used across age
groups (the only requirement is that participants must be 18 years or older) and across different diseases and
treatment conditions.
Overall, the questionnaire consists of 36 questions that measure physical functioning and mental health from the
patients’ point of view.
Items are grouped into 8 scales: Physical function (PF), role-physical (RP), bodily pain (BP), general health
(GH), vitality (VT), social functioning (SF), role-emotional (RE) and mental health (MH). For the purpose of the
current study, four of the eight subscales of the SF-36 were analysed in more details in order to explore the
patients’ health related quality of life (the RP, SF, RE, MH scales). In addition, the PF scale serves as
independent control variable.
The eight scales of the SF-36 survey were selected from initially 40 scales used in a Medical Outcomes Study.
addition, these concepts were most likely to respond to varying courses of the disease and to treatment (Pollard
et al., 2005).
Chronbach´s alpha was calculated in order to check for the internal consistency and reliability of the four
constructs of quality of life that are measured by the SF-36 (RE, SF, RP & MH) as well as physical functioning,
which serves as control variable.
Chronbach´s alpha reliability coefficient ranges from 0 to 1, whereby values closer to 1 indicate greater internal
consistency of the items in a scale. George and Mallery (2003) provide the following rules of thumb to rank
Chronbach`s alpha:
α > .9 = excellent, α > .8 = good, α > .7 = acceptable, α > .6 = questionable, α > .5 = poor, and α < .5
=Unacceptable. Following these rules, the actual Chronbach`s alpha for the five dimensions of the SF-36 ranges
somewhere between good and excellent. The highest Chronbach`s alpha was found for role emotional
functioning (α= .947), followed by role physical functioning (α=. 937), physical functioning (α .908), social
functioning (α= .845) and finally mental health (α= .800). Because the internal consistency turned out to be
satisfying for all scales of the SF-36 that were used in this study, the SF-36 questionnaire turned out to be a
[image:18.595.70.545.421.784.2]reliable measurement tool for the current research purpose.
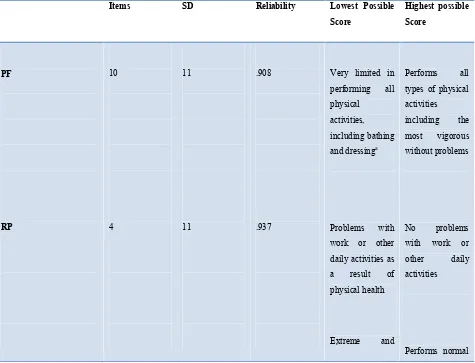
Table 2: Summary of Information about SF-36 Scales and Physical and Mental component Summary Measures
Items SD Reliability Lowest Possible Score
Highest possible Score PF RP 10 4 11 11 .908 .937
Very limited in performing all physical
activities, including bathing and dressinga
Problems with work or other daily activities as a result of physical health
Extreme and
Performs all types of physical activities including the most vigorous without problems
No problems with work or other daily activities
a
[image:19.595.68.547.70.505.2]From “SF36: Physical and Mental Summary Scales: A User's Manual”, by Ware, Kosinski & Keller (1994).
Table 2 offers an overview about some characteristics of the SF-36 questionnaire, including a description of the
meaning of high and low scores for each scale.
The 3-point physical functioning scale, which serves as control variable in the current study, consists of 10 items
that measure limitation in physical activities as a consequence of health problems. Possible answer options for
items of this scale range from “serious impaired” to “slightly impaired” until “not at all impaired”. In line with
this, lower scores on this scale indicate impaired physical functioning, while high scores signal good functioning
in the physical realm.
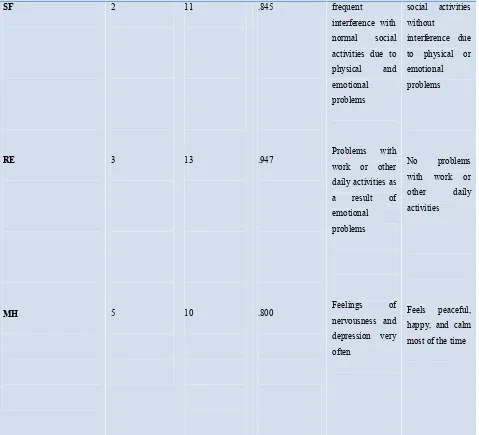
The 5-point social functioning scale contains two items that assess the extent to which patients are able to
maintain social contacts and appointments. Lower scores on this scale indicate an impaired social functioning,
while individuals with high scores are able to maintain social contacts and appointments without interference.
SF RE MH 2 3 5 11 13 10 .845 .947 .800 frequent
interference with normal social activities due to physical and emotional problems
Problems with work or other daily activities as a result of emotional problems
Feelings of nervousness and depression very often
social activities without
interference due to physical or emotional problems
No problems with work or other daily activities
The 5-point role emotional scale consists of three items that assess limitations in the patients’ usual roles because
of emotional problems. The answer options range from “always impaired” to “never impaired”. Thus, lower
scores on this scale suggest impaired daily functioning as a consequence of emotional problems, while higher
scores indicate the absence of impairments.
The 5-point mental health scale is made of five items that measure psychological distress and general mental
health as experienced by RA patients. Answer options of items vary from “always” affected by negative feelings
to “never” bothered by these feelings. Thus, lower scores on this scale indicate decreased mental health of
patients.
In addition, the 5-point role physical scale includes four items that assess the extent of impairments in the
fulfilment of daily roles because of physical restrictions. Response options range from “always” impaired in
daily roles as a consequence of physical health to “never” impaired. Thus, lower scores on this scale indicate
worse functioning, while higher scores suggest minimal disruptions in daily roles.
The SF-36 scale scores were constructed using the method of summated ratings based on several assumptions.
First, items were constructed that all share roughly equal means and standard deviations. Using a scoring utility
software, all eight health domain scales are standardized according to general population based norms
(Mean=50; SD=10). Thus, each scale is supposed to have the same mean (50) and the same standard deviation
(10), which makes it easy to recognize how far a score in a standardized unit deviates from the general
population mean. Each time a scale core is below 50, health status is below the average of the general population
(Ware, 2000).
Furthermore, equally representative items were selected, thus those items that have a roughly equivalent
relationship to their underlying scale. In line with this, all items correlate substantially (greater than .40) with
their associated scale dimension, with few exceptions (Ware, 2000).
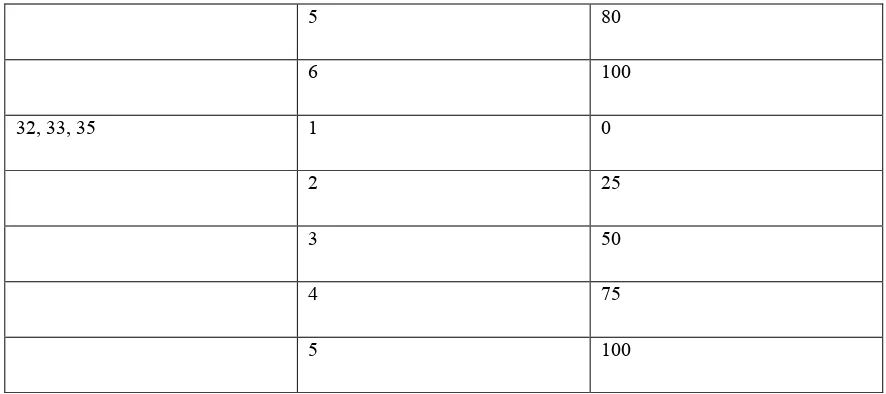
All questions are scored on a scale from 0 to 100, while 100 represent the highest level of functioning that is
possible. Accumulated scores are assembled as a percentage of the total scores possible. For this purpose, the
RAND scoring table is used (see Appendix B, Step 1 Chart). The scores from the questions that address each
specific dimension of physical or psychological functioning are averaged together and divided by the total
number of answered questions in order to calculate a final score for each dimension (see Appendix B, Step 2
Chart).
For example, to assess the social functioning of a patient, one adds the scores from the questions 20 and 32 and
uses the step 1 chart to score them. The value of the answered questions is then divided by to the number of
answered questions (2 in this example) in order to get a total score. Since a score of 100 represents no
impairments in social functioning, lower scores indicate that the patient is experiencing some limitations (“How
to score the Rand SF-36 questionnaire”).
An advantage of this approach is that general population norms make meaningful comparison across health
domain scales quite easy (Ware et al., 2007). In addition, differences in scale scores clearly display disease
impact so that health professionals can quicker and more effective interpret disease effects and treatment
4.5 Pain
A single numerical pain scale assessed the amount of pain that emerged as a consequence of the disease over the
past weeks. The participants were asked to select a number between 0 (no pain at all) and 10 (intolerable pain)
that best suit their actual condition.
4.6 Analysis
The current research revolves around the general question “is there are a negative relationship between fatigue
and quality of life in patients with musculoskeletal diseases?” More specifically, the current research aims at
studying the relationship between fatigue and four separate dimensions of quality of life while controlling for
possible intervening effects of physical functioning and bodily pain.
Data will be analysed using SPSS version 16.0.
A multiple, bloc wise regression analyse is used to estimate the relationship between one of the four dependent
variables (RP, SF, RE & MH) and several independent variables (pain, physical functioning and fatigue).
A requirement for the use of a regression analysis is that one operates with interval scales. In addition, a
regression analysis calls for a linear relationship between the variables. Thus, the relationship between the
independent and dependent variable must be expressed in the form of a straight line (Huizingh, 2008).
In order to test if there exists in fact a linear relationship between the variables, one should make use of scatter
plot graphs that confirmed that it is reasonable to assume a linear relationship between variables in the current
study.
In order to test for a normal distribution of the variables, it is necessary use the Kolmogorov-Smirnov test. For
this study, it turned out that all three measures of fatigue as well as physical functioning constituted a normal
distribution. In contrast, pain scores and the remaining items of the SF36 (RP, SF, RE & MH) were not normally
distributed.
With the objective of getting an impression of the degree and direction of the relationship between the dependent
and independent variables, Spearman’s correlation coefficient was used because the majority of constructs used
in the study turned out to be not normal distributed. Altogether, all factors were correlated among each other.
Values range from +1 to -1 and, whereby +1 constitutes a perfect positive linear relationship and a value of -1
indicates that there is a perfect linear negative relationship. In the case of the current study, correlations of r=≥
0.6 are referred to as strong, r=<0.6 to r=≥0.3 as moderate, and r= < 0.3 as weak.
In the next step a block by block regression analysis was conducted in which physical functioning and pain
served as independent variables in a first bloc. In a second bloc, fatigue was added so that pain, physical
functioning and fatigue together operated as independent variables. In each bloc, four separate tests were carried
The dimension of fatigue effect was omitted in the regression analysis because through calculating Spearman’s
correlation coefficient it turned out that fatigue severity and fatigue effect correlate so strong with each other that
one can conclude that the two dimensions of fatigue measure more or less the same underlying concept. Fatigue
severity was chosen over fatigue effect because severity, like the pain scale, asks about the degree of symptoms
while a measure of fatigue effect is likely to include several concepts (severity and consequences).
The Beta values of the regression analysis output show for each variable the strength of the relationship between
the dependent variable, including the statistical significance. Beta values are standardized coefficients that can be
directly compared among each other.
The R² values indicate how much of the variance of the dependent variable can be explained through the present
independent variables.
To find out if the dimensions fatigue severity and fatigue coping add any explanatory value to the understanding
of disease related physical and psychological complains, the values of R² change must be reviewed and tested for
significance. The F change values test whether the complete model is significantly more successful in explaining
the variance of QOL than the reduced model.
In this way, the effects of pain and PF were controlled and the unique explanatory power of fatigue could be
recognized.
5. Results
The focus of interest in the current study was the question whether fatigue interferes with the quality of life of
patients with musculoskeletal diseases. More specific, the aim was to test whether there exists a negative
relationship between fatigue and the four dimensions of disease related quality of life (RP, SF, RE & MH) while
controlling for pain and PF.
5.1 Correlations among the concepts
In order to get a first impression of the degree and direction of the relationship between fatigue, pain, physical
functioning and the four independent variables (RP, SF, RE &MH), Spearman’s correlation coefficient was
calculated. Altogether, all factors were correlated among each other.
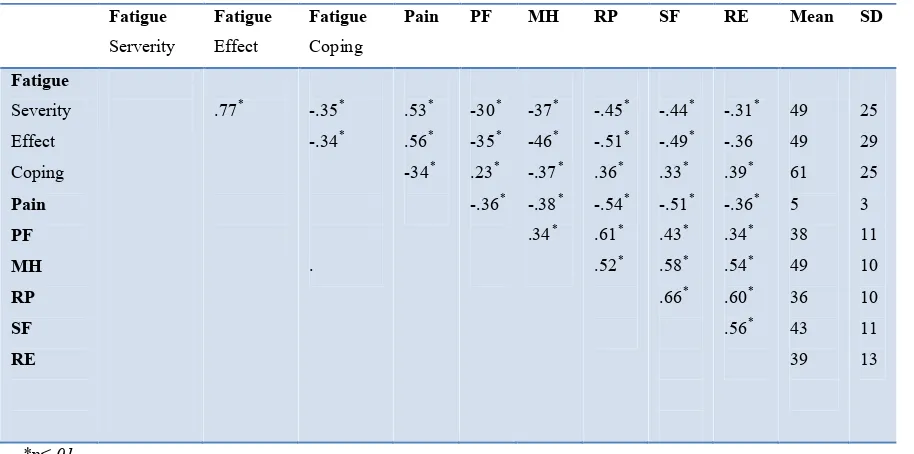
Table 3: Correlation coefficient between physical and mental health (SF -36) and fatigue, pain and physical functioning
(N=207) Fatigue Serverity Fatigue Effect Fatigue Coping
Pain PF MH RP SF RE Mean SD
Fatigue Severity Effect Coping Pain PF MH RP SF RE
[image:23.595.60.517.393.620.2]Table 3 indicates that most correlations between the variables are moderate strong.
The most outstanding exception is that fatigue severity and fatigue effect correlate very strong with each other
(r=.77). Thus, fatigue severity and fatigue effect seem to measure more or less the same underlying construct.
Fatigue coping scores correlated only moderately with fatigue severity and fatigue effect, which indicates that
fatigue coping is associated with but does not directly measure the degree of disease related impairments.
In addition, pain together with fatigue severity and effect compose noticeable correlations. Thus, there seems to
be a considerable amount of overlap between these independent variables.
There are two further exceptions from the remaining moderate correlations: fatigue coping and physical
functioning constitute a surprising weak relationship with each other. Thus, counter intuitive, more effective
fatigue coping is only weakly correlated with the physical functioning of patients, nevertheless the relationship
remains significant. On the basis of current literature, it is likewise quite surprising that fatigue coping and
mental health correlate only moderate strong with each other.
An additional striking exclusion is the strong positive correlation between physical functioning and role physical
functioning, meaning that higher amounts of physical functioning are associated with higher degrees of role
physical functioning. In addition, role physical functioning constitutes a relatively strong negative correlation
with pain and mental health.
For social functioning, a strong positive correlation with pain, role physical functioning and mental health
additionally catches the attention.
Likewise, role emotional functioning is especially strong correlated with role physical functioning and to a
slightly lesser extent with mental health and social functioning.
Thus, it became apparent that the four constructs of the SF-36 that serve as indicators for physical and
5.2 Explanatory power of fatigue
Four separate regression analysis were conducted for each dependent variable (RP, SF, RE & MH). In each case,
in the first step physical functioning and pain served as independent variables. In the second step, fatigue was
added so that physical functioning, pain and fatigue together operated as independent variables.
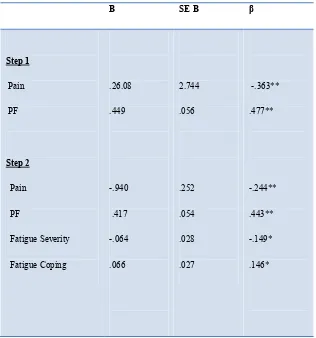
[image:25.595.65.381.236.574.2]
Table 4: Summary of Hierarchical Regression Analysis for Variables predicting role physical functioning (N=207)
Note. R²= .477 for Step 1; ∆ R²= .042 for Step 2. ∆ F for model 1= 77.541**; ∆ F for model 2 = 7.266** * p<.05. **p<.01.
As table 4 indicates, physical functioning and pain significantly predicted role physical functioning both in step 1
and step 2 of the regression analysis. In line with this finding, a significant proportion of 47.7 % of all variance
in role physical functioning was explained due to physical functioning and pain.
When fatigue severity and coping were added in a second step, the explained variance of all independent factors
for role physical functioning rise up with 4.2 %. This increase seems not too large compared to the explanatory
B SE B β
power of pain and physical functioning. Nevertheless, both fatigue severity and fatigue coping are statistical
[image:26.595.66.380.165.480.2]significant at the p<.05 level in step 2.
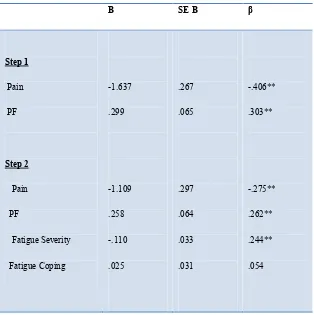
Table 5: Summary of Hierarchical Regression Analysis for Variables predicting social functioning (N=207)
Note. R²= .340 for Step 1; ∆ R²= .050 for Step 2. ∆ F for model 1= 43.870**; ∆ F for model 2 = 6.853** * p<.05. **p<.01.
For social functioning, table 5 presents a quite surprising finding: while PF and pain reach statistical significance
both in step 1 and in step 2, only one dimension of fatigue (in this case fatigue severity) achieve statistical
significance in the second step, while fatigue coping is not statistical significant. Physical functioning and pain
explain comparably less variance in social functioning than in role physical functioning. Anyhow, round 34 % of
the variance in social functioning is explained due to pain and physical functioning. In addition, the magnitude of
explained variance increases with 5.0 % when fatigue severity and fatigue coping were added.
B SE B β
Step 1
Pain PF
Step 2
Pain PF
FatigueSeverity Fatigue Coping
-1.637 .299
-1.109 .258 -.110 .025
.267 .065
.297 .064 .033 .031
-.406** .303**
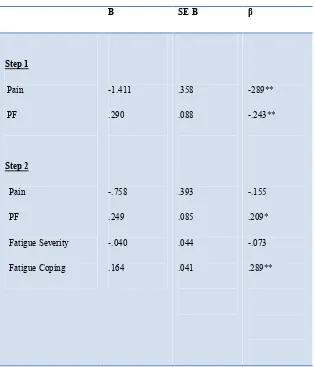
Table 6: Summary of Hierarchical Regression Analysis for Variables predicting role - emotional functioning (N=207)
Note. R²= .190 for Step 1; ∆ R²= .082 for Step 2. ∆ F for model 1= 19.966**; ∆ F for model 2 = 15.740** * p<.05. **p<.01.
Table 6 indicates that only physical functioning remains significant in all conditions. In line with this, fatigue
coping reached statistical significance in the second step, while both fatigue severity and pain become statistic
insignificant. Allover, a relatively slight proportion of variance in role emotional functioning is explained due to
pain and physical functioning (19 %). Explained variance increased with a value of 8.2 % when fatigue severity
and fatigue coping were added. This constitutes the strongest increase in explanatory power due to fatigue across
all four health related dimensions used the actual study.
B SE B β
Step 1
Pain PF
Step 2
Pain PF
FatigueSeverity Fatigue Coping
-1.411 .290
-.758 .249 -.040 .164
.358 .088
.393 .085 .044 .041
-289** -.243**
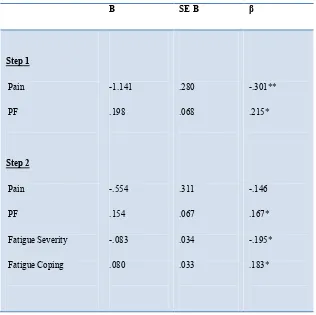
Table 7: Summary of Hierarchical Regression Analysis for Variables predicting mental health (N=207)
Note. R²= .182 for Step 1; ∆ R²= .068 for Step 2. ∆ F for model 1= 19.083**; ∆ F for model 2 = 7.610** * p<.05. **p<.01.
Table 7 offers another surprising result: while both physical functioning and fatigue severity and coping
significantly predicted mental health scores in step 1 and 2, pain did not reach statistical significance in the
second step. In addition, the explained variance of physical functioning and pain is with 18.2 % relatively small.
When fatigue severity and coping were added in the second step, 6.8 % of all variance in mental health is
additionally explained due to the independent variables.
Altogether it became apparent that for mental health, social and role emotional functioning either fatigue
severity, fatigue coping or pain reached statistical significance in the second step of the regression analysis,
while under no circumstances all variables were simultaneously statistical significant. An exception is provided
by the role physical functioning scale in which all independent factors remained significant both in step 1 and
step 2.
B SE B β
In general, the explained variance of fatigue in comparison to pain and physical functioning seems to be
relatively small. To the same degree that the explained variance of physical functioning and pain increased, the
apparently explained variance of fatigue severity and coping decreased. Nevertheless, the F change values
indicate that each predictor that is added to the model is significant for an explanation of health related quality of
life. What further catches attention is the fact that a very high amount of role physical functioning is explained
due to the independent factors, while the explained variance of role emotional and mental health is relatively
6. Discussion
6.1 Findings – Methodological reasons
The present study had the aim to answer the question whether fatigue influences the quality of life of patients
with musculoskeletal diseases. In particularly, I wanted to find answers to the question whether fatigue impairs
the four dimensions of health related quality of life as measured by the SF-36 questionnaire while controlling for
the effects of pain and physical functioning. On the basis of recent literature, my assumption was that heightened
levels of fatigue will lead to decreased role, social and psychological functioning.
In line with present literature, the current research indicates that fatigue severity and fatigue coping explained
between 4.2% and 8.2% of the variance in the different dimensions of health related quality of life of patients
with musculoskeletal diseases. While the explanatory contributions of fatigue seem to be minor compared to the
effects of pain and physical functioning, one must keep in mind that there is a quite high correlation between
fatigue severity, fatigue effect and the other two independent variables (pain, physical functioning). Thus, the
symptoms of pain, impaired physical functioning and fatigue often appear simultaneously. Especially, the
correlation between fatigue and pain is relatively pronounced. This circumstance makes it fairly difficult to
extract the unique explanatory power of each dimension when all independent variables are held constant.
The relatively high correlations among the independent variables is probably the cause for the effect that in the
regression analysis of social functioning, mental health and role emotional functioning either fatigue severity,
fatigue coping or pain reaches statistical significance, while under no circumstances were all variables
simultaneously statistically significant. When all predictors of health related quality of life are held constant, the
highly correlated independent variables enter into a kind of “struggle for statistical significance” were
necessarily one factors wins out while the remaining factors subordinate themselves. Nevertheless, the adding of
all predictors to the model (F change) was still significant. This fact indicates that all used independent variables
are important for an understanding of health related quality of life in RA patients. Merely for the dimension of
role physical functioning remained all independent factors in both steps of the regression analysis statistical
significant. This finding might be explained due to the fact that in general the independent factors explained
6.1.2 Findings - Content reasons
In addition to methodological reasons, there might also be content reasons why the explanatory power of fatigue
seems rather marginal compared to pain. The symptoms of fatigue might be to a lesser extent in the awareness of
patients with musculoskeletal diseases because pain and not fatigue is the dominant topic in the media, in the
literature and during medical consultations. Furthermore, the attribution of the causes of fatigue might not be
clear to patients. Thus, it is possible that patients ascribe fatigue not to their musculoskeletal disease, but to other
circumstances in their lives. In addition, as a general measurement of health related quality of life, the
formulations of the SF-36 do not trigger fatigue symptoms very well. The majority of questions in the SF-36 ask
about impairments as a consequence of physical health and / or emotional problems. If patients classify fatigue
in none of these categories, the influence of fatigue on patients’ health related quality of life will not be reflected
in their answers.
An additional topic that is worth to consider is the fact that we do not know how severe the diseases of the
participants in the actual sample really were. An additional possibility is that the majority of patients in the actual
sample did not experience high baseline levels of fatigue. While not all arthritis patients complain about
symptoms of fatigue, a sample with relatively low levels of fatigue could account for the finding that the
explanatory contributions of fatigue seem relatively small. This assumption is confirmed by the fact that the
majority of the actual sample consists of patients with relative short disease duration. 59.2 % of all participants
are less than ten years diseased. As already mentioned, disease related complains typically decrease through the
initial benefits of treatment in the first years after disease beginning and gradually rise in the successive years
(Pollard et al., 2005). Thus, it is possible that the majority of the current sample shows early forms of RA and
still benefits from treatment which will reduce the amount of fatigue that is experienced.
In addition, the refusal of patients to participate in the study might be a consequence of their higher levels of
fatigue. Those participants that suffer from high amounts of fatigue are especially likely of being too tired to
concentrate long enough to fill out the questionnaires on a computer screen. In this case, the relationship between
fatigue and quality of life might be underrated.
Furthermore, while RA patients constitute around the half of the actual sample, we operated with a divided group
of patients with altogether 12 different diagnoses. Nevertheless, the relationship between fatigue and quality of
life in diseases besides RA remains unknown. It is possible that the presumed relationship has no validity for
other forms of musculoskeletal diseases. If this possibility would turn out to be right, our findings would greatly
underestimate the relationship between fatigue and quality of life in RA patients as a result of the divided
sample.
Overall, although the explanatory contributions of fatigue seemed not too large compared to the effects of pain
and physical functioning, the assumptions that fatigue would negatively influence physical and psychological
6.1.3 Fatigue coping
Surprising was the finding that coping with fatigue and mental health correlate only moderately strong with each
other because former studies indicated that depression in RA patients is strongly associated with high use denial
and low use of active coping, planning and the seeking of social support. Illness perceptions along with coping
are generally thought to have a considerable influence on illness adaptation and disease status (Pollard et al.,
2005).
Likewise initially unexpected was the finding that fatigue coping and the level of physical impairments were
relatively weak correlated. Previous research showed that individuals who believed that their illness is a severe
condition over which they have little control, who saw little hope for effective treatment and who coped with
their illness in a passive way, reported decreased levels of physical and social functioning and greater problems
with their mental health (Heijmansa, 1998). However, these results were mainly affirmed for psychosomatic
diseases. It is very likely that coping styles differentiate between diverging diagnoses as well as between
different symptoms of one disease. For example, for a range of symptoms that are open to improvement, a
problem focused coping strategy might be most beneficial. Forms of problem focused coping might include
active coping, planning, suppression of competing activities and looking for instrumental social support. In
contrast, if the severity of the symptoms cannot be changed per se, it might be more adaptive to make use of
forms of emotional coping. This might include the seeking of emotional social support, positive reinterpretation
of events, acceptance, denial or one turns to religion as a source of internal strength. While passive coping is one
of the most telling predictors of pain (Keefe, Brown, Wallstein & Caldwell, 1989), less literature is available
about the impact of fatigue coping on patients’ quality of life. Coping styles with regard to fatigue might be
striking different compared to pain related coping styles. Because it is known that fatigue severity per se can
often not be changed with current available treatment options, forms of emotional coping might be especially
effective in order to change the meaning of the symptom and so reduce its impact (Nickelin, 2010).
In the actual study, fatigue coping is only moderate associated with the four dimensions of health related quality
of life. But because the concept of coping is so multisided and complex we do not know which forms coping
styles are caught through the used concept which is very broadly referred to as “ fatigue coping”. More
specialization with regard to different coping styles in chronic diseases would be desirable. On open question
that remains to be answered is: which forms of coping are dominant in RA patients dealing with fatigue? Further,
which forms of coping are most successful in increasing the quality of life in those patients?
It turns out that more established knowledge is needed about various forms of coping throughout different
diseases and for different symptoms. Thus, forms of coping and their related impact on quality of life in various
6.1.4 Social functioning
The comparable strong positive correlation between the extent to which patients are able to maintain social
contacts and mental health is relatively easy to explain. It is reasonable to assume that diminished social
functioning is negatively associated with mental health because previous studies indicated that there exists a
causal relationship between the character of social contacts and health. It was shown that people with a
decreased quantity and quality of social contacts are more likely to become ill, to suffer more and eventually die
as a consequence of the disease (House, Landis & Umberson, 1988).
Social functioning correlates relatively strong with pain, role emotional and role physical functioning. This
seems comprehensible because social support has been found to reduce the overall effects of physical limitations
(Doeglas et al., 1994).
6.2 Limitations of the study
The results of the actual study should be viewed in the light of certain limitations.
First of all, although the SF-36 shows evidence of validation for the assessment of RA fatigue, even this scale
would benefit from future research, especially with respect to content validity for RA patients, the inclusion of
cognitive items and regarding the scales responsiveness to changes in the health status (Hewlett et al., 2007). In
addition, the relatively high correlation between the four dimensions of quality of life as assessed by the SF-36
indicates that the dimensions may not differentiate enough between the different constructs that are measured.
It also makes sense to question the quality of life concept used in the actual study. The SF-36 envisages that
physical functioning along with role-physical, social, role-emotional functioning and mental health constitutes
the health related quality of life of patients. However, in case of the actual study, physical functioning serves as
independent control variable and is excluded from the quality of life concept. Thus, it is a problem of the actual
study that a measurement instrument is used that includes all concepts (both independent predictor variables and
indicators of quality of life) in one questionnaire.
Furthermore, because I did not conduct an experiment, it is not possible to conclude that the detected statistical
relationships arise out of a causal link. I can only assume that the independent variables are the cause of the
decline in patients’ health related quality of life. Alternatively to the assumption that fatigue is the cause of
impairments in quality of life, the direction might be the other way around. Thus, it may be likewise possible that
social, role and psychological impairments lead to fatigue.
In addition, I cannot preclude that additional third variables influenced the results. Thus, it is likely that the four
reviewed dimensions of quality of life were affected by factors that were not controlled in the actual study.
Finally, because we do not know which patients for what reasons refused to participate in the current study, our
6.3 Implications
In general, pain and fatigue should be treated as a unit in the assessment and the treatment of disease symptoms.
This makes intuitively sense because both symptoms are relatively high correlated and often appear as an
interrelated bundle of disease related discomfort. In line with this, fatigue is known to boost pain and disability
(Hewlett et al., 2005). Thus, because the actual findings suggest that RA fatigue affects quality of life, an
intervention that addresses fatigue impact should improve the wider well-being of patients.
Unfortunately, until now the treatment of RA is primarily focused on physical impairments and pain while the
symptoms of fatigue are often neglected (Kosinski, 2002). It turned out that there is still much to improve in the
contact between health professionals and patients as well as in the treatment of musculoskeletal diseases in
general.
6.4 Treatment options
Typically, changes in the patients’ mood and the perception of illness are among the best predictors of fatigue in
RA patients. Knowledge about these facts could be used to identify individuals at risk who might especially
benefit from extra attention of the medical professionals (Hewlett et al., 2008).
First of all, it is necessary that medical professionals discuss fatigue complaints and self-management strategies
with affected individuals on a regular basis. Detailed consultations might contribute to the patients’ experience
that their concerns are taken seriously, foster their feelings of self-control and the confidence to be able to
manage the disease. Additional, information in the form of adequate literature could be provided in order to help
patients to better understand the causes, effects and the management possibilities of the disease.
Not at least because until now pharmacological interventions can reduce but not resolve fatigue, effective
fatigue self-management turned out to be critical in order to address the complex, bidirectional pathways of
clinical (disability, pain, inflammation) and psychosocial factors ( mood, beliefs, behaviours and coping) of
fatigue (Hewlett et al., 2011). Research findings indicate a possible disconnection between fatigue severity and
the ability to cope with fatigue. An implication is that patients might be able to enhance their ability to cope with
fatigue and so reduce its effect, even if fatigue severity per se cannot be modified (Nicklin et al., 2010).
These finding once again point to the importance of the concept of fatigue coping, its influence on patients’
quality of life and the related need to gain further knowledge about different coping styles throughout various
diseases and for different symptoms within a disease.
Hewlett et al. (2011) recently conducted an experiment in order to investigate the effect of group cognitive
behavioural therapy (CBT) on fatigue self-management and quality of life in RA patients. It turned out that CBT
participants reported less impact of fatigue compared to controls. More specific, perceived fatigue severity,
coping, disability, depression, feelings of helplessness, self-efficacy