David Norman 1 Leon Axel1 Walter H. Berninger2 Michael S. Edwards3 Christopher E. Cann 1 Rowland W. Redington2 Lauranne Cox 1
Received June 30, 1980; accepted after revi-sion September 12, 1980.
'Department of Radiology, M 396, University of California School of Medicine, San Francisco, CA 94143. Address reprint requests to D. Norman.
2General Electric Corporate Research and De-velopment Center, Schenectady, NY 12301.
3Department of Neurological Surgery, Univer-sity of California School of Medicine, San Fran-cisco, CA 94143.
This article appears in January/February 1981 AJNR and April 1981 AJR.
AJNR 2:1-12, January/February 1981 0195-6108/81/0021-0001 $00.00 © American Roentgen Ray Society
Dynamic Computed
Tomography of the Brain:
Techniques, Data Analysis, and
Applications
Rapid sequence computed tomography (CT) scanning has many potential applica -tions in studying intracranial physiologic events. However, visual inspection of these rapid sequence scans fails to extract the large amount of information inherent in the digital data. The concept of corrected mean transit time applied to rapid sequence scans after intravenous bolus injection of contrast material provides quantitative data on relative hemispheric flow. Use of histogram-based areas of interest permits accurate and reproducible identification of anatomic structures including arteries and gray and white matter. Gamma variate curve fit techniques reduce statistical noise. The concept of transit time can be expanded to the creation of functional CT images.
Advances in computed tomography (CT) technology have resulted in scanners
with scan times under 5 sec and very short interscan delays. Rapid sequence or dynamic scanning offers the possibility of exploring physiologic events such as
blood flow and poteAtially broadens the application of CT, which previously was
directed at the detection of structural abnormalities. In the central nervous
system, applications for dynamic CT techniques include: (1) examination of the
functional significance of extracranial carotid and/or vertebral artery occlusive
disease on intracranial blood flow and effects of carotid bypass procedures; (2) recognition of infarction or ischemia and delineation of the extent of infarction by
distinguishing between the nonperfused and edematous tissue compartments;
(3) evaluation of the effects of vascular spasm in vasculitis or following subarac h-noid hemorrhage; (4) evaluation of shunt phenomena associated with
arteriove-nous malformations; and (5) examination of relative perfusion of tumor compart
-ments.
A research scanner (General Electric Corp.) installed at the University of
California, San Francisco has permitted us to explore some of the applications of rapid sequence scanning, the scan technique itself, and approaches to data analysis in studies of the central nervous system.
Materials and Methods
The Scanner
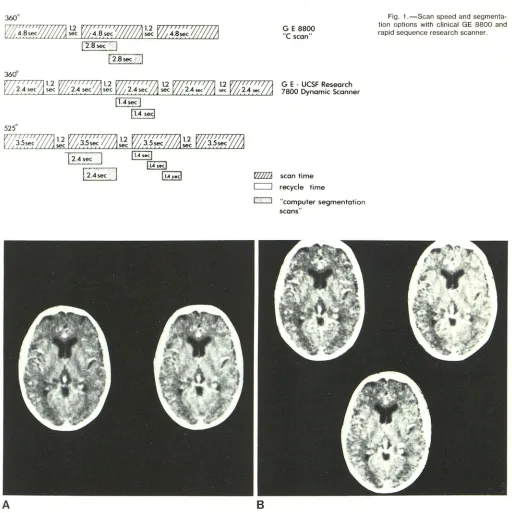
The research scanner is a versatile instrument capable of a variety of scan modes and reconstruction options [1]. It uses a 3600 rotating source-rotating detector geometry with scan duration of 2.4 sec. In addition, the system is capable of producing a 5250
scan of 3.5 sec duration. In either mode, the interscan delay time is a nominal 1.2 sec (fig. 1).
The data from a 2.4 sec scan can be processed to yield either a single reconstruction using the full 3600
data set or, alternatively, the data can be segmented into two consecutive but partially overlapping 2120 segments where each segment yields an image of 1.4 sec effective scan time. Similarly, the 5250 scan data can be processed to yield either two 3600 reconstructions or three 2120 reconstructions (fig. 2). The 5250
2 NORMAN ET AL. AJNR:2, January/February 1981
360°
~
1
'
4~~
/j#/
/;;1
l
tc VZ~'a'::c'lI/#J
!~
V/
~
'
~':;
W//ll
t 2.8 sec":
1
12.8 sec i
l
360°
12
.
4
s
e
c
A
G E 8800
"
e
scan"G E -UCSF Research 7800 Dynamic Scanner
WZl scan time c:J recycle time
r::::=:J "computer segmentation scans"
B
Fig. 1.- Scan speed and seg menta-tion options with clinical GE 8800 and rapid sequence research scanner.
Fig. 2.-A, 3600 reconstructions (2.4 sec each) from 5250 (3.5 sec) scan data. B, 2120 reconstructions (1.4 sec) from same 5250 scan data. Increased image noise accompanies shorter time.
studies. With this mode, for example, up to 18 images can be generated from a scan sequence of less than 30 sec.
Scan Techniques
Xenon and iodinated contrast material are the only two agents that are potentially useful in the evaluation of relative tissue perfu-sion with dynamic CT. Xenon is expensive, has anesthetic qualities in high doses, and is freely diffusible through the blood-brain barrier. Iodinated contrast agents are relatively inexpensive, can be ad-minstered as an intravenous or intraarterial bolus, and in the normal
brain, do not penetrate the blood-brain barrier. The potential prob-lems associated with the use of an intravenous injection include: (1 ) poor patient tolerance, (2) contrast dilution in the right heart, and (3) a subsequent relatively prolonged bolus of contrast material in the arterial system. Phantom studies in our laboratory [2] have shown that a relatively prolonged venous injection does not signifi-cantly compromise the accuracy of determination of relative flow, provided that the contrast bolus is shorter in duration than recircu-lation time.
[image:2.612.50.562.61.574.2]AJNR:2, January/February 1981 DYNAMIC BRAIN CT 3
is preceded by a noncontrast study to determine the optimal plane of section. For example, in the exploration of extracranial carotid occlusive disease, a scan plane at the level of the basal ganglia and sylvian fissure is identified. This permits analysis of basal ganglia structures which are relatively artifact-free as they occupy the central part of the scan and have anatomically well-delineated areas of gray and white matter. This scan level also permits analysis of
arterial transit by visualization of the relatively large middle cerebral artery branch vessels that lie in the sylvian fissure and have an orientation relatively parallel to the axial scan plane. An 18 gauge angiocath is placed in an antecubital vein, and 50 ml of Conray 400 containing 20 g of iodine warmed to 3r C is injected in less than 5 sec using a mechanical injector. Conray 400 is chosen because of its high iodine content and relatively low viscosity. During inj ec-tion, the arm is supported in an elevated position and the patient is asked to take a deep inspiration to speed venous return. A series of seven rapid sequence 5250
scans is performed in 33 sec beginning immediately after injection.
The rapid injection is well tolerated. In over 50 examinations, ephemeral arm discomfort and occasional nausea were the only subjective complaints. There was no vomiting. Radiation dosage in these studies was about 1 rad (0.01 Gy) per scan.
Scan Data Analysis
A typical series of rapid sequence scans in a patient with a high grade left carotid siphon stenosis is shown in figure 10A. This composite is generated as a nine scan display on the video monitor. Visual inspection of the series shows contrast material appearing earlier in the right sylvian vessels (83) than in the left (84) with
subsequent delayed passage of contrast media on the left as compared with the right. However, a priori knowledge of the lesion
tends to prejudice evaluation. Examination of the scans in this
manner yields little more information than that obtained from radi o-nuclide flow scans and is certainly less helpful than a carotid angiogram.
Much more information can be derived if the digital information
intrinsic to CT scanning is used. A graph of the change in density over time in any particular region can be generated by the computer.
A cursor can be visually placed over a branch of the middle cerebral
artery in the region of the sylvian fissure on each side. The arrival time, the relative rise time, and the peak time are some of the
parameters that can be examined (fig. 3).
All of these parameters are dependent to a large degree on the character of the input function or contrast bolus. There is un
cer-tainty and subjectivity in choosing specific arrival time due to noise
in the data, as well as in deciding at what point the upslope actually
begins. The arrival time would be a useful indicator in gross ext ra-cranial carotid disease where there are significant differences in flow between the two sides (i.e., a complete carotid occlusion with minimal or no collateral circulation). The rate of rise or rise time is
usually defined as the difference between arrival time and the time of peak. The rise time is also influenced by the length of the contrast bolus and is insensitive to perfusion or transit. The peak height of contrast density may be an appealing parameter but is markedly
influenced by partial volume artifact in which only part of the vessel is imaged, as well as by total volume of vessels in the region of
interest. In comparing sequential exams, it is primarily influenced
by volume of contrast bolus and injection rate variations. This assumes the identical level is scanned. More important, these
parameters do not provide a measure of relative tissue perfusion, which is the most significant determinant of cerebral function. Basic concepts of brain perfusion determination were well covered by
Zierler [3] and were specifically related to dynamic CT by Axel [2].
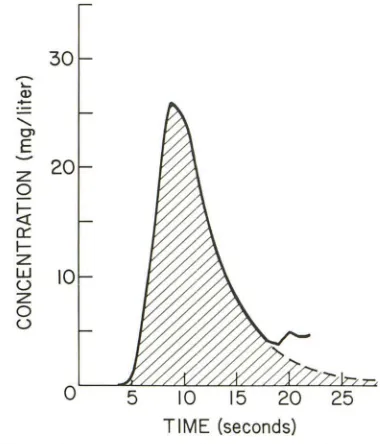
Fig. 3.-Curve fit relating change in density in lell sylvian vessels over time after rapid bolus contrast injection. This program permits examination of a number of parameters including: area under curve (A); standard deviation (SD); number of points (NP); peak time (PT) (the time of greatest curve height); rise time (RT) (time between contrast appearance and peak con cen-tration); falling portion of curve (FC) (the exponential decline of a gamma variate); first moment (M1) (measure of mean time); second moment (M2) (measure of curve width); peak height (PH) and equivalent width (EW) (area under curve divided by height, which is another measure of curve width). LO and HI = CT number range; %U = percentage of histogram-selected pixels within total elliptical area selected.
30
~ ...2
"-OlE
z
20
0
~
0::f-Z
w
10
u
z
0
u
o
TIME (seconds)
Fig. 4.- Typical indicator dilution analysis curve. (See lext.)
They are briefly reviewed below.
[image:3.612.316.557.76.315.2] [image:3.612.339.529.431.653.2]4 NORMAN ET AL. AJNR:2, January/February 1981
Z tins! = V/F
Q f-~ a: f-Z W U Z 0 U
0 TIME 0
!
TIMEtinst
ARTERIES CAPILLARIES
A
z 0~
a: f-Z W U Z 0 U 0 tart ARTERIESB
TIME 0
tcop CAPILLARIES
TIME
Fig. S.-A, Inslantaneous contrast bolus. Washout curve, in which arlerial inpul function is segmented from rest of washout curve. (See text.) B, Prolonged
contrast bolus. Segmented washout curves with prolonged input function. (See text.)
a:
w CD
::!' ~
=>
z ~
~
f- ~
U
"
"
TIME TIME
ARTERIES TISSUE
A
a: w (!)
::!' \ /
-=> \
"
Z
"-"
"
f- "-
"
u "-
"-...
"-TIME TIME
ARTERIES TISSUE
c
Fig. 6.-Various flow patterns in right and left sides in arteries used to
arrive at corrected mean transit time. (See text.) A, Normal. Coincident
arterial and tissue curves. B, Impaired tissue perfusion. Coincident arterial curves; noncoincident tissue curves. C, Delayed arrival, adequate tissue
blood vessels and cerebrospinal fluid spaces.
A typical indicator dilution analysis cur\(e (fig. 4) in which the indicator bolus is small in volume and instantaneous shows a moderately steep rise followed by a relatively prolonged exponential drop with a smaller secondary rise representing recirculation. The area beneath the curve reflects blood volume. The first moment or, graphically, the center of gravity of the curve, is equal to the vascular volume divided by flow, where V
I
F
= f or mean transit time [2).The arterial input function can be segmented from the remainder of the washout curve. This input function shows rapid rise and fall in arterial concentration (fig. 5A). The rise in the capillaries or tissue is less rapid and exhibits a very slow falloff or washout. When the rise and fall of contrast in the artery is extremely fast, it may be neglected. Thus the first moment of the capillary curve reflects the mean transit time through the capillaries and is an indicator of relative tissue perfusion.
With a prolonged input function or contrast bolus, however, both arterial and capillary rise and fall are prolonged (fig. 58). To determine the mean transit time through the capillary or tissue bed,
a: w (!) :::;: => z f-u ARTERIES
B
n:: w (!) :::;: ::J Z"
f-u ARTERIESo
"
TIME"
"
TIME
TISSUE
TIME TISSUE
perfusion. Noncoincident arterial and tissue curves; equal difference in transit times. D, Delayed arrival, impaired tissue perfusion. Noncoincident arterial and tissue curves; unequal difference in transit time.
correction must be made for the prolonged mean arterial transit time. In practice, the mean transit time through the arteries is subtracted from the mean transit time through the capillaries or tissue. The resultant value represents the corrected mean transit time (te) through the tissues.
For example, in the normal patient (fig. 6A), the mean transit time through the arteries and through the tissues should be equal in the two hemispheres. In a patient with normal carotid flow on both sides but impaired tissue perfusion in a single hemisphere (fig. 68), the mean transit time in the arteries would be identical, but the mean transit time in the tissue would be prolonged on the abnormal side. The corrected mean transit time on the abnormal side would be longer than on the normal side. In this situation, the arterial rise time would be normal bilaterally.
[image:4.614.54.561.69.217.2] [image:4.614.58.559.268.460.2]AJNR:2, January/February 1981 DYNAMIC BRAIN CT 5
Fig. 7.-Example of histogram-based area of interest. Computer asked to
look at change in contrast density over time for pixels representing gray
matter only. Many pixels not contiguous. Change in contrast through gray
matter only is calculated. In this case, transit time is 16.8 sec. Transit through
gray matter in basal ganglia is always more rapid than through white matter.
mean transit would be delayed on the abnormal side, and there would be an even greater prolongation of tissue mean transit as compared with the previous example. The corrected mean transit time on the abnormal side would be longer in duration than on the normal side. Using this technique, it may therefore be possible to identify patients with carotid stenosis in whom tissue perfusion is impaired and those in whom tissue perfusion is preserved, despite the presence of a stenotic lesion.
Additional problems must be considered. If the concept of mean transit time is to have practical application, specific tissue com-partments such as vessels and gray matter must be differentiated accurately, reliably, and relatively easily. This differentiation is not possible by the use of a cursor that outlines a simple geometric or irregular area of interest. Volume averaging with adjacent pixels cannot be avoided. For instance, if the structure of interest is a small vessel, there is usually volume averaging with adjacent cere-brospinal fluid spaces or with gray or white matter. Gray and white matter interdigitate in such a way that they cannot be accurately separated from one another with a cursor. This also makes it difficult to obtain a statistically valid number of pixels, and more importantly to be sure that the pixels selected truly represent the absorption value of the anatomic area desired. In addition, a significant amount of unintentional operator prejudice develops. A knowledge of the patient's clinical problem may influence the choice of area and be reflected in the subsequent results. Furthermore, the technique of using geometric areas of interest involves prolonged operator time.
We developed a histogram-based area of interest to overcome these problems (fig. 7). This type of analysis permits the operator to select pixels representing a given range of density values within a relatively large area of interest. These pixels mayor may not be
Fig. B.-Comparison of use of geometric area of interest versus histogra
m-based area of interest in idenification of vascular transit time. Geometric area
of interest (circle) provides transit time 0.5 sec greater than histogram-based
area of interest. This is due to lack of precision in identifying vessel and
averaging adjacent brain structures.
Fig. 9.-Point-by-point fit (above) versus gamma variate curve fit (below)
[image:5.612.55.294.74.356.2] [image:5.612.316.556.75.357.2] [image:5.612.316.557.425.707.2]6 NORMAN ET AL. AJNR:2, January/February 1981
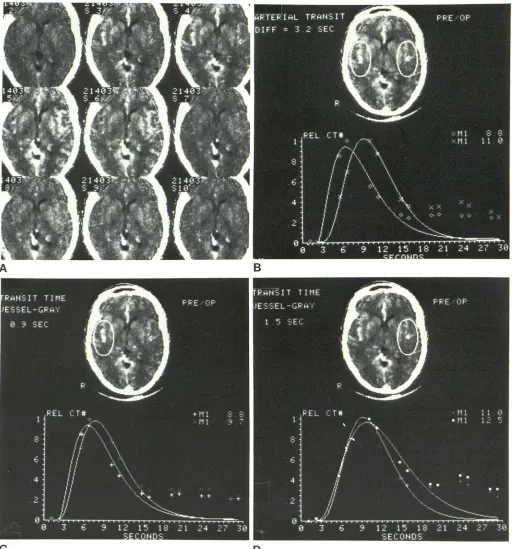
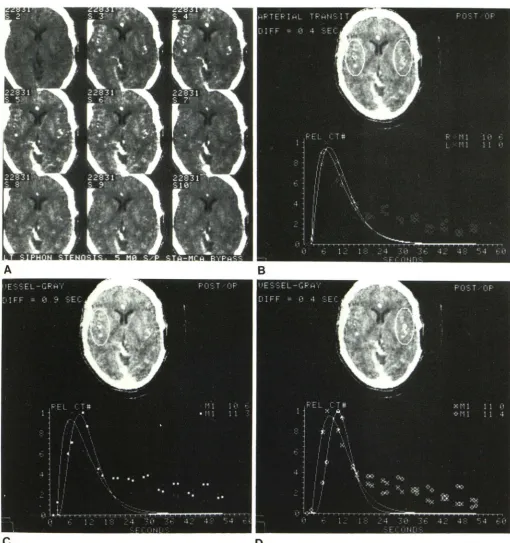
c
Fig. 1 O.- Case 1, 51-year-old woman with left siphon stenosis. A, Series of 2.4 sec segmented images from 5250 (3.5 sec) scans after intravenous
bolus of 50 ml Conray 400. S, Difference in arterial transit time
<n
between right (0) and left (x) hemispheres is 3.2 sec. Corrected mean transit time iscontiguous. The pixels representing arteries (i.e., 48-100 Houns-field units [H]) are selected from the arterial phase. Pixels repre-senting gray matter (40-44 H) or white matter (32-36 H) are identified in the venous phase. Gray and white pixels are not selected in the arterial phase, as pixels thought to represent gray
D
0.9 sec on right (+ = arterial f, :: = gray matter f) (C) 1.5 sec on left (0 = arterial
r.
_
= gray mattern
(D). Corrected mean transit difference between the two hemispheres is 0.6 sec. (See also figure 11.)or white matter may, in fact, later in the sequence be shown to be
venous structures. The identified pixels are then followed by the computer through the entire sequence of scans, and graphs of relative density change for white and gray matter and vessels are
[image:6.612.52.564.76.625.2]mini-AJNR:2, January/February 1981 DYNAMIC BRAIN CT 7
A
c
Fig. 11 .-Case 1, 5 months after superficial temporal-middle cerebral
artery bypass. A, Rapid scan series. B, Arterial transit (0 = righi, x = left)
now differs by only 0.4 sec (versus 3.2 sec on preoperative study). Corrected
mizes volume averaging, as well as operator interaction (fig. 8).
More importantly, it facilitates a critical identification of specific anatomic areas and significantly improves statistics.
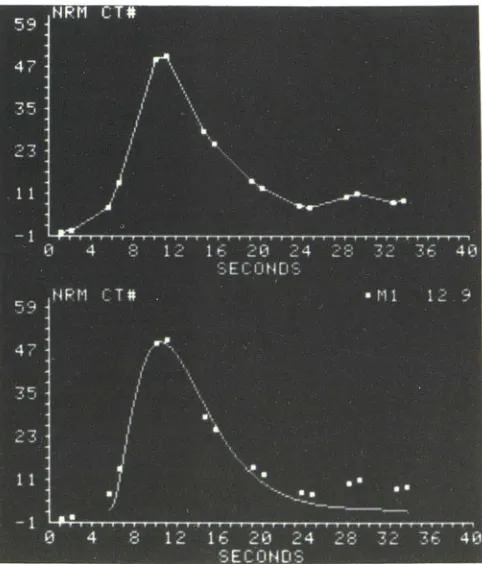
The density changes in these point-by-point graphics are better represented by curve fit techniques, that is, gamma variate (fig. 9) [ 2]. This curve fit technique diminishes the effect of noise, effective
B
o
mean transit time is 0.9 sec on righl (0 = arlerial f, • = gray mailer n (C) and 0.4 sec on left (H3 = arterial r, ® = gray matter n (0). Correcled mean transit lime difference between the two hemispheres is 0.5 sec.
scan time, and data density. It corrects for recirculation as well. These curves can further be exhibited as either direct numeric CT values or as proportional curves.
[image:7.614.50.560.71.614.2]8 NORMAN ET AL. AJNR:2, January/February 1981
c
Fig. 12.-Case 2, 56-year-old man with right carotid occlusion. A, Rapid
scan series. B, Difference in arterial transil of 3.8 sec (0 = right f, • = left
n
.
Corrected mean Iransil is 4.1 sec on Ihe right (0 = arterial f, 0 = greyon the CT image reflect not tissue density values, but relative tissue
transit. Corrected mean transit time is not displayed, as the specific artery that supplies a particular tissue compartment must first be identified. These concepts are perhaps best understood by a
ppli-cation to clinical situations.
o
matter
n
(C) and 0.7 sec on the left (x = arterial f, + = grey mattern
(0).Corrected mean transit difference between the two hemispheres is 3.4 sec.
(See also figure 13.)
Representative Case Reports
Case 1
[image:8.612.51.560.73.636.2]AJNR:2, January/February 1981 DYNAMIC BRAIN CT 9
A
Fig. 13.-Case 2, 1 week after superficial temporal-middle cerebral
artery bypass. A, Rapid scan series. B, Arterial transit difference (x = righi,
+ = left) is now 0.6 sec (versus 3.8 sec on the preoperative study). Correcled mean transit is 1.9 sec on the right (:: = arterial f, 0 = gray matier nand 0.3
arm and drooping of the right face (fig. 1 OA). Angiography revealed
almost complete occlusion of the left internal carotid artery siphon
with no demonstrable proximal abnormalities. Analysis of relative
arterial transit showed a difference between the right and left sides
of 3.2 sec, the left slower than the right (fig. 1 DB). Comparison of
sec on Ihe left (D). Correcled mean transit time difference between the two
hemispheres is 1.6 sec, which represents a significant improvement from
preoperative study.
vessel to gray matter transit or corrected mean transit time in the
two hemispheres showed only a 0.6 sec difference between the left
(1.5 sec) and right (0.9 sec), the lett being only slightly slower (figs.
1 DC and 100). The dynamic CT study suggests that this patient,
paren-10 NORMAN ET AL. AJNR:2, January/February 1981
chymal perfusion, at least when asymptomatic. However, her tra n-sient ischemic attacks indicate that cerebral perfusion was only marginally adequate.
Although causes of transient ischemic attacks such as platelet thrombi must, of course, be considered, the dynamic CT suggests the arterial supply to the hemisphere in this instance was the limiting
factor and that the transient ischemic attacks could probably be relieved by an adequate surgical bypass procedure. In repeat study
after a superficial temporal-middle cerebral artery bypass (fig. 11 A), arterial transit differed by only 0.4 sec (fig. 118) and pare n-chymal transit by only 0.5 sec (figs. 11 C and 110). The patient experienced relief of symptoms.
Case 2
A 56-year-old man with generalized vascular disease suffered a right carotid occlusion and associated stroke 2 years before admis
-sion. He had recovered from the cerebrovascular accident and was under evaluation for a carotid bypass procedure prior to coronary
artery bypass surgery. The superficial temporal-middle cerebral
artery bypass in this instance was considered prophylactic. Pre -operative analysis (fig. 12A) showed a 3.8 sec difference in arterial
transit between the two hemispheres (fig. 128), the right more prolonged than the left. However, analysis of parenchymal co r-rected mean transit on the right of 4.1 sec and on the left of 0.7 sec (figs. 12C and 120). These findings suggest that there was impaired perfuSion secondary to carotid disease with inadequate collateral
circulation.
Postoperative study (fig. 13A) showed marked improvement in
arterial (carotid) transit time (0.6 sec) (fig. 138) and in corrected mean parenchymal transit on the right compared with the left side (difference equals 1.6 sec) (figs. 13C and 130). Functional images again showed these findings in a composite fashion (fig. 14).
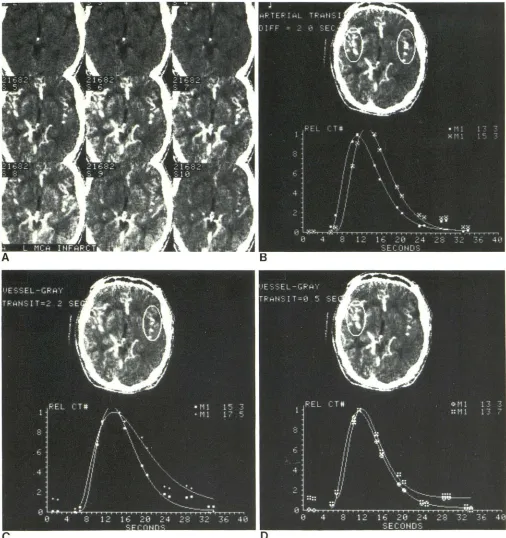
Case 3
A 56-year-old woman had an acute left middle cerebral artery stroke. Pre- and postcontrast CT revealed no abnormalities. A dynamic scan (fig. 15A) showed poor filling on the left. More significant was the flow analysis, which showed a 2 sec difference
in arterial transit (fig. 158) and a 1.7 sec difference in corrected tissue mean transit time (figs. 1 5C and 150). The functional image (fig. 16) clearly demonstrated the difference in hemispheric pe rfu-sion.
Discussion
There are several important limitations inherent in our technique. The information is comparative numeric data about flow in the two hemispheres. Detection of an abnor-mality depends on a difference between them. For instance,
if there is slow flow in both hemispheres, an abnormality may not be detected unless there is a marked reduction in transit bilaterally. Comparative data on corrected mean tran-sit times in a cohort of normal patients is necessary for this judgment.
Although relative hemispheric transit can be detected using this technique, absolute flow cannot. Currently we are working on a modificaton of the technique for determining absolute concentration of contrast material in the sagittal
sinus from which a figure for absolute flow can be derived. The technique works most reliably in patients in whom the blood-brain barrier is intact. In patients in whom it is
dis-A
B
Fig. 14.- Case 2. Pre-(A) and post- (B) operative functional images. Gray shades represent mean transit; white indicates slow transit; black indicates
rapid transit. Significant improvement in right hemispheric transit between pre-and postoperative studies.
rupted (e.g., by infarct or tumor), the technique will usually be useful on the first pass of the contrast bolus as the rate
of leakage in most lesions is significantly slower than
inter-vascular transit. However, large blood-brain barrier defects will artificially prolong the mean transit time.
Examination of a single 1 cm thick section of brain is, of course, a limitation even though a level at the basal ganglia has several advantages, as discussed above. However, it
will not have application to problems related to posterior
fossa or high convexity disease (i.e., peripheral emboli). In
addition, accuracy in the posterior fossa is probably signifi-cantly reduced due to high spatial frequency artifact
inher-ent in CT scanning of the posterior fossa. Even so, other
levels can be studied with current equipment, assuming no
gross leakage of contrast material has occurred (i.e., no large blood-brain barrier defect is present).
It is important to remember that with a nondiffusible
indi-cator such as iodinated contrast, corrected mean transit
time provides a measure of flow per unit vascular volume as opposed to flow per unit volume of tissue; in order to arrive at this latter value, a measure of fractional total tissue
represented by the vascular space would be required. This
could be calculated with knowledge of intravascular contrast concentration. By comparison, xenon, which is a diffusible
indicator, will provide a measure of flow per unit tissue
volume, but to obtain meaningful measurements using this technique, an accurate measure of partition coefficient is required.
An additional potential problem area is statistical error, which might occur if overlapping CT values are selected for
AJNR:2, January/February 1981 DYNAMIC BRAIN CT 11
Fig. 15.- Case 3, 56-year-old woman who had acute left middle cerebral
artery stroke 3 days before. Pre- and postcontrast static CT scans were
normal. A, Rapid sequence scan. Relatively less filling on left. B, Arterial
transit difference is 2.0 sec (. = right, EB = left). Corrected mean transit time
is also a problem in that a pixel identified on one scan may
not be in the same anatomic structure in a subsequent scan. An additional area of concern is the trade-off between temporal and density resolution. Although additional data
is 2.2 sec on the left (. = arterial f, + = gray matter
n
(C) and 0.5 sec onthe right (181 = arterial f, :: = gray matter n (0). The difference in corrected
mean transit times between the two hemispheres is 1.7 sec.
points might be desired to improve the accuracy of the
technique, increased speed results in decreased density
[image:11.612.53.559.72.610.2]12 NORMAN ET AL. AJNR:2, January/February 1981
Fig. 16.-Case 3. Functional
composite image. White represents slow transit; black represents rapid
transit.
If dynamic CT is to have clinical applications, a large series of patients must be examined. Normal controls must be established. Basic experiments confirming data repro-ducibility, the minimum number of data points required, and acceptable noise levels must be performed. These experi-ments are in progress.
REFERENCES
1. Berninger W, Axel L, Norman D, Napel S, Redington R.
Func-tional imaging of the brain using computed tomography.
Ra-diology 1981 (In press)
2. Axel L. Brain blood flow determination by rapid sequence computed tomography: theoretical analysis. Radiology 1981
(In press)