Multiple Sclerosis of the Spinal Cord: Diagnosis
and Follow-up with Contrast-Enhanced MR and
Correlation with Clinical Activity
Isabelle Trop, Pierre M. Bourgouin, Yves Lapierre, Pierre Duquette, Christina M. Wolfson, Hoang D. Duong, and Geralyn C. Trudel
PURPOSE:Although MR findings in multiple sclerosis (MS) are well known, the relationship between MR-detected lesions and clinical activity has not been studied in the spinal cord. The purpose of this study was to determine whether serial MR imaging provides evidence of disease activity unsuspected on clinical examination and to determine whether it is useful in monitoring patients with MS primarily affecting the spinal cord.
METHODS: Twenty-five consecutive patients with MS and with signs and symptoms of myelopathy underwent a full neurologic examination and contrast-enhanced MR imaging of the spinal cord at intervals of 0, 2, 6, and 12 months. Disability was rated according to Kurtzke’s functional systems and the expanded disability status scale (EDSS). Clinical status of myelop-athy (improved, deteriorated, or stable) was also assessed. Hyperintense lesions were counted on T2-weighted images and a weighted lesion load was calculated for each patient. The number of enhancing lesions was also determined.
RESULTS: We found a moderate correlation between lesion load and sensory function and EDSS. Seventy percent of patients with new clinical manifestations of myelopathy had one or more enhancing lesions. Agreement between MR findings and clinical examination in evincing disease activity was found in 60% of follow-up examinations. MR images showed lesion progression in seven (44%) of 16 occurrences of clinical deterioration and in 21 (35%) of 60 occurrences of clinical improvement or stability.
CONCLUSION: Serial MR imaging provides evidence of disease activity unsuspected on clinical examination and could be useful in monitoring patients with MS primarily affecting the spinal cord.
MR imaging is sensitive in detecting demyelinating lesions in the brain. In fact, white matter hyperintense lesions are detected on T2-weighted images in 90% to 97% of patients with clinically definite multiple scle-rosis (MS) (1–3). Correlation between disability and MR-detected lesions in the brain is weak (4–9). Most intracranial lesions are asymptomatic, and new
le-sions appear on serial MR studies five to 10 times more often than evidenced by clinical exacerbations (4, 10–15). Contrast enhancement shows breakdown of the blood-brain barrier associated with perivascu-lar inflammation and thus is a marker of histologic activity (16–18).
The spinal cord is frequently and often extensively involved in MS. In one autopsy series, Ikuta and Zimmerman (19) found cord lesions in 86% of 70 randomly selected patients with MS. In 13%, cord lesions were present without concomitant involve-ment of the brain. Early studies with MR imaging showed spinal cord lesions in 47% to 65% of patients with MS (20–22). Using multiarray coils and fast spin-echo pulse sequences, Kidd et al (5) identified lesions in 74% of their patients. Tartaglino et al (23) described the characteristic MR imaging features of spinal cord lesions in 68 patients with MS. The ma-jority of plaques were two body segments in length or less, located at the periphery, and occupied less than
Received August 8, 1997; accepted after revision December 18. Supported by a research grant from Berlex Canada.
Presented at the annual meeting of the American Society of Neuroradiology, Seattle, June 1996.
From the Departments of Radiology (I.T., P.M.B.) and Medi-cine (P.D.), University of Montreal Medical Center; the Depart-ments of Medicine (Y.L.) and Radiology (H.D.D.), Montreal Gen-eral Hospital, McGill University; the Department of Epidemiology and Biostatistics, McGill University (C.M.W.); and the Depart-ment of Scientific Affairs, Berlex Canada (G.C.T.).
Address reprint requests to Pierre M. Bourgouin, MD, Depart-ment of Radiology, University of Montreal Medical Center, 1560 Sherbrooke St East, Montreal, Canada, H2L 4M1.
©American Society of Neuroradiology
50% of the cross-sectional area of the cord. Although the spinal cord may be the earliest and, in some cases, the only site of involvement by MS (21, 24), few prospective studies with follow-up MR imaging have been carried out in patients with signs and symptoms of myelopathy.
The traditional measure of therapeutic outcome in patients with MS depends on relatively subjective and locomotion-weighted clinical rating scales. Serial MR imaging of the brain, when added to the clinical ex-amination, allows more sensitive and objective mon-itoring of these patients (25–28). Serial MR imaging of the spinal cord could potentially play the same role in monitoring patients with myelopathy; but before recommending its use, we think it important to de-termine what additional information MR will provide concerning disease activity. The purpose of this study, therefore, was to compare disability and clinical ac-tivity with MR-detected spinal cord lesions in patients with MS and myelopathy.
Methods
Twenty-five consecutive patients with MS who had signs and symptoms of myelopathy on neurologic examination were in-cluded in this study. Selection of patients was based solely on the presence of myelopathy. The study group consisted of 15 women and 10 men, aged 20 to 56 years (mean, 36 years). Disease duration (measured from the time of the first clinical episode) ranged from 0 to 14 years (mean, 7 years). The study was reviewed and approved by our institutional review board and informed consent was obtained from each patient.
All patients had definite MS as supported by either the clinical (n523) or laboratory (n52) criteria of Poser et al (29). All had a sensory deficit and, in 18 patients, a sensory level was present. Nineteen patients had paraparesis or mono-paresis and 18 had sphincter dysfunction.
At the onset of the study, a detailed medical history was obtained and a full neurologic examination was carried out. Disability was rated according to Kurtzke’s functional systems and the expanded disability status scale (EDSS) (30). Pyrami-dal, sensory, and bowel/bladder functions were graded on a 0 to 6 scale. The ambulation index (from 0 to 9) and EDSS score (from 0 to 10) provided global assessment of disability. The clinical examination was repeated at 2, 6, and 12 months. At each visit, any new symptoms or signs were sought and the Kurtzke scores were reassessed. All clinical examinations were performed by one of two neurologists who were blinded to the MR results. Clinical deterioration of myelopathy was defined as the occurrence of one or more symptoms of neurologic dysfunction lasting more than 24 hours. Clinical improvement was defined as a definite improvement of symptoms, signs, or both lasting for at least 1 month (30).
The mean functional scores of patients on initial examina-tion were as follows: pyramidal, 2.28/6; sensory, 2.68/6; bowel/ bladder, 1.20/6, EDSS score, 4.34/10; and ambulation index, 3.28/9. All patients except one had known MS and were previ-ously symptomatic from lesions in the brain, optic nerves, or spinal cord. In one patient, MS was diagnosed upon entry in the study. Seventeen patients had relapsing-remitting MS, seven had secondary-progressive MS, and one patient had primary-progressive disease. All but three patients with relapsing-remit-ting MS had one or more previous episodes of myelopathy before they entered the study.
Each patient underwent MR imaging of the brain and spinal cord within 10 days of the initial clinical evaluation. In addition, imaging of the cord was performed at 2, 6, and 12 months, and
imaging of the brain at 12 months. All imaging was done on a 1.5-T system. Brain MR was carried out using a standard quadrature head coil. Axial and sagittal proton density– and T2-weighted fast spin-echo images (5000/17–102/1 [TR/TE/ excitations]) were obtained with the following parameters: a section thickness of 5-mm, an echo train length of 8, a matrix of 1923256, and a field of view (FOV) of 24 cm. Imaging of the cord was performed with a phased-array multicoil. Sagittal T1-weighted spin-echo images (500/20/2) were obtained through the cord using a 3-mm section thickness, a 2563512 matrix, and a 24348-cm FOV. Then, sagittal proton density– and T2-weighted fast spin-echo images (2000/34–119/2) were obtained through the cervical and thoracic segments with an echo train length of 8, a matrix of 2563256, and an FOV of 26 cm. In the second part of the examination, sagittal T1-weighted spin-echo images (500/20/2) were obtained through the cervical and thoracic segments 5 to 12 minutes (early) and 15 to 22 minutes (delayed) after injection of 0.1 mmol/kg gadopentetate dimeglumine. For all images, a 3-mm section thickness, a 256 3256 matrix, and a 26-cm FOV were used. Axial images were not obtained in this study. Total examination time was approximately 1 hour for imaging of the brain and cord.
At the end of the study, two neuroradiologists who were blinded to the clinical history reviewed all images and reached a consensus decision. Only the patient’s identification number appeared on the imaging studies, and a standardized question-naire was used for interpretation. Hyperintense lesions were counted in five periventricular and eight nonperiventricular white matter regions on proton density– and T2-weighted im-ages of the brain obtained at 0 and 12 months. Lesions were counted if they were present on both proton density– and T2-weighted images. Lesions were judged according to their longest diameter (31). They were categorized as 5 mm, 6 to 10 mm, more than 10 mm, or confluent, and scored 1 to 4, respectively, depending on this measurement. Each lesion within a region was scored and a total score was calculated for that region. The total brain lesion load was obtained by sum-ming the lesion size scores over all 13 regions. The five periven-tricular and eight nonperivenperiven-tricular regions encompassed al-most the entire brain except for the caudal part of the posterior fossa and the upper convexity. Lesions were also counted on proton density– and T2-weighted images of the spinal cord obtained at 0, 2, 6, and 12 months. Lesions were counted if they were present on both proton density– and T2-weighted images. Cord lesions were categorized as 5 mm, 6 to 10 mm, 11 to 30 mm, or more than 30 mm in diameter and scored 1 to 4, respectively, depending on this measurement. A weighted spi-nal cord lesion load was calculated by summing the scores. The number of enhancing lesions and the type of enhancement pattern (nodular, ring, or patchy) were determined on postcon-trast sagittal T1-weighted images. Follow-up examinations were reviewed for presence of new or enlarging lesions on T2-weighted images and postcontrast T1-weighted images. Dis-appearance, decrease in size, or loss of enhancement was also noted on the same images.
Results
Baseline Hyperintense Lesions of the Spinal Cord and Brain on T2-Weighted MR Images
Twenty-four (96%) of 25 patients had hyperintense lesions in the spinal cord on proton density– and T2-weighted images. A total of 108 plaques were identified (mean, 4 per patient; range, 0 to 8). Twen-ty-two patients (88%) had more than one plaque (Fig 1). The weighted lesion load in the spinal cord ranged from 0 to 19, with a median of 10. The total spinal cord lesion load in the sample of 25 patients was 235 at time 0.
Twenty-four (96%) of 25 patients also had hyper-intense lesions in the brain on proton density– and T2-weighted images. Lesions in the brain and spinal cord were found in 23 patients, one patient had le-sions in the brain only, and another had lele-sions in the spinal cord only. The weighted lesion load in the brain ranged from 0 to 123, with a median of 49. The total brain lesion load in the sample was 1228 at time 0. The total lesion load in the CNS (spinal cord plus brain) was 1463, with 81% of the lesion load located in the brain and 19% in the spinal cord.
We found a moderate correlation between spinal cord lesion load and sensory function (r5.553;P,
.001) and EDSS score (r 5 .422; P , .05). Eight (44%) of 18 patients with a defined sensory level deficit had a hyperintense lesion in the cord that corresponded anatomically with the level (Fig 2). There was no significant correlation among the fol-lowing: 1) spinal cord lesion load and ambulation index and pyramidal or bowel/bladder function scores; 2) brain or total CNS lesion load and EDSS score, ambulation index, and pyramidal, sensory, or bowel/bladder function scores; or 3) spinal cord and brain lesion loads (P..05).
Baseline Enhancing Lesions of the Spinal Cord
Thirteen (52%) of 25 patients had enhancing le-sions in the cord after contrast administration (Fig 3). A total of 15 enhancing plaques were present, repre-senting 14% of the hyperintense lesions. The mean length of the enhancing lesions was 7 mm, with a range of 2 to 12 mm. All lesions were present on delayed images (15 to 22 minutes after contrast ad-ministration) but only 13 were identified on early
FIG 1. 44-year-old woman with recur-rent episodes of myelopathy. Sagittal T2-weighted image of the thoracic cord shows multiple hyperintense lesions measuring 7, 10, and 4 mm in length and scored 2/4, 2/4, and 1/4, respectively. Other lesions were present in the cervi-cal cord as well (not shown). Despite these lesions, disability was mild (EDSS score5
1.0).-FIG 2. 21-year-old man with recent onset of myelopathy, sensory level at T-9, and EDSS
score of 3.5.
A, Sagittal T2-weighted image of the thoracic cord shows solitary hyperintense lesion at T-9 with swelling. Lesion measured 13 mm in length and was scored 3/4. There was no enhancement after contrast administration.
images (5 to 12 minutes after contrast administra-tion). In addition, four lesions were more conspicuous on delayed images than on early images. Three pat-terns of enhancement were present: nodular (n510), patchy (n53), and ring (n52). Two lesions evolved from a ring pattern on early images to a nodular pattern on delayed images. All lesions were hyperin-tense on proton density– and T2-weighted images. Six enhancing lesions (40%) were associated with swell-ing of the cord.
Seventeen of 25 patients had new clinical manifes-tations of myelopathy within 2 months of entry in the study and were included in the new clinical manifes-tations (NCM) group. The remaining eight patients were clinically stable during the 2 months prior to entry in the study and thus were included in the no new clinical manifestations (NNCM) group. The NCM group included 10 women and seven men, aged 20 to 50 years (mean, 34 years), with a mean disease duration of 7 years. The NNCM group included five women and three men, aged 24 to 56 years (mean, 40 years), with a mean disease duration of 6 years. The NCM group included significantly more patients with enhancing lesions than did the NNCM group (P ,
.01). Twelve (71%) of 17 patients presenting with new clinical manifestations had at least one enhancing lesion in the spinal cord on initial MR imaging, while only one (13%) of eight NNCM patients had en-hancement. The single NNCM patient with enhance-ment had clinical deterioration 10 weeks before en-tering the study, which barely excluded her from the NCM group.
Follow-up Examinations of the Spinal Cord and Brain
Each patient had follow-up clinical examinations and MR imaging at 2, 6, and 12 months after entry in the study. One patient with a clinical relapse had an additional examination 2 weeks after the 6-month examination; thus, a total of 76 follow-up examina-tions were performed in 25 patients. Myelopathy showed clinical deterioration on 16 follow-up exami-nations, improvement on 20 examiexami-nations, and stabil-ity on 40 examinations. By comparison, lesion pro-gression (new, recurrent, or enlarging hyperintense lesions and new enhancing lesions) was seen on 13 follow-up MR examinations (Fig 4); lesion diminu-tion (disappearance or decrease in size of hyperin-tense lesions or loss of enhancement) was evident on 28 examinations (Figs 2 and 5); both lesion progres-sion and leprogres-sion diminution were seen on 15 examina-tions; and no change was noted on 20 examinations. A total of 47 new, recurrent, or enlarging hyperintense lesions were present on T2-weighted images. En-hancement was detected in nine plaques: six in pre-existing T2-weighted hyperintense lesions and three in new T2-weighted lesions.
Table 1 shows the relationship between MR imag-ing findimag-ings and clinical status of myelopathy in all 76 follow-up examinations. In this table, MR examina-tions with lesion progression include those with lesion progression only as well as those with both lesion progression and lesion diminution. Lesion progres-sion was identified on 28 follow-up MR
examina-FIG 3. A 20-year-old man with new clin-ical manifestations of myelopathy, sensory level at T-12, and EDSS score of 2.0.
A, Sagittal T2-weighted image of the cervical cord shows multiple hyperintense lesions. Thoracic cord was normal.
[image:4.587.216.533.61.367.2]tions and was associated with concurrent clinical de-terioration in seven cases and with subsequent dete-rioration in another five cases. Lesion diminution or stability was identified on 48 follow-up MR examina-tions and was associated with concurrent clinical deterioration in nine cases. MR findings showed le-sion progresle-sion on seven (44%) of 16 examinations with clinical deterioration and in 21 (35%) of 60 examinations with clinical improvement or stability. Agreement between MR and clinical examinations was found in only 46 (61%) of 76 follow-up examina-tions. Statistical analysis showed no apparent rela-tionship between change in MR-detected lesions and clinical activity of the disease over the 1 year fol-low-up period.
Of 15 enhancing plaques present on the first exam-ination, 11 (73%) had lost enhancement at 2 months (Fig 5). An additional two lesions lost enhancement at 6 months, and a third lesion lost enhancement at 12 months. Only one lesion still enhanced at 12 months. Loss of enhancement was accompanied by concurrent loss of swelling in all patients. Lesions persisted longer on T2-weighted images. Nine (60%) of 15 enhancing cord lesions identified on the initial exam-ination were still hyperintense at 12 months, although six were less intense. Four enhancing lesions disap-peared on both T1- and T2-weighted images at 2 months, one lesion disappeared at 6 months, and another disappeared at 12 months. Loss of enhance-ment was accompanied by clinical improveenhance-ment in nine (69%) of 13 patients in whom enhancement was
seen on the first examination (Fig 5). An additional two patients were clinically stable despite loss of en-hancement. Of the remaining two patients, one had clinical deterioration despite loss of enhancement, while the other improved despite persistent enhance-ment of one lesion. Table 2 shows the relationship between the percentage of patients with at least one enhancing lesion and mean functional scores, ambu-lation index, and EDSS score at time 0, 2, 6, and 12 months in all 25 patients. The percentage of enhance-ment decreased from 52% at time 0 to 16% at 2 months. Loss of enhancement was accompanied by improvement in sensory function, pyramidal function, bowel/bladder function, ambulation index, and EDSS during the same time interval.
Nine new enhancing lesions were identified in six patients on follow-up examinations (Figs 4 and 5). Three patients each had two new enhancing lesions while three others had a single enhancing lesion. All new enhancing lesions were hyperintense on T2-weighted images. Six (67%) of nine new enhancing lesions were either new or had enlarged on T2-weighted images. Six enhancing lesions were associ-ated with clinical activity while three lesions appeared in asymptomatic patients.
The total brain lesion load was 1228 at time 0 and 1255 at 12 months. Ten (40%) of 25 patients had an increase in brain lesion load and the increase was greater than 10% in six patients. Nineteen patients had lesion progression in the spinal cord on at least one follow-up MR examination. Table 3 shows the
FIG 4. 26-year-old man with chronic my-elopathy and EDSS score of 3.0.
A, Sagittal proton density–weighted im-age shows a hyperintense lesion from C-2 to C-5 measuring 48 mm in length, which was scored 4/4. A second lesion is present at C-1. There was no enhance-ment after contrast administration.
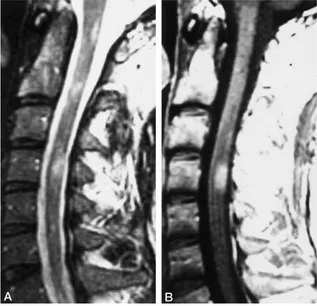
FIG 5. 22-year-old woman with new clin-ical manifestations of myelopathy and EDSS score of 3.0.
A, Sagittal T2-weighted image of the cervical cord shows hyperintense lesion at C-5.
B, Contrast-enhanced T1-weighted im-age shows ring enhancement of the le-sion.
C, Patient improved, and EDSS score was 1.5 at 2 months. Sagittal T2-weighted image at this time shows decreased signal of C-5 lesion. There was no more en-hancement after contrast administration.
relationship between the change in brain lesion load and the change in spinal cord lesion load with time in these patients. There was no significant correlation between the change in brain lesion load and the change in spinal cord lesion load (r5.217;P5.372). Likewise, there was no significant correlation be-tween the percentage of change in brain lesion load and the percentage of change in cord lesion load (r5
.332; P5.165).
Eleven patients received steroids during this study. One patient was treated with b-interferon. Of five patients who received steroids within 1 month of the first MR examination, only one had enhancement in the spinal cord.
Discussion
We found a moderate correlation between spinal cord lesion load and both sensory function and EDSS scores. There was no significant correlation between lesion load and other functional system scores and the ambulation index. Several factors bear on these
re-sults. First, only lesion length was measured and used for lesion load determination. MR-derived volume measurements provide greater sensitivity and repro-ducibility (32). They have been used in the brain but not in the spinal cord yet. Second, although signifi-cant advances have been made in MR imaging of the spinal cord, image quality is not always optimal and small lesions may be missed. Third, disability is mea-sured by functional scores, which in turn reflect le-sions in the brain and spinal cord. We found no significant correlation between total CNS lesion load and disability. Fourth, there are two major types of chronic demyelinating lesions: those with extensive axonal loss and those with extensive gliosis and pre-served axons (33). Axonal loss, which causes more disability, cannot be distinguished from extensive gli-osis and preserved axons on proton density– and T2-weighted images. The ratio of one type of lesion relative to the other in a given patient presumably has an influence on the degree of disability. Proton spec-troscopy and magnetization transfer imaging provide better tissue characterization, and improved correla-tion between MR-detected lesions and disability has been reported in the brain with the use of these two techniques (34, 35).
Contrast enhancement correlates with the presence of an active inflammatory process with perivascular lymphocytic infiltration (16, 17). Although only a small percentage (14%) of spinal cord plaques en-hanced in our patients, the total number of plaques with blood-brain barrier disturbance was probably larger. It is likely that some nonenhancing lesions have subtle blood-brain barrier disturbance not de-tected with contrast administration. A majority of patients (70%) with new clinical manifestations of myelopathy had enhancing lesions in the cord. Most enhancing lesions were homogeneous, nodular, and relatively small. Patchy and ring enhancement were present in some plaques. Some lesions increased in size, became homogeneous, and were best seen 15 to 22 minutes after contrast administration. Similar find-ings have been described in the brain (11, 36, 37). Ringlike lesions probably reflect acute inflammation at the edge of chronic demyelinating lesions. The change in the pattern of enhancement from early to delayed scans is explained by a lower blood-brain barrier permeability in the center as compared with the periphery, resulting in a slower rise in concentra-tion of contrast centrally. Demonstraconcentra-tion of disease activity through contrast enhancement helps satisfy the criteria of dissemination in time for the diagnosis of MS.
Our study shows that the natural history of MS primarily affecting the spinal cord is characterized by fluctuation in disease activity with time. Myelopathy was clinically improved or had deteriorated in 47% of follow-up visits and there was evidence of lesion pro-gression, lesion diminution, or both in 74% of fol-low-up MR examinations. A number of patients even had lesion progression and lesion diminution on the same examination. Previous studies in the brain have shown similar lesional fluctuation with time, presum-TABLE 1: Relationship between MR findings and clinical status of
myelopathy on 76 follow-up examinations
MR findings
Clinical Status of Myelopathy, no. of examinations
Deteriorated Improved or Stable Total
Lesion progression 7 21 28
Lesion diminution and/or stability
9 39 48
[image:7.587.55.282.85.180.2]Total 16 60 76
TABLE 2: Relationship between percentage of enhancement and mean functional scores at time 0, 2, 6, and 12 months in 25 patients
Time, mo
0 2 6 12
Percentage of enhancement
52% 16% 24% 12%
Sensory function 2.76 1.53 1.47 1.81
Pyramidal function 2.06 1.70 1.47 1.37
Bowel/bladder function 1.12 0.94 0.88 0.87
Ambulation index 2.82 2.06 2.06 1.87
EDSS score 4.06 2.94 2.88 2.75
Note.—The percentage enhancement is the number of patients with at least one enhancing lesion divided by the total number of patients times 100; there was a significant improvement in sensory function (P5
.002), ambulation (P 5 .029), and expanded disability status scale (EDSS) score (P5.002) between time 0 and 12 months.
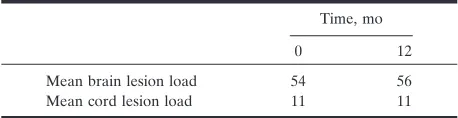
TABLE 3: Relationship between lesion load in the brain and cord with time in 19 patients who had lesion progression on follow-up MR examinations
Time, mo
0 12
Mean brain lesion load 54 56
[image:7.587.56.282.216.326.2] [image:7.587.54.283.426.485.2]ably reflecting a natural disease process (6, 12, 38). According to McFarland et al (38), new lesions do not develop at a constant rate but tend to occur in bursts of increased frequency, with a cyclical trend. The fluctuation in disease activity observed in our series was probably accentuated by the relatively large num-ber of patients with relapsing-remitting disease.
Agreement between MR and clinical evidence of disease activity was found in only 60% of follow-up examinations. Lesion progression was often present on MR images despite an absence of clinical deteri-oration. One explanation is that many patients have sequelae from previous myelopathic episodes and, in these patients, new signs and symptoms of myelopa-thy may not be clinically apparent. We believe that lesion progression on MR images is most likely a significant development in patients with MS, even in the absence of concurrent clinical deterioration. With the current level of technology, it is not possible to determine if the process is reversible or irreversible. Our study also showed that clinical deterioration fre-quently occurs despite an absence of lesion progres-sion on MR images. This finding is not surprising in view of the poor correlation between MR appearance and some functional systems. Discrepancy between MR and clinical findings has been reported by other investigators, particularly in the brain (4, 10, 12, 15, 33, 39). Serial MR imaging and clinical examinations are probably needed for adequate monitoring of MS disease activity in the spinal cord.
MR lesion progression was detected mainly by identifying new or enlarging hyperintense lesions on T2-weighted images, and the majority of these lesions were nonenhancing. In the brain, by comparison, most active lesions enhance (11, 14, 25, 33, 36). Since follow-up visits took place only at 2, 6, and 12 months, it is possible that enhancement was present at one point and had disappeared by the time MR imaging was performed. In addition, blood-brain barrier dis-turbance may be relatively subtle, requiring a double dose of contrast material for demonstration. When present, enhancement of spinal cord lesions was a marker of disease activity. It usually lasted less than 2 months, and loss of enhancement was accompanied by clinical improvement. Knowledge that enhance-ment is transitory is useful in clinical practice when the nature of an enhancing spinal cord lesion is in doubt. If the lesion is a consequence of MS, a fol-low-up examination is expected to show disappear-ance or decrease in enhdisappear-ancement with time. Besides T2-weighted hyperintense lesions and contrast en-hancement, cord atrophy is another potential marker of disease activity. Kidd et al (40) found that the cross-sectional area of the spinal cord at C-5 de-creased over the course of 1 year in 19 patients with progressive MS.
A large percentage of patients with spinal cord lesions also have lesions in the brain (5, 22, 23, 41, 42). Furthermore, in our sample, 81% of the total CNS lesion load was in the brain, compared with only 19% in the spinal cord. Thus, in patients with pre-dominating signs and symptoms of myelopathy, if
brain lesion count alone is used, approximately 19% of disease activity will be overlooked.
Conclusion
There is a moderate correlation between spinal cord lesion load and disability (EDSS score and sen-sory function) in patients with MS and myelopathy. Hyperintense lesions on T2-weighted images and con-trast enhancement on T1-weighted images are mark-ers of disease activity. There is a discrepancy between evolution of lesions on MR studies and clinical status of myelopathy on follow-up examinations. MR lesion progression occurs despite absence of clinical deteri-oration and vice versa. Both MR imaging and clinical examinations are needed to monitor disease activity in patients with MS primarily affecting the spinal cord.
References
1. Reese L, Carr TJ, Nicholson RL, Lepp EK.Magnetic resonance imaging for detecting lesions of multiple sclerosis: comparison with computed tomography and clinical assessment.Can Med Assoc J
1986;135:639–643
2. Paolino E, Granieri E, Tola MR, et al. The combined use of instrumental and laboratory examinations in multiple sclerosis: is the diagnosis really facilitated?Riv Neurol1990;60:73–81 3. Noakes JB, Herkes GK, Frith JA, McLeod JG, Jones MP.Magnetic
resonance imaging in clinically-definite multiple sclerosis.Med J Aust1990;152:136–140
4. Capra R, Marciano N, Vignolo L, Chiesa A, Gasparotti R. Gado-linium-pentetic acid magnetic resonance imaging in patients with relapsing remitting multiple sclerosis.Arch Neurol1992;49:687– 689
5. Kidd D, Thorpe JW, Thompson AJ, et al.Spinal cord MRI using multi-array coils and fast spin echo: findings in multiple sclerosis. Neurology1993;43:2632–2637
6. Van Walderveen MAA, Barkhof F, Hommes OR, et al.Correlating MRI and clinical disease activity in multiple sclerosis: relevance of hypointense lesions on short-TR/short-TE (T1-weighted) spin-echo images.Neurology1995;45:1684–1690
7. Honig LS, Sheremata WA.Magnetic resonance imaging of spinal cord lesions in multiple sclerosis.J Neurol Neurosurg Psychiatry
1989;52:459–466
8. Thompson AJ, Kermode AG, MacManus DG, et al.Patterns of disease activity in multiple sclerosis: clinical and magnetic reso-nance imaging study.Br Med J1990;300:631–634
9. Sinnige LGF, Teeuwissen E, Hew JM, Minderhoud JM. Correla-tion between magnetic resonance imaging and clinical parameters in multiple sclerosis.Acta Neurol Scand1995;91:188–191 10. Koopman RA, Li DKB, Oger JF, et al.Chronic progressive
mul-tiple sclerosis: serial magnetic resonance imaging over six months. Ann Neurol1989;26:248–256
11. Kermode AG, Thompson AJ, Tofts P, et al. Breakdown of the blood-brain barrier precedes symptoms and other MRI signs of new lesions in multiple sclerosis: pathogenetic and clinical impli-cations.Brain1990;113:1477–1489
12. Issac C, Li DKB, Genton RTR, et al.Multiple sclerosis: a serial study using MRI in relapsing patients. Neurology1988;38:1511– 1515
13. Harris JO, Frank JA, Patronas N, McFarlin DE, McFarland HF.
Serial gadolinium-enhanced magnetic resonance imaging scans in patients with early, relapsing-remitting multiple sclerosis: impli-cations for clinical trials and natural history.Ann Neurol1991;29: 548–555
14. Miller DH, Barkhof F, Nauta JJP.Gadolinium enhancement in-creases the sensitivity of MRI in detecting disease activity in mul-tiple sclerosis.Brain1993;116:1077–1094
15. Wiebe S, Lee DH, Karlik SJ, et al.Serial cranial and spinal cord magnetic resonance imaging in multiple sclerosis. Ann Neurol
1992;32:643–650
Multiple sclerosis: histopathologic and MR and/or CT correlation in 37 cases at biopsy and three cases at autopsy.Radiology1991; 180:467–474
17. Kuharik MA, Edwards MK, Farlow MR, et al.Gd-enhanced MR imaging of acute and chronic experimental demyelinating lesions. AJNR Am J Neuroradiol1988;9:643–648
18. Grossman RI, Lisak RP, Macchi PJ, Joseph PM. MR of acute experimental allergic encephalomyelitis.AJNR Am J Neuroradiol
1987;8:1045–1048
19. Ikuta F, Zimmerman HM.Distribution of plaques in seventy au-topsy cases of multiple sclerosis in the United States.Neurology
1976;8:26–28
20. Floris R, Bianco F, Rossi F, De La Paz R.The role of spinal cord MRI in the diagnosis of multiple sclerosis.Riv Neurol1987;57:170– 172
21. Uldry PA, Regli F, Uske A.Magnetic resonance imaging in pa-tients with multiple sclerosis and spinal cord involvement: 28 cases.J Neurol1993;240:41–45
22. Maravilla KR, Weinreb JC, Suss R, Nunnally RL.Magnetic reso-nance demonstration of multiple sclerosis plaques in the cervical cord.AJNR Am J Neuroradiol1984;5:685–689
23. Tartaglino LM, Friedman DP, Flanders AE, Lublin FD, Knobler RL, Liem M.Multiple sclerosis in the spinal cord: MR appearance and correlation with clinical parameters.Radiology1995;195:725– 732
24. Edwards MK, Farlow MR, Stevens JC.Cranial MR in spinal cord MS: diagnosing patients with isolated spinal cord symptoms.AJNR Am J Neuroradiol1986;7:1003–1005
25. Stone LA, Frank JA, Albert PS, et al.The effect of interferon-bon blood-brain barrier disruptions demonstrated by contrast-en-hanced magnetic resonance imaging in relapsing-remitting multi-ple sclerosis.Ann Neurol1995;37:611–619
26. Miller DH, Barkhof F, Berry I, Kappos L, Scotti G, Thompson AJ.
Magnetic resonance imaging in monitoring the treatment of mul-tiple sclerosis: concerted action guidelines. J Neurol Neurosurg Psychiatry1991;54:683–688
27. Miller DH.Magnetic resonance in monitoring the treatment of multiple sclerosis.Ann Neurol1994;36:S91–S94
28. McDonald WI, Miller DH, Thompson AJ.Are magnetic resonance findings predictive of clinical outcome in therapeutic trials in multiple sclerosis? The dilemma of interferon-b.Ann Neurol1994; 36:14–18
29. Poser CM, Paty DW, Scheinberg L, et al.New diagnostic criteria
for multiple sclerosis: guidelines for research protocols.Ann Neu-rol1983;13:227–231
30. Kurtzke JF.Rating neurological impairment in multiple sclerosis: an expanded disability scale.Neurology1983;33:1444–1452 31. Kidd D, Thompson AJ, Kendall BE, Miller DH, McDonald WI.
Benign form of multiple sclerosis: MRI evidence for less frequent and less inflammatory disease activity.J Neurol Neurosurg Psychi-atry1994;57:1070–1072
32. Evans AC, Frank JA, Antel J, Miller DH. The role of MRI in clinical trials of multiple sclerosis: comparison of image processing techniques.Ann Neurol1977:41:125–132
33. Barnes D, Munro P, Youl B, Prineas J, McDonald WI.The long-standing MS lesion.Brain1991;114:1271–1280
34. Matthews PM, Francis G, Antel J Arnold DL.Proton magnetic resonance spectroscopy for metabolic characterization of plaques in multiple sclerosis.Neurology1991;41:1251–1256
35. Imura H, Grossman RI, Lenkinski RE, Gonzalez-Scarano.Proton MR spectroscopy and magnetization transfer ratio in multiple sclerosis: correlative findings of active versus irreversible plaque disease.AJNR Am J Neuroradiol1996;17:1539–1547
36. Miller DH, Rudge G, Johnson G, et al.Serial gadolinium enhanced magnetic resonance imaging in multiple sclerosis.Brain1988;111: 927–939
37. Gonzalez-Scarano F, Grossman RI, Galetta S, Atlas SW, Silberberg DH.Multiple sclerosis disease activity correlates with gadolinium-enhanced magnetic resonance imaging.Ann Neurol1987;21:300– 306
38. McFarland HF, Frank JA, Albert PS, et al. Using gadolinium-enhanced magnetic resonance imaging lesions to monitor disease activity in multiple sclerosis.Ann Neurol1992;32:758–766 39. Barkhof F, Scheltens P, Frequin STFM, et al.Relapsing-remitting
multiple sclerosis: sequential enhanced MR imaging versus clinical findings in determining disease activity. AJR Am J Roentgenol
1992;159:1041–1047
40. Kidd D, Thorpe JW, Kendall BE, et al.MRI dynamics of brain and spinal cord in progressive multiple sclerosis.J Neurol Neurosurg Psychiatry1996;60:15–19
41. Oppenheimer DR.The cervical cord in multiple sclerosis. Neuro-pathol Appl Neurobiol1978;4:151–162