MRI of the brain and spinal cord in multiple sclerosis and
other disorders: Technical developments and clinical
applications
John W Thorpe, MA, MBBS, MRCP
NMR Research Unit
Institute of Neurology
Queen Square
LONDON WCIN 3BG
A thesis submitted for the degree of Doctor of Medicine to
The University of London
ProQuest Number: 10015706
All rights reserved
INFORMATION TO ALL USERS
The quality of this reproduction is dependent upon the quality of the copy submitted. In the unlikely event that the author did not send a complete manuscript and there are missing pages, these will be noted. Also, if material had to be removed,
a note will indicate the deletion.
uest.
ProQuest 10015706
Published by ProQuest LLC(2016). Copyright of the Dissertation is held by the Author. All rights reserved.
This work is protected against unauthorized copying under Title 17, United States Code. Microform Edition © ProQuest LLC.
ProQuest LLC
789 East Eisenhower Parkway P.O. Box 1346
ABSTRACT
Magnetic resonance imaging (MRI) has greatly advanced our knowledge of multiple
sclerosis. It has proved particularly useful in diagnosis and in understanding the natural
history and pathophysiology of the disease. MRI is now increasingly being used as a
sunogate marker of disease activity in the context of clinical trials. Nevertheless, major
limitations of the technique remain. The MRI findings in the brain are not specific. Similar
appearances can be found in a variety of other conditions affecting the central nervous
system, as well as with normal aging. There remains a poor correlation between lesion load
on brain MRI and measures of disability. There is clearly a need for improved imaging of
the brain and in particular the spinal cord: the cord is of great significance in the
development of disability in MS but has proved technically more demanding to study. In
the first section of this work recent advances in pulse sequence design (including fast spin
echo, fast FLAIR and fast STIR) and receiver coil technology (multi-array coils) are
described. In the second section, the new pulse sequences are examined in a series of
comparative studies; these conclude that fast spin echo can replace conventional spin echo
as the T2-weighted sequence of choice in routine diagnostic imaging. In conjunction with multi-array coils, fast spin echo allows the reliable and rapid detection of MS lesions
within the spinal cord. Cross-sectional and serial studies in MS are described. The final two
chapters describe the application of the new technology to the differential diagnosis of MS,
investigating the role of MRI in the diagnosis of motor neuron disease and spinal
CONTENTS
Abstract
List of tables
List of figures
List of abbreviations
Acknowledgements
Papers arising from this work
2 5 6 8 11 12
PART A: BACKGROUND
1: 2: 3: Introduction Technical background Technical advances 14 15 28 43
PART B: CLINICAL APPLICATIONS
4;
5:
6:
7:
8:
A comparison between fast spin echo and conventional
spin echo in the detection of multiple sclerosis lesions
A comparison between fast FLAIR and fast spin echo in
the detection of multiple sclerosis lesions
Multi-array spinal cord imaging in multiple sclerosis
and healthy controls
Short Tau Inversion Recovery Fast Spin Echo (Fast STIR)
imaging of the spinal cord in multiple sclerosis
Spinal MRI in patients with suspected multiple sclerosis
and negative brain MRI
9: Serial gadolinium-enhanced MRI of the brain and spinal
cord in early relapsing-remitting multiple sclerosis 115
10: Brain and spinal cord MRI in motor neuron disease 127
11: Dynamic gadolinium-enhanced MRI in the detection of spinal
arteriovenous malformations 135
12: Conclusions 153
LIST OF TABLES
1.1. MRI and the Poser criteria. 18
1.2. The Fazekas criteria. 19
2.1. Nuclei occurring in biological tissues that possess the property of "spin". 28
2.2. T^, Tj and proton density weighting according to TR and TE. 35
4.1. Lesions detected on SE. 57
4.2. Lesions detected on FSE. 59
4.3. Lesions detected by SE vs FSE. 61
5.1. Contrast to noise ratios for short TE^f FSE and fFLAIR. 73
6.1. Clinical and MRI characteristics of controls and MS patients. 84
7.1. Numbers of lesions identified by FSE and fSTIR. 101
7.2. SNR and CNR measurements with FSE and fSTIR. 102
8.1. Clinical and MRI characteristics. 108
9.1. Relationship between relapse and new brain and cord lesions. 122
9.2. Changes in spinal cord area by vertebral level. 123
LIST OF FIGURES
Frontispiece. The author. 10
1.1. I MR image of the brain in MS. 16
2.1. Alignment of protons in an applied magnetic field. 29
2.2. Nutation of the magnetic moment by an RF pulse. 30
2.3. Precession of protons. 32
2.4. The spin echo pulse sequence. 34
2.5. Generation of a spin echo. 34
2.6. Slice selection. 36
2.7. Fourier transformation. 37
2.8. k-space. 39
2.9. Axial MR image of the brain and its k-space equivalent. 39
3.1. Multi-array coils vs conventional surface coils. 44
3.2. Uniformity correction of sagittal spinal image. 46
3.3. The outer vs central lines of k-space. 50
3.4. STIR: The effects of the inversion pulse. 51
3.5. FLAIR: The effects of the inversion pulse. 52
4.1. Axial SE vs FSE images of the brain. 65
5.1. Signal intensity of CSF and white matter vs inversion time. 70
5.2. Lesion/white matter contrast as a function of TE^f. 71
5.3. FSE vs fFLAIR (TI=1650 ms). 72
5.4. FSE vs fFLAIR (TI=2300 ms). 73
5.5. Predicted white matter/lesion signal contrast vs TE. 75
6.2. Axial GE images showing MS lesion. 80
6.3. r2-weighted image showing disc protrusion at T9/10. 8 6 6.4. Degenerative vertebral changes and lesions by disc level. 87
6.5. Axial GE image showing grey/white differentiation. 8 8
7.1. I Lesion better seen on FSE than fSTIR. 9 9
i
7.2. Lesion better seen on fSTIR than FSE. 100
j
8.1. ! Multiple spinal cord lesions with only a solitary subcortical brain lesion. %iq
9.1. Concordance of brain and spinal cord activity. 121
10.1. High signal within the pyramidal tracts in MND. 131
10.2. Low signal within the motor cortex. 131
10.3. High signal within the spinal cord. 132
11.1. T2-weighted FSE showing intramedullary AVM. 141
11.2. Intramedullary AVM: reduced signal during passage of Gd-DTPA bolus. 142
11.3. Intramedullary AVM: dynamic series as subtraction images. 142
11.4. T2-weighted FSE of durai A VF. 145
LIST OF ABBREVIATIONS ADEM A/P AVF AVM Bo C CDMS CS CSF CNR CNS CPMS D df EDSS ETL fFLAIR FLAIR FOV FSE fSTIR Gd-DTPA GE Hz LSDMS MRI MND MS MT Mo NMR
Acute disseminated encephalomyelitis Antero-posterior
Arteriovenous fistula
Arteriovenous malformation Static magnetic field
Cortical
Clinically definite multiple sclerosis Confidence score
Cerebrospinal fluid Contrast to noise ratio Central nervous system
Clinically probable multiple sclerosis Discrete
Degrees of freedom
Expanded disability status scale Echo train length
Fast fluid attenuated inversion recovery Fluid attenuated inversion recovery Field of view
Fast spin echo
Fast short tau inversion recovery
Gadolinium diethylenetriamine pentaacetic acid Gradient echo
Hertz, cycles per second
Laboratory supported definite multiple sclerosis Magnetic resonance imaging
Motor neuron disease Multiple sclerosis Magnetisation transfer Magnetic moment
OCB Oligoclonal band
PD Proton density
FF Posterior fossa
PV Periventricular
RARE Rapid acquisition with relaxation enhancement
RF Radiofrequency
SB Spin echo
SI Signal intensity
S/I Supero-inferior
SNR Signal to noise ratio
STIR Short tau inversion recovery
T Tesla
TE Echo time
TEef
Effective echo timeTI Inversion time
TR Repetition time
T,
Longitudinal relaxation timeT2
* Transverse relaxation timer ; Field inhomogeneity/susceptibility modified T2
Y Gyromagnetic ratio
a Noise in high SNR region of image
f d ë e
' f „>îsî
. * ^ 3 /
k N
4
^ /SI
"^
f \ T
Frontispiece. The author.
ACKNOWLEDGEMENTS
The NMR Research Unit at the Institute of Neurology, Queen Square, London, where the
work described in this thesis was carried out, receives the generous support of the Multiple
Sclerosis Society of Great Britain and Northern Ireland. The work was funded by a project
grant from the Medical Research Council.
I am grateful to my supervisor Professor David Miller for his direction, advice and, latterly,
patience. I am also most grateful to Professor Ian McDonald for his many insights. Dr
Gareth Barker and Dr Paul Tofts provided much of their time and expertise and developed
the uniformity correction algorithm used on all the spinal images in this work.
I collaborated with Dr Desmond Kidd in collecting the patient data described in chapter 6. He was the second observer for the measurement of spinal cord atrophy.
Dr Ivan Moseley, Dr Brian Kendall and Dr Sean Halpin provided expert radiological
assistance. Dr Kendall also performed all the spinal angiograms described in chapter 11.
I would like to thank Amanda Brennan, Stephanie Webb and David MacManus who
carried out all the imaging. David MacManus in particular was also an excellent source of
sound advice on all aspects of NMR.
Finally, I am most indebted to all the patients who gave up their time to participate in the
PAPERS ARISING FROM THIS WORK
Thorpe JW, Kidd D, Kendall BE, Tofts PS, Barker GJ, Thompson AJ, MacManus DO,
McDonald WI, Miller DH (1993) Spinal cord MRI using multi-array coils and fast spin
echo I: Technical aspects and findings in healthy adults. Neurology, 43, 2625-2631.
Kidd D, Thorpe JW, Thompson AJ, Kendall BE, Moseley I, MacManus DO, Miller
DH, McDonald WI (1993) Spinal cord MRI using multi-array coils and fast spin echo
II: Findings in multiple sclerosis. Neurology, 43, 2632-2637.
Thorpe JW, Miller DH (1994) MRI: its application and impact. International MS
Journal, 1, 7-16.
Thorpe JW, Halpin SF, MacManus DO, Barker GJ, Kendall BE, Miller DH (1994) A
comparison between fast spin echo and conventional spin echo in the detection of
multiple sclerosis lesions. Neuroradiology, 36, 388-392.
Thorpe JW, Kendall BE, MacManus DG, McDonald WI, Miller DH (1994) Dynamic
gadolinium enhanced MRI in the detection of spinal arteriovenous malformations.
Neuroradiology, 36, 522-529.
Thorpe JW, MacManus DG, Kendall BE, Tofts PS, Barker GJ, McDonald WI, Miller
DH (1994) Short Tau Inversion Recovery Fast Spin Echo (Fast STIR) imaging of the
Thorpe JW, Barker GJ, MacManus DG, Moseley IF, Tofts PS, Miller DH (1994)
Detection of multiple sclerosis by magnetic resonance imaging. Lancet, 344, 1235.
Thorpe JW, Kidd D, Moseley IF, Thompson AJ, MacManus DG, Compston DAS,
McDonald WI, Miller DH (1996) Spinal multiple sclerosis: a clinical and MRI study.
Brain, 119,709-714.
Thorpe JW, Moseley IF, Hawkes CH, MacManus DG, McDonald WI, Miller DH
(1996) Brain and spinal cord MRI in motor neuron disease. J Neurol Neurosurg
Psychiatry, 61, 314-7.
Thorpe JW, Kidd D, Moseley IF, Kendall BE, Thompson AJ, MacManus DG,
McDonald WI, Miller DH (1996) Serial gadolinium-enhanced MRI of the brain and
spinal cord in early relapsing-remitting multiple sclerosis. Neurology, 46, 373-378.
ADDENDUM
In all the studies described herein ethical approval was obtained and all subjects
participating gave their written informed consent.
Chapter 1: Introduction
MAGNETIC RESONANCE IMAGING
Magnetic resonance imaging (MRI) has had an enormous impact on medicine; it has
revolutionised the investigation of neurological disorders in general and multiple sclerosis
(MS) in particular. Although MRI is quite new, the principles of nuclear magnetic
resonance (NMR) upon which it is founded were first described in 1946 by Bloch and
Purcell, who shared the Nobel Prize in 1952. For the first 25 years NMR was used solely
for the non-destructive chemical analysis of small samples (magnetic resonance
spectroscopy). During the 1970s it was shown that the hydrogen nuclei (protons) within
a variety of different normal and pathological tissues had different NMR properties, in
particular longitudinal (T^) and transverse {T^ relaxation times (see chapter 2^ and that it was possible to use these differences to generate images (Damadian, 1971; Lauterbur,
1973; Hinshaw et al, 1977). The first clinically useful images were published in 1980
(Edelstein et al, 1980; Holland et al, 1980) and the first images of MS lesions in the brain
the following year (Young et al, 1981). MRI has subsequently been of great value in the
investigation of MS in four main areas: first, as a diagnostic tool; secondly as a prognostic
indicator; thirdly as a means of studying the underlying pathophysiology and natural history
of the disease; and finally as a surrogate measure of treatment efficacy.
DIAGNOSIS
MRI of the brain consistently demonstrates the lesions of MS (Young et al, 1980; Lukes
et a l, 1983; Runge et al, 1984; Jackson et al, 1985; Sheldon et al, 1985; Scotti et al,
Figure 1.1. Moderately 72-weighted axial spin echo images (TR=2000 ms, TE=32 ms): (a) at the level of the lateral ventricles, showing multiple white matter lesions, predominantly around the ventricles. A subcortical lesion is arrowed; (b) through the posterior fossa. There are lesions within the cerebellar white matter (horizontal arrow) and left cerebellar peduncle (vertical arrow).
definite disease (Runge et ai, 1984; Ormerod et al, 1987). The typical findings are of
multiple white matter lesions (showing as bright areas on proton density or T2-weighted sequences) predominantly around the lateral ventricles but also involving the brainstem and
cerebellum (figure 1.1). Lesions at the corticomedullary junction are also found (Miller,
1988) and may be helpful in differentiating the MRI appearances of MS from those of
subcortical arteriosclerotic encephalopathy (Binswanger's disease) in which the U-fibres
are spared (Revesz et ai, 1989). The corpus callosum is often involved, a finding which
seems to be relatively specific to MS and which is best appreciated on sagittal images
(Gean-Marton et al, 1991). Lesions are often irregular in shape, although ovoid and
spherical lesions are also found (Horowitz et al, 1989). In brains scanned postmortem,
areas of signal change on MRI have been shown usually to correspond with chronic
plaques demonstrated histopathologically (Stewart et al, 1984; Ormerod et al, 1987),
although MR abnormalities (possibly representing diffuse oedema) have been reported in
the absence of microscopically demonstrable lesions (Newcombe et al, 1991).
It should be emphasised that the diagnosis of MS is a clinical one, requiring the
demonstration of characteristic symptoms and signs of lesions disseminated within the
central nervous system in time and space. MRI is not always necessary but can be of great
value in providing support for the diagnosis, which may as a result be made earlier and
with a greater degree of certainty in many cases. The most commonly used diagnostic
criteria, originally drawn up for the purposes of research, are those of the Poser committee
(Poser et al, 1983). By these criteria, a patient (aged 10-59 years) who has had two attacks
characteristic of MS, in the absence of an alternative condition, with clinical evidence of
two separate central nervous system (CNS) lesions has "clinically definite" MS.
"Paraclinical" evidence of one of the lesions, such as characteristic abnormalities on MRI
or electrophysiological recordings (evoked potentials) will suffice. Therefore, in patients
who have had two or more attacks but have clinical evidence of only one lesion, the finding
of multiple MRI abnormalities characteristic of MS makes a definite diagnosis possible
(CDMS, table 1.1). In patients who have had but a single attack, with clinical evidence of
only the symptomatic lesion, the finding of multiple MRI abnormalities is not diagnostic
since the same pattern could be due to the monophasic demyelinating disorder, acute
disseminated encephalomyelitis (ADEM) (Atlas et al, 1986; Dunn et al, 1986; Kesselring
et a l, 1990; Caldemeyer et al, 1994). If however, follow up MRI after more than one
month reveals new lesions, a diagnosis of clinically probable MS (CPMS) can be made,
present in the cerebrospinal fluid, the diagnosis is then "laboratory-supported definite MS"
(LSDMS).
MRI Poser classification
Two attacks; clinical evidence + CDMS
of two lesions - CDMS
Two attacks; clinical evidence + CDMS
of one lesion - CPMS
One attack; clinical evidence of + (with new lesions developing) CPMS
one lesion - Not diagnostic
One attack; clinical evidence of + (with new lesions developing) LSDMS
one lesion +CSF OCBs - Not diagnostic
Table 1.1. MRI and the Poser criteria. Situations in which a positive MRI scan permits a
more certain diagnosis are shown in bold.
Differential diagnosis
Multifocal white matter lesions as seen by MRI are not unique to MS. They are found
increasingly often in healthy subjects with advancing age (Brant-Zawadzki et a l, 1985;
Awad e ta l, 1986; George etal, 1986; Gerard and Weisberg, 1986; Fazekas e ta l, 1988a;
Hunt et al, 1989), where they are probably caused by small-vessel disease (Kirkpatrick and
Hayman, 1987; Braffman et al, 1988). Criteria to improve specificity have been
developed, most notably by Fazekas and colleagues (1988b) (table 1.2). Evaluation of these
criteria in 1500 consecutive patients yielded a sensitivity of 75 per cent and specificity of
At least three lesions and two of:
1. A lesion abutting the bodies of the lateral ventricles. 2. An infratentorial lesion.
3. A lesion of > 6 mm in diameter.
Table 1.2. The Fazekas criteria.
Nevertheless, a variety of neurological conditions can cause white matter abnormalities,
including ADEM (see above), Behçet’s disease (Miller et al, 1987a; Morrissey et a l,
1993a), cerebral fat embolism (Kawano etal, 1991; Erdem etal, 1993), HIV encephalitis,
progressive multifocal leukoencephalopathy (Olsen et al, 1988; Hawkins et al, 1993),
neurosarcoidosis (Miller etal, 1988c; Khaw etal, 1991), phenylketonuria (Thompson et
a l, 1993) and systemic lupus erythematosus (Miller et al, 1992). The findings in motor
neuron disease will be considered further in chapter 1 0.
Newer MR techniques may provide improved specificity. Gass et al (1994) carried out
magnetisation transfer (MT) imaging in a small number of patients with asymptomatic
vascular disease and shown differences between vascular and demyelinating lesions. MR
spectroscopy can now provide information about the biochemical make-up of lesions in
vivo (Richards, 1991; Davie e ta l, 1994), although it is still too early to define its precise
diagnostic role.
Spinal cord
The most obvious role of spinal imaging in the differential diagnosis of MS has been to
exclude a compressive lesion in patients presenting with a myelopathy. Yet the importance
of spinal cord MRI in directly supporting the diagnosis of MS is growing and this topic
to obtain satisfactory images of the spinal cord than the brain. In chapter 3 some of the
recent technical advances (in particular fast spin echo and multi-array coils) that have
facilitated spinal imaging are described. Using these techniques intrinsic cord lesions can
be identified in three-quarters of patients with MS (chapter 6). Such lesions are rare in healthy subjects even with advancing age, suggesting that spinal imaging can increase the
specificity of MRI in the diagnosis of MS. Spinal cord MRI can in addition improve
sensitivity as there is an important subgroup of patients with MS who have normal or near
normal brain MRI and yet have lesions in the spinal cord. These are considered in chapter
8.
Optic nerve
The optic nerve is often involved in MS, with optic neuritis occurring in approximately
three quarters of patients at some stage. MRI detects lesions within the optic nerve with
high sensitivity, using either the short tau inversion recovery (STIR) pulse sequence (Miller
et fl/., 1988b, see chapter 3) or, more recently, frequency-selective fat suppression
techniques (Lee et al, 1991a; Miller et al, 1993a; Gass et a l, 1995) to reduce signal
intensity of orbital fat. MRI is not needed in the majority of patients but is of value in
atypical cases, especially those with progressive visual loss, in whom a tumour must be
carefully excluded (Eidelberg et al, 1988). Optic nerve MRI can be of value in the
differential diagnosis of patients with acute or subacute visual loss. In anterior ischaemic
optic neuropathy the MRI is normal during the acute phase, although high signal develops
after several months (Gass et al, 1995), whereas in optic neuritis there is abnormal signal
in both acute and chronic lesions (Miller et al, 1988b). In tobacco-alcohol amblyopia MRI
signal change within the optic nerves, although this tends to spare the anterior portion of
the nerves (Kermode et al, 1989b).
PROGNOSIS
Many studies have shown that patients presenting with an isolated syndrome of the type
found in MS, including optic neuritis, acute partial myelitis and brainstem syndromes,
frequently have asymptomatic cerebral white matter lesions indistinguishable from MS
(Jacobs et al, 1986; Ormerod et al, 1986a,b; Miller et al, 1987b; Paty et al, 1988; Stadt
et a l, 1990; Frederiksen et al, 1991; Martinelli et al, 1991; Ford et al, 1992). Several
studies have now examined the prognostic significance of brain MRI in patients with
isolated syndromes (Frederiksen etal, 1991; Martinelli eta l, 1991; Lee eta l, 1991; Ford
e ta l, 1992; Jacobs etal, 1991; Morrissey etal, 1993; Beck eta l, 1993; O’Riordan etal,
1998). The maximum follow-up is now ten years (O’Riordan et al, 1998). The consensus
is clear: the presence of a normal or near normal MRI scan at presentation makes the
medium term risk of developing clinically definite MS low; with multiple white matter
lesions the risks are much greater. 10/12 of Ford's series of 15 patients with acute partial
myelitis (Ford et a l, 1992) who had periventricular white matter lesions had developed
clinically definite MS at three years (and one other had new MRI lesions). In Morrissey’s
series of 89 patients followed up at five years, 37/57 (65 per cent) patients with an
abnormal scan at presentation had progressed to clinically definite MS, whilst only 1/32
with a normal scan had done so (Morrissey et al, 1993); eighty-one of these patients were
subsequently followed up at ten years, at which time the proportions were 45/54 (83 per
cent) and 3/27 (11 per cent) respectively (O’Riordan et al, 1998). The number of lesions
two to five years (Lee et al, 1991; Beck et al, 1993; Morrissey et al, 1993; Filippi et al,
1994). Longer follow-up is still required to assess the very long term risks in a disease that
usually runs its course over two or three decades.
NATURAL HISTORY AND PATHOPHYSIOLOGY
The microscopic pathological appearances of the MS lesion are of inflammation,
demyelination, gliosis and a variable degree of axonal loss (Carswell, 1838; Cruveilhier,
1842; Charcot, 1868; Dawson, 1916). Plaques examined by electron microscopy may
demonstrate expansion of the extracellular space (Périer and Grégoire, 1965). The degree
of expansion is variable and possibly correlates with the degree of axonal loss (Barnes et
a l, 1991). Active lesions show evidence of inflammation and breakdown of the blood-
brain barrier (Gay and Esiri, 1991). A degree of remyelination is sometimes found,
especially in the early lesion or in patients with short disease duration (Lassmann, 1983;
Prineas et a l, 1993). MRI enables the detailed study of the MS lesion in vivo and has
greatly enhanced our understanding of the disease. The lack of known side effects of MRI
(excluding subjects with metallic implants (Shellock et al, 1993; Klucznik et al, 1993))
permits repeat examinations at frequent intervals providing dynamic information not
available by any other method. Serial studies have shown that in early relapsing/remitting
and secondary progressive MS new lesions in the brain develop five to ten times more
frequently than clinical relapses (Isaac et al, 1988; Willoughby et al, 1989, Truyen et al,
1991). The breakdown in the blood-brain barrier found early in developing and active
lesions (Gay and Esiri, 1991) can be shown on -weighted MRI scans as areas of
enhancement following injection of the paramagnetic contrast agent gadolinium-
1990; Harris e ta l, 1991; Thompson etal, 1991; Barkhof e ta l, 1992a; Capra eta l, 1992;
McFarland et al, 1992). Rarely, Gd-DTPA enhancement can be seen prior to signal change
appearing on 7^-weighted images (Kermode et al, 1990a). Enhancement following Gd-
DTPA has been shown to correlate with inflammation both in the animal model of MS,
experimental allergic encephalomyelitis (Hawkins et al, 1990), and in one patient with MS
who died from unrelated causes soon after an MRI scan (Katz et al, 1993). Gd-DTPA
enhancement usually lasts for a period of two to six weeks. More or less coincident with
the onset of Gd-DTPA enhancement is the appearance of signal change on 7^-weighted
images. The area of signal change initially increases in size over a period of weeks,
probably due to the presence of vasogenic oedema (Barnes et al, 1987). The lesion then
shrinks but in the vast majority of cases (especially with higher field MRI scanners) leaves
a residual abnormality which probably represents residual demyelination, axonal loss or
gliosis (see below). Although the majority of Gd-DTPA-enhancing lesions are
asymptomatic, the presence of enhancing lesions is more common during clinical relapse
(Grossman et al, 1986; Smith et al, 1993). In acute optic neuritis the presence of Gd-
DTPA leakage in the symptomatic lesion is associated with acute reversible clinical deficit
and reduced amplitude of the visual evoked potential, suggesting that inflammation and
barrier breakdown may result in conduction block (Youl et al, 1992). Although MRI can
readily demonstrate blood brain barrier breakdown, conventional imaging is unable to
distinguish the various pathologies (oedema, axonal loss, demyelination and gliosis) that
constitute the MS lesion. A variety of newer MR techniques are now being applied such
as the analysis of Tj decay curves (Barnes et al, 1991), magnetisation transfer imaging
(Dousset et al, 1992; Lexa et al, 1994; Gass et al, 1994), diffusion imaging (Larsson et
techniques should provide a deeper understanding of the pathological nature of individual
lesions, how they change over time and how these changes relate to the clinical state.
MONITORING TREATMENT
Perhaps the most important outcome of the last ten years' research is that MRI has emerged
as a highly sensitive and independent marker of disease activity that can be used in the
context of trials of experimental treatments (Kappos et al, 1988; Miller et al, 1996). Using
purely clinical outcome measures (for instance the expanded disability status scale and
functional system scores of Kurtzke (1983)), given the natural tendency of the disease to
remit spontaneously, treatment trials require large numbers of patients to be studied over
a period of years for a study to have any power to detect a treatment effect. Until recently
no treatment had been shown to have a convincing beneficial effect on the long term course
of the disease. The positive results of the North American interferon beta study (The IFNB
Multiple Sclerosis Study Group, 1993) were therefore welcome news. The study group
consisted of 372 patients with mild relapsing-remitting MS, randomised to receive placebo,
or one of two different doses of subcutaneous interferon P-lb. The patients were followed
up both clinically and with MRI. All patients had total lesion areas measured from yearly,
unenhanced, 72-weighted brain images. Treatment was associated with a modest but significant reduction in relapse rate and severity of relapse. There was no overall effect on
disability, which was to be expected given the relatively mild relapsing-remitting disease
status of patients. The most encouraging finding was the clear and highly significant effect
on the rate of accumulation of lesions as judged by MRI (Paty et al, 1993). In the higher
dose group, the total area of brain lesions remained essentially static over the first two
Furthermore, in a subgroup of 52 patients who had frequent, serial, unenhanced 7^-
weighted scans, treatment was associated with a 75 per cent reduction in the median
number of new lesions formed. Subsequent follow-up for up to five year continued to show
a significant reduction in the rate of lesion accumulation in the treated group compared to
placebo, although the clinical effects were less significant, possibly due to the number of
non-completers (The IFNB Multiple Sclerosis Study Group, 1995).
Slightly different results were obtained from a phase III trial of intramuscular interferon
P-la in 301 patients with relapsing-remitting MS. Although the trial has been criticised for
being terminated early, it showed a similar significant reduction in relapse rate. However,
it also demonstrated a significant delay in disease progression (Jacobs et al, 1996) in the
treated group. The MRI results were less impressive than the interferon P-lb study, with
only a trend towards lower T2 lesion volume in the treated group albeit with a significant
reduction in Gd-DTPA-enhancing lesions.
THE CURRENT WORK
While the positive results of the interferon p studies are welcome news for MS patients and
neurologists alike, there are serious questions remaining concerning the relationship
between MRI activity and the rate of accumulation of clinical disability in the long term.
There is a seeming paradox between the superior MRI results of the interferon p-lb study
but better clinical outcome in the interferon P-la study. In neither cohort was there a good
correlation between MRI measures and clinical change (The IFNB Multiple Sclerosis
Study Group, 1995; Simon et al, 1998). Furthermore, in the interferon P-lb study the low
and yet progressed at least as rapidly as, if not faster than, the placebo group.
Central to this issue is the consistent observation that lesion load in the brain as measured
by MRI correlates poorly with disability (Li et al, 1984; Koopmans et al, 1989;
Baumhefner et al, 1990). In patients presenting with an isolated syndrome (see above)
there is evidence that change in lesion burden correlates with disability at follow up
(Filippi et al, 1994; O’Riordan et al, 1998). This may however in part be due to bias
caused by patients in this cohort who developed neither new lesions nor further disability
over time and who do not have MS. In patients with definite MS there is only a modest
correlation between change in lesion load and disability over time (Filippi et al, 1995).
Part of this poor correlation certainly relates to the lack of specificity of the changes on
conventional MRI, as discussed above, as well as to imprecision and inaccuracy in the
methods used to quantify lesion load and in the measures of disability. In addition however,
lesion ascertainment has been suboptimal. Not only does it seem likely that conventional
sequences fail to detect all the important lesions within the brain but conventional studies
have also ignored an extremely important lesion site, the spinal cord.
Lesion detection
Although conventional 7^-weighted spin echo images demonstrate the lesions of MS with
high sensitivity they are time consuming to acquire. Furthermore, contrast between lesions
and adjacent tissues (grey and white matter, cerebrospinal fluid) is at times poor. As a
result it seems likely that some pathologically significant lesions are not seen. Chapter 3
describes some of the strategies that have been developed which may improve lesion
provide different contrast (fast STIR and fast FLAIR). Their application and evaluation are
described in subsequent chapters.
Spinal cord imaging
Pathological involvement of the spinal cord in MS is usual and often extensive (Fog, 1950;
Ikuta and Zimmerman, 1976; Oppenheimer, 1978; Allen, 1991) and is the determinant of
much of the disability, in particular bladder and bowel dysfunction, weakness and
spasticity. One might therefore expect a better correlation of spinal cord than brain lesions
with disability. Technical limitations have previously made this issue difficult to address,
only one study reporting any such correlation (Honig and Sheremata, 1989). Using the
technical advances described in chapter 3, a large cross-sectional study was carried out
(chapter 6). Chapter 8 outlines a longitudinal study in relapsing-remitting MS, investigating the dynamics of spinal cord disease over time. The role of spinal MRI in two other
disorders which involve the cord and may at times be difficult to distinguish from MS
Chapter 2: Technical background
NUCLEAR MAGNETIC RESONANCE
Nuclear
Matter is made up of molecules and molecules of atoms. The atom can be considered to
consist of three basic building blocks; negatively charged electrons orbit a nucleus
consisting of positively charged protons and uncharged neutrons. As the name implies,
NMR concerns itself with atomic nuclei. These behave as though they are spinning (and
are therefore referred to as "spins"). Only those that possess an odd number of protons,
neutrons can be used in NMR. A number of such atomic species occur in biological
tissue (table 2.1) of which the simplest and by far the most abundant is hydrogen, most of
which is in the form of water. This work is concerned solely with the hydrogen proton and
other nuclei will not be considered further. Charged spinning nuclei such as the hydrogen
proton produce a magnetic moment, analogous to the magnetic (North and South) poles
resulting from the spinning of the earth. Protons are therefore magnetic dipoles.
Atomic nucleus Protons Neutrons
'H One None
Six Seven
Nine Ten
3 1 p Fifteen Sixteen
Table 2.1. Nuclei occurring in biological tissues that possess the property of "spin".
Magnetic
In the absence of any applied magnetic field, no orientation of the magnetic dipoles is more
aligned. There is therefore no net magnetic moment in any direction (figure 2.1a).
However, if the protons are placed in a static magnetic field (conventionally termed Bq),
they tend to line up parallel or antiparallel to Bq. A slight excess of protons align parallel
with the result of small net magnetic moment (Mq) aligned along Bq (figure 2.1b). This
Figure 2.1. In the absence of an applied magnetic field the protons are arranged randomly
(a). When an external magnetic field is applied the protons align, creating a net magnetic moment (b).
magnetic moment is known as longitudinal magnetisation and is directly proportional to
the strength of Bq. The field strength of most modem MR imagers is between 0.1 and 1.5
Tesla (T), up to 30,000 times stronger than the earth's own magnetic field (50 pT). To
generate the higher field strengths superconducting magnets are generally used.
Resonance
If an oscillating magnetic field of the correct frequency is then applied perpendicular to Bq
the protons will resonate. The frequency required to induce resonance, the Larmor
frequency, depends on the field strength and is given by the equation:
where co = Larmor frequency (measured in cycles per second [Hertz, Hz])
y = gyromagnetic ratio (measured in radians/sec/T), which is a constant for
a particular nucleus. 1 Hz = 27t radians/sec.
The Larmor frequency for protons at 1.5 T is approximately 64 MHz. As this is in the
shortwave radio band of the electromagnetic spectrum, the short duration oscillating
magnetic fields used to induce resonance are referred to as radiofrequency (RF) pulses.
When an RF pulse is applied to the protons it has the effect of tipping them out of their
alignment along Bq and they begin to "process" about Bq in ever increasing circles. This is
illustrated in figure 2.2, where an RF pulse has been applied in the horizontal (xy) plane,
with the Bq field lying along the vertical (z) axis. The longer the duration and the greater
the amplitude of the RF pulse the greater the angle, a, through which they are tipped. RF
pulses are often considered in terms of this nutation angle rather than their amplitude and
duration, a "90° pulse" being one that tips the protons through 90°.
Figure 2.2. Nutation of the magnetic moment by an RF pulse.
-Longitudinal and Transverse relaxation
When the RF pulse is switched off the protons return to their equilibrium position aligned
with Bq. They do not instantaneously revert to their original orientation but once again
precess about Bq, this time in ever decreasing circles. The rate which they precess both
during excitation and relaxation is equal to the Larmor frequency. As the protons return to
their equilibrium state, longitudinal magnetisation increases back to Mg. This process is
known as longitudinal relaxation and the rate at which it occurs is described by an
exponential time constant, Tj.
Ignoring relaxation for a moment, following excitation by an RF pulse the motion of a
proton in the transverse plane describes a circle as it precesses. This results in an oscillating
magnetic field, known as transverse magnetisation. Oscillating magnetic fields can induce
an electrical current in a wire loop or coil. Detection of the oscillating transverse
magnetisation by appropriately placed "receiver" coils is the basis for all NMR
measurements.
It is obviously not possible to measure the tiny magnetic moment generated by a single
proton but only the net moment generated by a large collection of protons. This requires
that they all be precessing synchronously or "in phase" (figure 2.3). The protons will in fact
begin to precess in phase, having been aligned (along Bg) before the application of the
initial RF pulse. As the rate at which they precess depends on the field strength, one might
expect them to continue in phase, assuming Bg to be completely homogeneous. However,
Figure 2.3. Only when protons precess in phase do they create a net oscillating magnetic field.
experiences. They all therefore precess as very slightly different rates and gradually lose
phase coherence. This process is known as transverse (or spin-spin) relaxation, and is
described by an exponential time constant T2. In real situations Bq is never completely
homogeneous. This results in even more rapid dephasing of spins, occurring with a time
constant 7^*. 7^* is therefore always shorter than 7^. As transverse relaxation occurs more
rapidly than longitudinal relaxation, 7^ is shorter than T^.
MAGNETIC RESONANCE IMAGING
The relaxation times and T2 depend on the chemical environment of the protons. Protons
within complex macromolecules such as proteins, carbohydrates and lipids readily lose
their magnetism to surrounding molecules. Their relaxation times are therefore so short
that they are effectively "invisible" in conventional MR images. The same is largely true
of protons within water that is tightly bound to the surface of these macromolecules. It is
mainly the protons within unbound ("free") water, where relaxation takes longer (of the
seconds for longitudinal relaxation), that are "visible". Different tissues possess different
quantities of "free" protons ("proton density"); furthermore, subtle variations in the
chemical environment of the protons produce differences in and 7^. Variations in 7^
and proton density are the most important determinants of contrast within conventional MR
images.
In order to produce images there are two requirements. First, that protons with different
NMR characteristics can be distinguished; for this pulse sequences that produce different
signals from protons with different relaxation times (T^- and 7^- weighted sequences) are
needed. Secondly, spatial information is necessary.
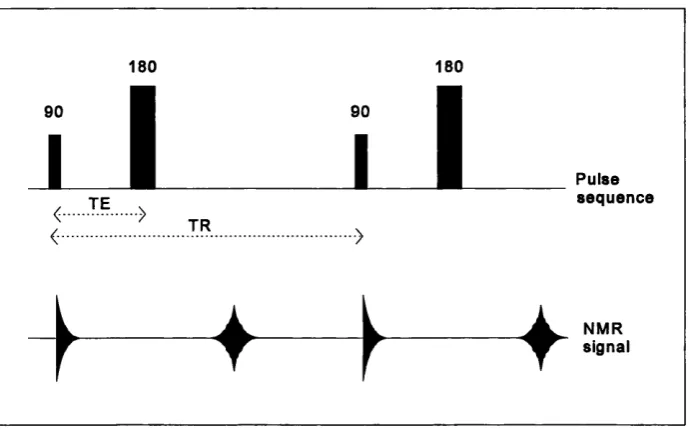
Tj and T2 weighting: Spin echo
The most commonly used pulse sequence is spin echo, which can be used to produce
images with or 7^ weighting^ This is illustrated in figure 2.4. First a 90° pulse tips the
protons into the xy plane. As discussed above, the transverse magnetisation (which is the
magnetisation that is detected as RF signal by the receiver coils) is rapidly lost, in part due
to T2 decay, but mainly due to slight inhomogeneities in Bq (7^* decay). Where the field is
slightly stronger the protons precess faster, where it is weaker they precess slower and lag
behind. After a delay (the echo time, TE) the protons are all tipped through 180° by a
second RF pulse. This has the effect of reversing the relative positions of the slower and
faster precessing protons; the slower ones that were lagging behind are now ahead of the
faster ones which, as they are still precessing faste^catch up again. This results in a return
of all the transverse magnetisation that was lost through 7^* effects in the form of an
"echo" (figure 2.5). The amplitude of the echo therefore depends solely on 7^ relaxation.
If an image with T2 weighting is desired, a long TE is used. This allows protons with a
short T2 to dephase whereas those with a longer 7^ do not. On the resulting image tissues
with short T2 therefore appear dark, those with long 7^ bright.
Pulse sequence
♦
Figure 2.4. The spin echo pulse sequence.
lo ss of coh eren ce
180
"Echo"
Bq weaker Spinning slower Bo stronger
Spinning faster
In order to generate an image the pulse sequence needs to be repeated many times. The
time between successive 90° pulses is known as the repetition time (TR). If the pulse
sequence is repeated rapidly (ie with short TR) those protons with long will not have had
time to return fully to their equilibrium alignments along Bq. Therefore, next time they are
excited they will give less signal. Such a sequence is thus T^-weighted, with those tissues
with longest appearing dark (less signal). If a long TR is used in conjunction with a short
TE, there is little weighting from either or T2 and the image is therefore proton density
weighted. Note that as the and 7^ of tissues tend to vary together, a spin echo with short
TR and long TE gives an image in which there is little signal from anything. This is
summarised in table 2.2.
Short TJT2 Long
TR TE tissues appear: tissues appear: Weighting
Short Short Bright Dark r ,
Long Long Dark Bright T2
Long Short Bright Bright Proton density
Short Long Dark Dark
-Table 2.2. T^, T2 and proton density weighting according to repetition time (TR)
and echo time (TE).
Spatial localisation
Spatial information in the MR image is encoded using magnetic gradients applied for brief
periods during the pulse sequence to cause small linear variations in the magnetic field.
These gradients are known as the slice selection, frequency encoding and phase encoding
axes respectively, although in practice they can be applied along any three orthogonal axes.
Slice selection
For the purposes of data acquisition the object to be imaged can be considered to be made
up of small cubes called volume elements or voxels (figure 2.6). Initially all the voxels
experience the same magnetic field (Bq) and consequently would all be excited by RF
pulses at the same Larmor frequency, cOq. Applying an additional magnetic gradient along
the z axis causes the voxels in different xy slices to experience slightly different magnetic
fields' (figure 2.6). An RF pulse sequence of a particular wave length will then only cause
the protons in a single slice to resonate. This gradient, which is applied during excitation
only, is known as the slice selection gradient.
+ 5B,
- 5Bi
M ag n etic field g rad ien t
Bo + 6Bo
Bo
Bo - 5Bo
B,
i
RF
U),
Figure 2.6. Slice selection.
' Compared to the static magnetic field the applied gradients are weak, with gradient strengths of the order of 10 mT/metre. For example, this means that if Bq were 1 T, an
additional gradient might result in a net field strength of 0.999 T in one place whilst 20 cm away the field was 1.001 T.
-Frequency and phase encoding
Once the slice selection gradient is switched off, all the protons within the chosen slice will
precess at the same frequency and produce an echo, which is the signal detected by the
receiver coils. The purpose of frequency and phase encoding gradients is to modify the
echoes such that those from protons within different voxels can be distinguished. The
frequency encoding gradient is applied during the echo. In the example it is applied along
the X axis. This means that the frequency of the echoes varies along the x axis. The
resultant net signal is therefore a composite of many signals of different frequencies, each
frequency corresponding to a position along the x-axis. The relative proportions of these
different frequencies (and hence the relative contribution to the overall signal of protons
from each x-coordinate) is calculated by the process of Fourier transformation (figure 2.7),
which essentially converts signal/time data into signal/frequency data.
Signal Signal
Fourier
transformation
Time Frequency
To encode spatial information in the third (y) direction a gradient is applied along the y
direction, before the echo. Whilst the phase encoding gradient is on, the protons will
precess at different frequencies. Once it is switched off, they will once again precess at the
same frequency but out of phase, as those protons experiencing the stronger magnetic field
whilst the gradient was on will have precessed "further" (through a greater phase angle).
The stronger the phase encoding gradient, the greater the difference in phase angle along
the y axis. Applying a whole series of different phase encoding gradients, one per
excitation, yields frequency versus time information in the y direction that is essentially
identical to that obtained by the frequency encoding gradient in the x direction. Hence it
can be Fourier transformed to yield spatial information.
k-space
In practice, the MRI scanner's computer digitises the information from all the NMR
signals, sampling at 2" (usually 64, 128, 256, or 512 depending on desired image
resolution) points. The information from each successive phase encoding step are stored
one on top of another in a matrix, known as k-space (figure 2.8). Two-dimensional Fourier
transformation of k-space yields the image (figure 2.9). The greater the number of points
sampled, the greater the resolution in the image. However, as (in conventional imaging)
each line of information in the phase encoding direction requires a separate repetition of
"k-space"
Digitisation
o o o o o o o o o o o o o o o o o o o o o o o o o o o o o o o o o o o o o o o o o o o o o o o o o o o o o o o o o o o o o o o o o o o o o o o o o o o o o o o o o o o o o o o o o o o o o o o o o o o o
o o o o o # # e # # # # # # # o o o o o Phase
o o o o o o o o o o o o o o o o o o o o o o o o o o o o o o o o o o o o o o o o o o o o o o o o o o o o o o o o o o o o
o o o o o o o o o o o o o o o o o o o o •
Frequency
180 182 185 184 178 179 176 173 180 188
Figure 2.8. k-space. 2-D Fourier transformation of k-space produces the image.
i f ifi
Rectangular field of view
On some occasions time can be saved by acquiring less lines of data in the phase than in
the frequency encoding direction. For instance, a 256x512 matrix is sometimes acquired
in spinal imaging. It follows that, if resolution is to be kept the same in the two directions,
the image will be asymmetric and is referred to as having a rectangular field of view
(FOV).
CONTRAST, RESOLUTION AND NOISE
The ability to differentiate tissues within an MR image is dependent on a variety of
parameters, especially contrast, resolution and signal-to-noise ratio.
Contrast
Contrast is simply the difference in signal intensity between two objects. As discussed
above, the main determinants of contrast in most MR images are some combination of
T2 and proton density. Pulse sequences are designed to highlight tissue differences in these
parameters. For example, on a 7^-weighted image MS lesions, which have a long 7^, appear
brighter than the surrounding white matter, which has a shorter 7^.
Resolution
Where two tissues are adjacent to one another, there will be voxels at the boundary that
contain some of each tissue. Such voxels (known as partial volume voxels) will have a
signal intensity that is intermediate between that of the two tissues, with resulting blurring
of the image. This blurring is limited by using higher resolution, or in other words more
a resolution of 256x256 voxels covering a FOV 24 cm. Each voxel is therefore under 1
mm^ in cross-section.
Signal-to-noise ratio
Any electrical signal, such as that induced in the NMR experiment, contains random
background noise. The greater the noise relative to the signal the less clear the image
becomes. This is expressed mathematically as the signal-to-noise ratio (SNR).
SNR=-- ^-noise
Whereas signal can readily be measured, the only way of measuring noise directly,
assuming the patient could keep absolutely still, would be to carry out the same scan twice
and subtract the image. Genuine signal would then be cancelled out and all that would be
left is noise. In practice noise can be estimated from the mean air signal value, which in a
conventional magnitude reconstructed image is proportional to the noise: the air mean is
1.2o and its standard deviation 0.6a, where a is the noise in a high SNR region
(Henkelman, 1985).
Contrast-to-noise ratio
In terms of resolving one tissue from another the important determinant is the ratio of the
difference in signal intensity between them and the background noise, the contrast-to-noise
ratio (CNR).
signal. -signaL CNR=— — !— -— i
SNR and CNR can be increased by signal averaging, that is acquiring the whole data set
more than once and averaging the result. SNR is proportional to the square root of the
number of signal averages. Doubling the number of signal averages therefore increases
SNR by a factor of \/2.
A key factor that limits the quality of MR images is imaging time. Doubling the matrix size
to improve resolution and doubling the number of signal averages to improve SNR and
CNR quadruples the scan time. Clearly, the longer the subject has to remain in the scanner,
the greater is the chance that the images will be marred by motion artefact. Recent
technical advances have improved image quality in terms of increased contrast, higher
resolution and improved signal-to-noise within shorter time frames. These are described
Chapter 3: Technical advances
COIL DESIGN
As discussed in chapter 2, NMR pulses are oscillating magnetic fields. These are generated
by passing a current through a loop (or loops) of conducting material. Such loops are
known as RF coils. The signals given out during the NMR experiment are also magnetic
fields, which induce currents in RF coils in the process of data collection. The coils that
produce and detect the RF waves are known as "transmit" and "receive" coils respectively.
It is possible to use the same coil both to transmit and receive. However, the requirements
for transmit and receive coils can be different. Transmit coils are in many cases required
to transmit RF pulses in a uniform fashion throughout a large volume of tissue. Where such
"volume" coils, which surround the body (or part of the body) being imaged, are used as
receive coils they permit signal reception from a large field of view (FOV). On occasions
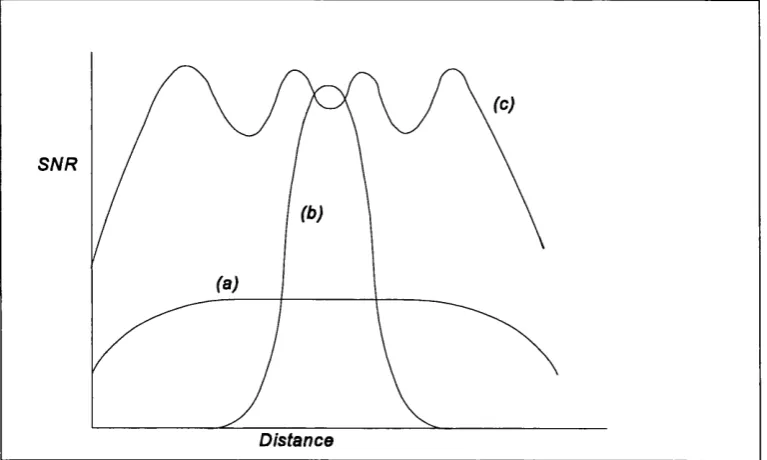
where it is desirable to concentrate only on a small FOV, higher SNR can be achieved by
using a surface coil (Schenck et a l, 1985). This consists of a single circular loop placed
over the part being imaged. However, surface coils have the disadvantage of only covering
a FOV and depth approximately equal to their radius. Increasing the radius of the coil
therefore increases the coverage, but it also unfortunately decreases the SNR (figure 3.1
a,b).
Multi-array coils
The compromise of SNR versus FOV is particularly well illustrated by the problem of
spinal cord imaging. Early attempts to image the spinal cord used volume receive coils
spinal cord's small diameter and its surrounding of bone. Low SNR mitigated against the
use of large matrices and hence high resolution. This made it difficult to resolve small
intrinsic lesions such as those found in MS. Furthermore, low resolution images are prone
to truncation artefacts, caused by undersampling. On sagittal images of the spine these can
result in linear artefacts running down the centre of the cord (Breger et aL, 1988;
Czervionke et a l, 1988), the appearances of which could be confused with lesions.
Later studies of the spinal cord used small surface coils to improve SNR (Masaryk et a l,
1986; Nilsson et al, 1987; Sze et a l, 1988; Honig and Sheremata, 1989). However, such
coils typically have a FOV of at most 30 cm, necessitating separate scans of the cervical,
thoracic and lumbosacral regions in two or even three separate examinations if the whole
cord is to be covered. This is time consuming, poorly tolerated and carries the danger that
relevant pathology may be missed if the wrong level is imaged.
S N R
Distance
The development of multi-array coils by Roemer et al (1990) has greatly improved spinal
cord imaging. The array consists of a series of individual surface coils, each with its own
data acquisition hardware, linked together electronically to provide a composite image.
Thus they combine the high SNR of a small surface coil with the greater coverage of a
much larger coil (figure 3.1c).
Current work
The spinal imaging in this thesis was carried out using a General Electric prototype spinal
multi-array of six partly overlapping coils. The most rostral two coils are saddle-shaped
and cover the upper cervical cord. The remaining four coils are flat and rectangular (14x11
cm) and extend from the mid-cervical to the sacral region. Data can be collected
simultaneously from any four adjacent coils and integrated to form a single sagittal or
coronal image. The four most rostral coils cover a FOV of 48 cm which encompasses the
entire spinal cord in all but a few very tall individuals (figure 3.2). Thus the whole spinal
cord can be imaged with high SNR in a single acquisition.
Uniformity correction
One feature of the way the multi-array coils are designed is that they do not have uniform
sensitivity throughout the entire FOV. For instance, with the spinal multi-array signal is
higher nearer the centre of the individual coils than at the edges, giving the images a
"striped" appearance (figure 3.2a). This can at times impede the detection of focal intrinsic
cord lesions. A uniformity correction algorithm has therefore been developed (Tofts et a l,
1994). This relies on imaging a uniform phantom using the same pulse sequences and then
resultant images have a much more uniform appearance (figure 3.2b). This post-processing
algorithm was applied in all cases to the spinal images reported in this thesis.
Figure 3.2. 7’2-weighted FSE image of the whole cord in patient with laboratory supported definite MS. Before uniformity connection (a) there is signal variation along the cord such that the craniocervical junction and midthoracic regions are very bright. After correction (b), the image is much more uniform.
PULSE SEQUENCES
Both r, and 7^ are longer in MS lesions than surrounding white matter (Wehrli et al, 1985;
Lacomis et a l, 1986; Ormerod et ai, 1987; Larsson et ai, 1988; Armspach et a l, 1991;
Barnes et a l, 1991). Sequences with either or Tj weighting can therefore be used to
-detect plaques. Early studies used Ji-weighted sequences (Young et a l, 1981).
Subsequently the spin echo pulse sequence with mild, moderate or heavy 7^-weighting was
found to be more sensitive and became the standard (Brandt-Zawadzki et a l, 1983; Lukes
et a l, 1983).
More recently attempts have been made in two main areas to improve the detection of MS
lesions: (i) reducing imaging time and (ii) improving tissue contrast. Pulse sequences have
also been developed which allow more quantitative measurement of the NMR
characteristics of normal and pathological tissues.
Reduction o f imaging time
The spin echo (SB) pulse sequence, especially with proton density or 7^ weighting is time
consuming. A typical sequence, SB2ooo/32,8o (TR 2000 ms, TBs 32 and 80 ms), 192x256 matrix, 1 excitation, takes nearly 13 minutes to image the brain in 4 mm contiguous
interleaved axial slices. The problem is even more acute in the spinal cord, where larger
(512x512) matrices are required, with scans taking up to 30 minutes.
Gradient echo
For a SB pulse sequence, the total scan time is given by:
Scan time = T R \ [No. phase encoding steps] x [No. averages] x [No. acquisitions]
It therefore follows that a reduction in the repetition time (TR) would result in a reduced
scan time. As discussed in chapter 2, a long TR is required to allow longitudinal relaxation
provides a means of using a much shorter TR. Whereas in the SE sequence the protons are
initially flipped through 90°, in the GE sequence much smaller flip angles can be used. As
there is therefore less longitudinal relaxation, less time is required for the return to
equilibrium, and much shorter TRs (of the order of tens to hundreds of milliseconds) can
be used. The other difference between SE and GE is that whereas in the former a 180°
pulse (which is relatively time consuming) is used to generate an echo, in the latter the
polarity of the frequency encoding (read) gradient is rapidly switched. This also has the
effect of generating an echo. However, unlike a spin echo, if will not refocus spins that
have dephased as a result of inhomogeneities in the static magnetic field (see page 33). GE
images are therefore T2*-weighted rather than T2-weighted. They tend to be of low SNR (because of the low flip angles) and have proved poor at detecting intrinsic cord lesions,
at least in sagittal plane (see chapter 6). Advantage can be taken of the intrinsic
susceptibility of the GE pulse sequence to magnetic field inhomogeneity in, for instance,
the imaging of changes in blood flow (Edelman et al, 1990; Belliveau et a l, 1991 ; Zigun
et al, 1993) or blood oxygenation, the basis of much recent work on functional magnetic
resonance imaging (Kwong et al, 1992; Ogawa et a l, 1992). As described in chapter 11,
the technique can thus be applied to the imaging of abnormal blood flow through
arteriovenous malformations of the spinal cord.
Fast spin echo
Fast spin echo (FSE), based on the Rapid Acquisition with Relaxation Enhancement
(RARE) pulse sequence (Hennig e ta l, 1986), consists of a single 90° pulse followed by
a train of 180° pulses (usually 4, 8 or 16), such that a series of echoes is generated.
single k-space line in the phase encoding direction being acquired with each repetition of
the pulse sequence (see page 38), up to 16 or more are filled (Hennig et a l, 1986; Hennig
and Friedberg, 1988; Mulkem et a l, 1990). Thus scan time is given by:
TRX INo. phase encoding steps!x [No. averages 1x [No. acquisitions! ETL
where ETL, the echo train length, is the number of echoes in the echo train. Thus, with an
ETL of 16, with all other parameters the same, FSE would be 16 times faster than SE. In
practice the time saving, although substantial, is not as great as this, mainly due to the way
multiple image slices are acquired simultaneously (multislice imaging). Furthermore, if a
dual echo data set is to be acquired then half the echo train is used for each echo.
Therefore, whereas there is no time penalty associated with acquiring a dual echo data set
when using SE, with FSE it doubles the acquisition time.
It can be appreciated that the resultant FSE image is made up of a series of phase encoding
lines with different echo times. Although this does result in a certain amount of "blurring"
of the image, the effect is not marked, as all parts of k-space do not contribute equally to
appearance of the image. The centre part of k-space contributes most to contrast, which is
T2 dependent, whereas the outer portions contribute most to the appearance of edges in the
image, which is relatively 7^ independent (figure 3.3). Thus the "effective echo time" (TE^f)
is defined as the TE of the phase encoding lines passing through the centre of k-space. The
similarities and differences between FSE and SE have been reviewed in detail elsewhere
(Melki et al, 1991, 1992; Constable et a l, 1992a). An evaluation of FSE in the detection
of MS lesions is described in chapter 4.
Figure 3.3. The outer lines of k-space contain information about edges (left), the central lines contrast (right).
Lesion contrast
Although SE images reliably demonstrate MS plaques, there is still a need for more
sensitive techniques. This is particularly the case in the context of treatment trials, where
accurate assessment of the extent of disease burden is important. Methods which attempt
to improve lesion contrast have therefore been developed including the use of synergistic
7, and 7^ contrast (STIR and Fast STIR) and increased 7^ contrast with nulling unwanted
signal from cerebrospinal fluid (FLAIR and fast FLAIR).
STIR and Fast STIR
Spin echo images are insensitive to 7, contrast at long TR and have negative 7^ contrast
as TR is reduced; thus the and Tj properties of tissues tend to act against each other to
reduce overall contrast. The Short Tau Inversion Recovery (STIR) pulse sequence
combines 7, and 7j contrast (Bydder and Young, 1985; Bydder et a l, 1985a,b). The
sequence consists of an inversion (180°) pulse followed by a short delay (the inversion
-time, TI) and then, usually, a 90/180 combination as in a conventional spin echo. The
inversion pulse and short TI in the STIR sequence result in less longitudinal magnetisation
from tissues with short (such as white matter) being present prior to the 90/180 than
from tissues with longer (such as lesions) (figure 3.4). If a spin echo with moderately
long TE is then used, T2-weighting is added.
90 90
Short T Long T
Figure 3.4. STIR: The effects of the inversion pulse.
STIR has been shown to be useful in the investigation of brain (Bydder and Young, 1985)
and spinal lesions (Mascalchi et a l, 1993). It produces excellent fat suppression anc^until
recently superseded (Miller et a l, 1993a; Gass et a l, 1995^ has been the sequence of
choice for imaging of the optic nerves (Johnson et a l, 1987; Miller et a l, 1988b).
However, STIR has lower SNR than SB. As it is also as time-consuming as SB, SNR
cannot reasonably be increased by signal averaging. The short tau inversion recovery FSB
(fast STIR) pulse sequence is produced by preceding a FSB sequence by an inversion pulse.