International Journal of Humanities and Social Sciences p-ISSN: 1694-2620 e-ISSN: 1694-2639 Vol. 8, No. 2, pp. 48-59, ©IJHSS
Application of MODIS Satellite Data in Modeling Total Suspended
Solids in Lake Lanao, Philippines
Rakimah Datu Macabalang1,*, and Xin Qian1
1State Key Laboratory of Pollution Control and Resource Reuse, School of the Environment,
Nanjing University, Nanjing 210046, PR China *[email protected]
Abstract
Remote sensing technique is commonly used in monitoring different water quality parameters. Moderate- Resolution Imaging Spectroradiometer (MODIS) is one of the remote sensing techniques. MODIS satellite imagery nowadays was widely used by different researchers to carry out monitoring freshwater ecosystem. This study conducted in Lake Lanao, Philippines uses the application of MODIS with the effort in deriving Total Suspended Solids (TSS) concentrations from MODIS Terra Surface Reflectance 8-Day L3 Global 500m. TSS in-situ measurement together with the corresponding MODIS reflectance measurements over the Lake in different sampling periods were compared to observe significant correlation using a linear regression analysis. Regression shows that the best correlation coefficients were found during first and second sampling periods with 8 4(MODIS Band 1), (MODIS Band 4 +MODIS Band 1); and (MODIS Band 4+MODIS Band 1)/ (MODIS Band 4 /MODIS Band 1). Root Mean Square Errors (RMSE) were also used 7to 5 examine the accuracy of each algorithm developed. The root mean square (RMSE) of the TSS algorithm developed (Eq. (6), (10) and (14)) from MODIS and in-situ measurement resulted in a good correlation with a RMSE values of 1.546 mg/l, 1.553 mg/l and 1.546 mg/l, respectively. This 1 implies the potential of MODIS data to model water quality parameter like suspended solids particularly in Lake Lanao, Philippines. Moreover, it is the first study conducted to model suspended solids using remote sensing (MODIS) in the said area; and it may help those environmental managers in shaping policy decisions in protecting and saving Lake Lanao.
Keywords: Remote Sensing, Water Quality, Correlation, Regression, Reflectance
Introduction
Li, (2006) had carried out lake water monitoring based on a remotely sensed data. They studied Qinghai lake water area variation characteristics through the use of remote sensing technology. Huang et al., (2012) also investigated surface water variations monitoring and flood hazard analysis in Dongting Lake area using long-term Terra/MODIS data time series; and Min et al., (2009) used the application of MODIS satellite data in monitoring quality parameters of Chaohu Lake. The U. S. National Aeronautics and Space Administration (NASA) also used MODIS during the launched into Earth orbit a Scientific Instrument through the Moderate Resolution Imaging. On board with the instrument are Terra (EOS AM) and 2Aqua 3(EOS PM) satellites. These instruments captured data in 36 spectral bands ranging in wavelength from 0.4 µm to 14.4 µm and at varying spatial resolutions (2 bands at 250 m, 5 bands at 500 2 m and 29 bands at 1 km). The instruments image the entire Earth every 1 to 2 days. This is designed to provide measurements in large-scale global dynamics including changes in Earth's cloud cover, radiation budget and processes occurring in the oceans, on land, and in the lower atmosphere (http ://modis. gsfc.nasa.gov/about 66/).
MODIS Terra and Aqua began generating data in 2000 and 2002, respectively. This means that MODIS data could give possible answers left behind on the question on the real status of Lake Lanao in terms of Total Suspended Solids For lake managers managing water quality for 3large lakes like Lake Lanao, it is a necessity and with precise understanding on the existing condition and trend of the lake water quality. However, development of reliable and cost-effective monitoring techniques, with appropriate spatial and temporal resolution still remains as a challenge. In order to have a clear understanding on the Total Suspended Solids in Lake Lanao, MODIS (MOD09A1) was used to know the impacts of Total Suspended Solid in the lake in four different sampling periods, respectively. Thus, this study examined the effectiveness of MODIS data in measuring water quality in Lake Lanao, Marawi City, Philippines the in-situ concentration of Total Suspended Solids obtained in four different sampling periods in Lake Lanao, Philippines.
For lake managers managing water quality for large lakes like Lake Lanao, there is a need and with precise understanding with the trend and the existing conditions on the quality of our lake water system; nevertheless, an enormous challenge remains in the development to have reliable and yet cost-effective monitoring techniques that will help managers to make suitable plans in protecting and conserving lake waters. In order to have a clear understanding on the Total Suspended Solids in Lake Lanao, MODIS (MOD09A1) was used to know the impacts of Total Suspended Solid in the lake in four different sampling periods, respectively. This study investigate how effective is MODIS data in measuring lake water quality using the in-situ concentration of Total Suspended Solids obtained in four different sampling periods in Lake Lanao, Philippines.
Materials and Methods
Description of the Study Area
Taraka River, Ramain River, Gata River and the Masiu River.
Field Data
The collections of samples gathered in this study were restricted in Marawi City and the lakeshores of the municipalities around Lake Lanao. Figure 1 shows the specific location of the municipalities were the samples are collected. During the collection of the samples, the sampling stations and its coordinates were identified and recorded using Global Positioning System (GPS) and were plotted in Geographic Information System Maps (GIS Maps). Lake water sampling was done in 4 different periods. Water samples were collected in 24 sampling sites along Lake Lanao during the month of June and October of 2011; March and May of 2012, respectively.
Every sampling stations, 3 water samples were collected as replicate to have an accurate results in each parameter tested. A Water Quality Checker (Horiba 50) was used to test the parameter Total Suspended Solids in-situ. This Horiba 50 water quality checker was submerged 5 meter depth from the lake surface. Horiba 50 water quality checker was then pulled up after 3 minutes and results will be recorded. Table 1 in the appendix represents the in situ measurements of Total Suspended Solids during the (4) sampling periods.
MODIS Data
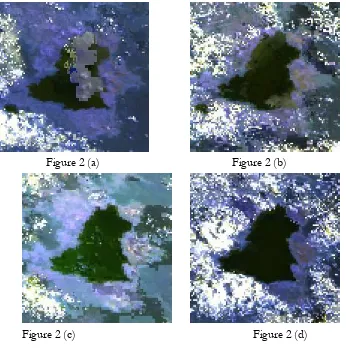
MODIS MOD09A1 8-day surface reflectance images from NASA’s Terra satellite were taken at an internet server of Land Processes Distributed Active Archive Center (LP DAAC) of the US Geological Survey (USGS) and National Aeronautics and Space Administration (NASA) through Earth Explorer. Images of MOD09A1 were selected to be used because it is the only MODIS product that matched the dates of the in situ measurement for the parameter Total Suspended Solids. Figure 2 in the appendix shows the MODIS Images derived for the days corresponding to in-situ measurements.
MODIS Data Processing and Algorithm Development
The MODIS data after downloading from Internet server of LP DAAC, reflectance bands in corresponding to the in-situ measurement of Total Suspended Solids were obtained through pixel locator and cursor value tool in ENVI 4.7. Different reflectance bands (Band 1), (Band 4+ Band 1) and (Band 4+Band 1/ (Band 4/Band 1)) obtained in the said MODIS downloaded data were used to develop Algorithm to observe significant correlations between satellite and in-situ data. To test its accuracy (Eq. 2, 3 and 4), the correlation coefficient, Root Mean Square Errors (RMSE) (Eq.1) were evaluated in each model. (Wong, et al., 2008, Milton and Arnold, 1995, and Guzman and Santaella, 2009).
(Eq. 1)
(Eq. 2)
(MODISk+MODISi) (Eq.4)
(MODISk/MODISi)
Where, A0, Ai are constant of regression models. MODISi and MODISk is the band reflectance values, xi is original data, µi is modeled data.
Result and Discussion
Reflectance Band values and the in-situ measurement of Total Suspended Solids gathered during the different sampling periods were depicted in Table 1 in the appendix. The Total Suspended Solids in- situ measurement during the 4 different sampling periods yield a result ranges from 1-20 mg/L, with a mean of 4.37mg/L, 2.46mg/L, 4.08mg/L and 2.63mg/L for the first sampling, second sampling, third sampling and fourth sampling, respectively, A Positive correlations were found between the red, green and the combination of the said bands with the in situ measurements of Total Suspended Solids during the 4 sampling period.
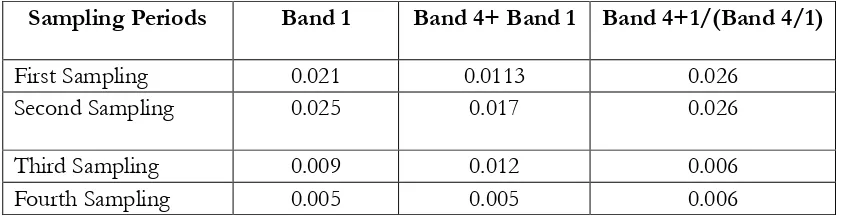
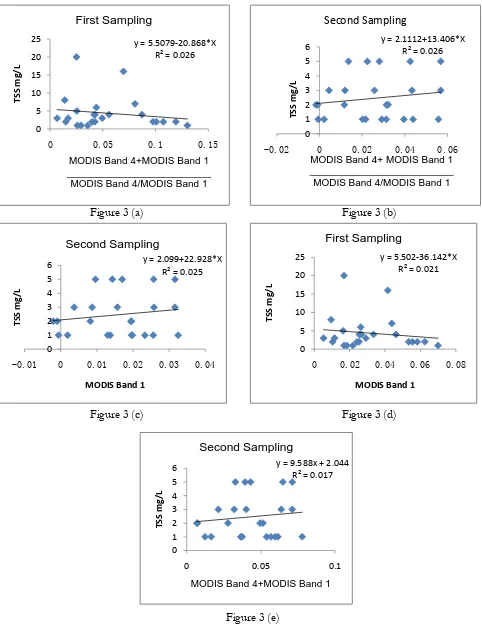
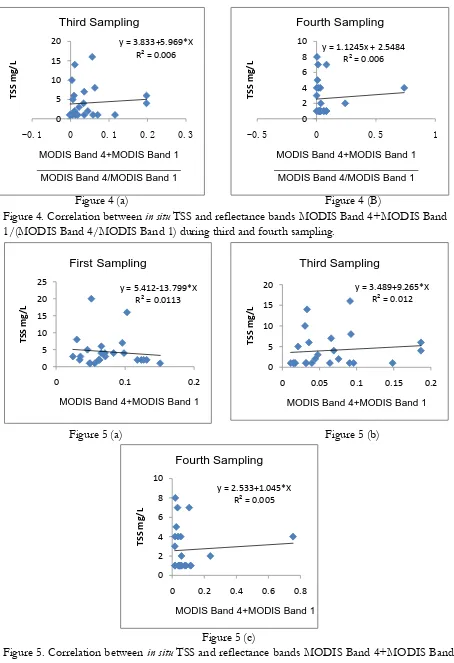
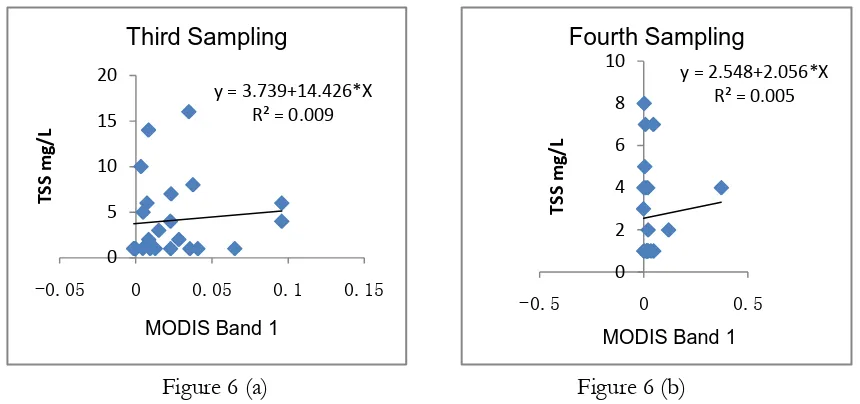
Within the 4 sampling periods, (Band 4+Band 1/ (Band 4/Band 1)) performed with higher correlation with TSS (R2=0.026) during the first and second sampling (Figure 3(a) and (b) in the appendix) followed by MODIS Band 1 with a correlation coefficient of R2=0.025 and R2=0.021 during the second sampling and first sampling (Figure 3(c) and (d), in the appendix) then MODIS Band 4+MODIS Band 1 with a correlation coefficient of (R2=0.017) during second sampling, (Figure 3(e) in the appendix). Using linear regression (Table 2 in the appendix) showed that (R2=0.006) was obtained in third and fourth sampling for the Band 4+1/Band 4/1 (Figure 4 (a) and (b) in the appendix). A correlation coefficients of (R2=0.0113, R2=0.012 and R2=0.005) were obtained during the first, third and fourth sampling periods for the combination of bands, MODIS Band 4+MODIS Band 1 (Figure 5 (a),(b) and (c) in the appendix), respectively. MODIS Band 1 (Figure 6 (a) and (b) in the appendix) resulted in a correlation coefficient (R2=0.009 and R2=0.005) in third and fourth sampling periods and considerably lower among others. This suggests that a combination of bands is representative ability of higher correlation coefficient than a single band given that its correlation coefficient is higher compare with a single band.
Based on the analyses made, the following algorithms were implemented and tested: (5) TSS1=5.502-36.142*(MODIS Band 1)
(6) TSS2=2.099+22.928 *(MODIS Band 1) (7) TSS3=3.739+14.426* (MODIS Band 1) (8) TSS4=2.548+2.056 *(MODIS Band 1)
(13) TSS1=5.508-20.868*(MODIS Band 4+ MODIS Band 1) (MODIS Band 4/MODIS Band 1) (14) TSS2=2.111+13.406*(MODIS Band 4+ MODIS Band 1)
(MODIS Band 4/MODIS Band 1)
(15) TSS3=3.833+5.969*(MODIS Band 4+ MODIS Band 1) (MODIS Band 4/MODIS Band 1)
(16) TSS4= 2.548+1.124*(MODIS Band 4+ MODIS Band 1) (MODIS Band 4/MODIS Band 1)
Validating RMSE the equations (5), (6), (7), (8), (9), (10), (11), (12), (13), (14), (15) and (16) were evaluated. Table 3(appendix) shows the RMSE values of each equation. The RMSE resulted ranges from 1-4.8 mg/L. The highest RMSE were recorded with Eq. (5), (7), (9), (11), (13) and (15) with a RMSE values of 4.688 mg/L, 4.360 mg/L, 4.710 mg/L, 4.353 mg/L, 4.674 mg/L and 4.366 mg/L, respectively. Eq. (8), (12) and (16) resulted in the same RMSE values of 2.287 mg/L while Eq. (6), (10) and (14) resulted in less RMSE values of 1.546 mg/L, 1.553 mg/L and 1.546 mg/L, respectively. Comparison between these validation results indicates that the equations (6), (10) and (14) were able to better estimate TSS concentration. It is noticeable that the correlation coefficient observed was less in value. Possible errors for this less correlation coefficient in this study may be caused by the following reasons: (1). MODIS data gives an average (weekly) reflectance value while water samples from fixed points gives a daily result values, (2). A reflectance value is influenced by adjusted pixels; and (3). Less number of water samples.
Conclusion
References
Feng Zhongkui, & Li Xiaohui. (2006). Remote Sensing Monitoring Study for Water Area Change and Lakeshore Evolution of Qinghai Lake in last 20 years (J). Journa; of Paleogeography 8(1):131-141.
Guzman V.R., & Santaella F.G. (2009). Using MODIS 250M Imagery to Estimate Total Suspended Sediment in a Tropical Open Bay. International Journal of Systems
Huang S., Li J., & Mei X. (2012). Water Surface Variation Monitoring and Flood Hazard Analysis in Dongting Lake Area using Long-term Terra/MODIS Data Time Series. Nat Hazards (2012) 62:93-100. DOI 10.1007/s11069-011-9921-6.
Milton J.S., & Arnold J.C. (1995). Introduction to Probability and Statistics: Principles and Applications for Engineering and Computing Sciences. McGraw- Hill Publishing Company, Singapore, pp. 811.
Naga, P.O. (2010). Lake Lanao: An Ancient Lake in Distress. (Cited October 2012) Available from http://wldb.ilec.or.jp/data/ilec/WLC13_Papers/S17/s17-14.pdf
Appendix
A. Acknowledgement
The authors wish to acknowledge NASA, and LP DAAC of the USGS for providing the MODIS images; the Department of Environment and Natural Resources-Environmental Management Bureau, Region 10 (DENR-EMD, 10) for providing the in-situ data.
B. LIST OF TABLES
Table1. In situ measurement of Total Suspended Solids and MODIS Bands Reflectance Values
Stations Name
1st 2nd 3rd 4th MODIS Band
1
MODIS Band 4+ MODIS
Band 1
MODIS Band 4+MODIS Band 1/(MODIS Band 4/MODIS Band 1)
Marawi City 4 5 6 4 0.3729 0.7539 0.737872205
Marantao 4 3 14 1 0.013 0.0432 0.018596026
Wato Balindong 20 5 6 1 0.0014 0.0163 0.001531544
Tugaya 3 1 8 7 0.0464 0.1056 0.082767568
Bacolod 2 5 10 1 0.0177 0.0473 0.028284122
Madalum 2 1 16 1 0.0155 0.0467 0.023200321
Madamba 4 1 7 2 0.0217 0.0576 0.034816713
Ganassi 5 3 2 1 0.0473 0.115 0.08034712
Binidayan 3 3 4 4 0.0196 0.0524 0.031312195
Bayang 3 1 1 7 0.0087 0.0327 0.01185375
Lumbatan 1 1 1 1 0.0477 0.1137 0.082174091
Lumbayanague 8 2 1 4 0.0112 0.0361 0.016237751
Masiu 7 3 1 1 0.0142 0.0393 0.022233466
Masiu 4km 2 2 1 8 0.0025 0.0191 0.002876506
Poona Bayabao 2 1 3 5 0.0051 0.025 0.006407035
Tamparan 1 1 5 1 0.0337 0.0778 0.059452608
Taraka 1 1 1 1 0.0359 0.0854 0.061936566
Mulundo 4 2 1 1 0.0207 0.056 0.032838527
Buadi Puso Bentong
6 5 1 1
0.014 0.0406 0.021368421
Ramain 15 5 2 1 0.0218 0.0576 0.03507486
Poona Bayabao
4km
2 2 1 4
0.0014 0.0167 0.001528105
Taraka 4km 2 1 1 1 0.0022 0.0182 0.0025025
Ramain 4km 1 2 1 3 -0.0004 0.0161 -0.000390303
Agus 1 Intake 2 3 4 2 0.1195 0.2374 0.240621713
Sum 105 59 98 63 0.8937 2.1097 1.635443408
Table2. Correlation coefficient using linear regression with different bands and TSS values. Sampling Periods Band 1 Band 4+ Band 1 Band 4+1/(Band 4/1)
First Sampling 0.021 0.0113 0.026
Second Sampling 0.025 0.017 0.026
Third Sampling 0.009 0.012 0.006
Fourth Sampling 0.005 0.005 0.006
Table3. RMSE and R squared assessment of TSS models
Equations R Squared RMSE
Eq. 5 0.021 4.688
Eq. 6 0.025 1.546
Eq.7 0.009 4.360
Eq.8 0.005 2.287
Eq.9 0.011 4.710
Eq. 10 0.017 1.553
Eq. 11 0.012 4.353
Eq. 12 0.005 2.287
Eq. 13 0.026 4.674
Eq. 14 0.026 1.546
Eq. 15 0.006 4.366
Eq. 16 0.006 2.286
[image:8.595.88.511.87.195.2]C. LIST OF FIGURES
Figure 2 (a) Figure 2 (b)
Figure 2 (c) Figure 2 (d)
[image:9.595.92.438.73.422.2]y = 2.1112+13.406*X R² = 0.026
0 1 2 3 4 5 6
-0.02 0 0.02 0.04 0.06
TS
S m
g/
L
MODIS Band 4+ MODIS Band 1 __________________________ MODIS Band 4/MODIS Band 1
Second Sampling
y = 9.588x + 2.044 R² = 0.017
0 1 2 3 4 5 6
0 0.05 0.1
TS
S m
g/
L
MODIS Band 4+MODIS Band 1
Second Sampling y = 2.099+22.928*X
R² = 0.025
0 1 2 3 4 5 6
-0.01 0 0.01 0.02 0.03 0.04
TS
S m
g/
L
MODIS Band 1
Second Sampling
y = 5.502-36.142*X R² = 0.021
0 5 10 15 20 25
0 0.02 0.04 0.06 0.08
TS
S m
g/
L
MODIS Band 1
First Sampling
Figure 3 (a) Figure 3 (b)
Figure 3 (c) Figure 3 (d)
Figure 3 (e)
Figure 3. Correlation between in situ TSS and reflectance bands MODIS Band 4+MODIS Band 1/(MODIS Band 4/MODIS Band 1), MODIS Band 1 and MODIS Band 4+ MODIS Band 1 during first and second sampling session.
y = 5.5079-20.868*X R² = 0.026
0 5 10 15 20 25
0 0.05 0.1 0.15
TS
S m
g/
L
MODIS Band 4+MODIS Band 1 __________________________
MODIS Band 4/MODIS Band 1
[image:10.595.45.527.86.713.2]y = 3.833+5.969*X R² = 0.006
0 5 10 15 20
-0.1 0 0.1 0.2 0.3
TS
S m
g/
L
MODIS Band 4+MODIS Band 1 __________________________
MODIS Band 4/MODIS Band 1
Third Sampling
y = 1.1245x + 2.5484 R² = 0.006
0 2 4 6 8 10
-0.5 0 0.5 1
TS
S m
g/
L
MODIS Band 4+MODIS Band 1 __________________________
MODIS Band 4/MODIS Band 1
Fourth Sampling
y = 3.489+9.265*X R² = 0.012
0 5 10 15 20
0 0.05 0.1 0.15 0.2
TSS
m
g/
L
MODIS Band 4+MODIS Band 1
Third Sampling
y = 2.533+1.045*X R² = 0.005
0 2 4 6 8 10
0 0.2 0.4 0.6 0.8
TS
S m
g/
L
MODIS Band 4+MODIS Band 1
Fourth Sampling
Figure 4 (a) Figure 4 (B)
Figure 4. Correlation between in situ TSS and reflectance bands MODIS Band 4+MODIS Band 1/(MODIS Band 4/MODIS Band 1) during third and fourth sampling.
Figure 5 (a) Figure 5 (b)
[image:11.595.69.523.82.745.2]Figure 5 (c)
Figure 5. Correlation between in situ TSS and reflectance bands MODIS Band 4+MODIS Band 1 during first, third and fourth sampling.
y = 5.412-13.799*X R² = 0.0113
0 5 10 15 20 25
0 0.1 0.2
TS
S m
g/
L
MODIS Band 4+MODIS Band 1
[image:11.595.63.515.88.287.2]y = 3.739+14.426*X R² = 0.009
0 5 10 15 20
-0.05 0 0.05 0.1 0.15
TS
S m
g/
L
MODIS Band 1
Third Sampling
y = 2.548+2.056*X R² = 0.005
0 2 4 6 8 10
-0.5 0 0.5
TS
S m
g/
L
MODIS Band 1
Fourth Sampling
Figure 6 (a) Figure 6 (b)
[image:12.595.69.499.89.291.2]