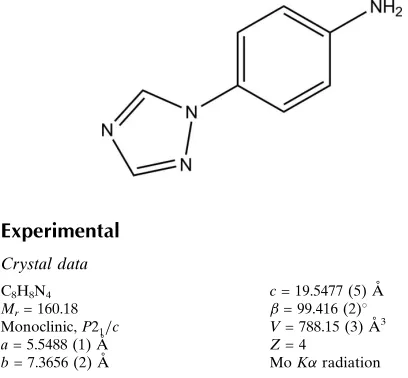
4-(1,2,4-Triazol-1-yl)aniline
Hoong-Kun Fun,a*‡ Ching Kheng Quah,a§
B. Chandrakantha,bArun M. Isloorcand Prakash Shettyd
a
X-ray Crystallography Unit, School of Physics, Universiti Sains Malaysia, 11800 USM, Penang, Malaysia,bDepartment of Chemistry, Manipal Institute of Technology, Manipal 576 104, India,cOrganic Chemistry Division, Department of Chemistry,
National Institute of Technology-Karnataka, Surathkal, Mangalore 575 025, India, anddDepartment of Printing, Manipal Institute of Technology, Manipal 576 104,
India
Correspondence e-mail: [email protected]
Received 10 December 2010; accepted 11 December 2010
Key indicators: single-crystal X-ray study;T= 296 K; mean(C–C) = 0.002 A˚; Rfactor = 0.044;wRfactor = 0.118; data-to-parameter ratio = 19.6.
In the title compound, C8H8N4, the dihedral angle between
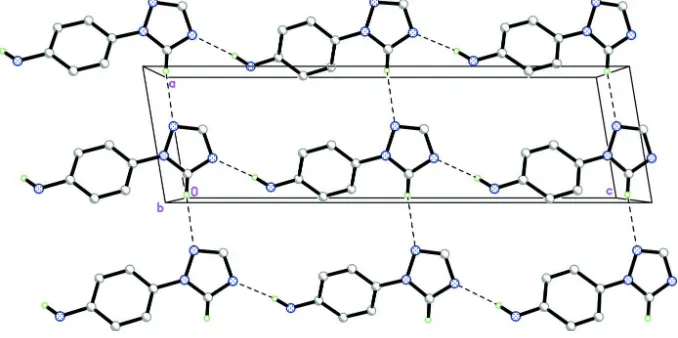
the triazole ring [maximum deviation = 0.003 (1) A˚ ] and the benzene ring is 34.57 (7). In the crystal, molecules are linked into sheets lying parallel to the ac plane via intermolecular N—H N and C—H N hydrogen bonds. Aromatic – [centroid–centroid distance = 3.6750 (8) A˚ ] stacking and N— H interactions are also observed.
Related literature
For general background to and the biological activity of tria-zole derivatives, see: Islooret al.(2000, 2009); Solimanet al.
(2001); Hollaet al.(2000); Sunilet al.(2009). For bond-length data, see: Allenet al.(1987). For a related structure, see: Funet al.(2010).
Experimental
Crystal data
C8H8N4 Mr= 160.18
Monoclinic,P21=c a= 5.5488 (1) A˚
b= 7.3656 (2) A˚
c= 19.5477 (5) A˚
= 99.416 (2) V= 788.15 (3) A˚3
Z= 4
MoKradiation
= 0.09 mm1 T= 296 K
0.500.420.14 mm
Data collection
Bruker SMART APEXII CCD diffractometer
Absorption correction: multi-scan (SADABS; Bruker, 2009)
Tmin= 0.957,Tmax= 0.988
8036 measured reflections 2160 independent reflections 1722 reflections withI> 2(I)
Rint= 0.030
Refinement
R[F2> 2(F2)] = 0.044 wR(F2) = 0.118 S= 1.05 2160 reflections 110 parameters
H atoms treated by a mixture of independent and constrained refinement
max= 0.23 e A˚3
[image:1.610.45.249.533.722.2]min=0.17 e A˚ 3
Table 1
Hydrogen-bond geometry (A˚ ,).
Cg2 is the centroid of the C3–C8 phenyl ring.
D—H A D—H H A D A D—H A
N4—H2N4 N1i
0.871 (16) 2.208 (16) 3.0709 (18) 171.1 (15) C1—H1A N2ii
0.93 2.50 3.4035 (16) 166 N4—H1N4 Cg2iii
0.87 (2) 2.58 (2) 3.3929 (16) 156.0 (17)
Symmetry codes: (i)x;yþ1 2;z
1
2; (ii)x1;y;z; (iii)x;yþ 1 2;zþ
3 2.
Data collection:APEX2(Bruker, 2009); cell refinement:SAINT (Bruker, 2009); data reduction:SAINT; program(s) used to solve structure: SHELXTL (Sheldrick, 2008); program(s) used to refine structure:SHELXTL; molecular graphics:SHELXTL; software used to prepare material for publication:SHELXTLandPLATON(Spek, 2009).
HKF and CKQ thank Universiti Sains Malaysia (USM) for the Research University Grant (No. 1001/PFIZIK/811160). CKQ also thanks USM for the award of a USM fellowship. AMI is thankful to the Director of the National Institute of Technology for providing research facilities and also thanks the Board for Research in Nuclear Sciences, Department of Atomic Energy, Government of India, for a Young Scientist Award.
Supplementary data and figures for this paper are available from the IUCr electronic archives (Reference: HB5764).
References
Allen, F. H., Kennard, O., Watson, D. G., Brammer, L., Orpen, A. G. & Taylor, R. (1987).J. Chem. Soc. Perkin Trans. 2, pp. S1–19.
Bruker (2009).APEX2,SAINTandSADABS. Bruker AXS Inc., Madison, Wisconsin, USA.
Fun, H.-K., Quah, C. K., Malladi, S. & Isloor, A. M. (2010).Acta Cryst.E66, o2799–o2800.
Holla, B. S., Akberali, P. M. & Shivananda, M. K. (2000).Farmaco,55, 256– 263.
Isloor, A. M., Kalluraya, B. & Rao, M. (2000).J. Saudi Chem. Soc.4, 265–270. Isloor, A. M., Kalluraya, B. & Shetty, P. (2009).Eur. J. Med. Chem.44, 3784–
3787.
Sheldrick, G. M. (2008).Acta Cryst.A64, 112–122.
Soliman, R., Habib, N. S., Ashour, F. A. & el-Taiebi, M. (2001).Boll. Chim. Farm.140, 140–148.
Spek, A. L. (2009).Acta Cryst.D65, 148–155.
Sunil, D., Isloor, A. M. & Shetty, P. (2009).Pharma Chem.119–26.
Acta Crystallographica Section E
Structure Reports Online
ISSN 1600-5368
supporting information
Acta Cryst. (2011). E67, o164 [https://doi.org/10.1107/S1600536810052025]
4-(1,2,4-Triazol-1-yl)aniline
Hoong-Kun Fun, Ching Kheng Quah, B. Chandrakantha, Arun M. Isloor and Prakash Shetty
S1. Comment
Compounds incorporating heterocyclic ring systems continue to attract considerable interests due to the wide range of
biological activities they possess (Isloor et al., 2000). Triazoles are a class of heterocyclic compounds having a
five-membered ring of two carbon atoms and three nitrogen atoms (Soliman et al., 2001). They have wide range of
applications. In last few decades, triazoles have received much significant attention in the field of medicinal chemistry
because of their diversified biological properties like antibacterial (Isloor et al., 2009) and antifungal (Holla et al., 2000)
activities. In recent years, 1,2,4-triazole derivatives have been found to associate with anticancer properties (Sunil et al.,
2009). It is also observed that incorporation of aryl constituent into the triazoles ring systems augments the biological
activities considerably.
In the title molecule (Fig. 1), the triazol-1-yl ring (N1-N3/C1/C2, maximum deviation = 0.003 (1) Å at atom N3) is
inclined at angle of 34.57 (7)° with phenyl (C3-C8) ring. Bond lengths (Allen et al., 1987) and angles are within normal
ranges and are comparable to a related structure (Fun et al., 2010).
In the crystal packing (Fig. 2), the molecules are linked into two-dimensional sheets parallel to the ac-plane via
intermolecular N4–H2N4···N1 and C1–H1A···N2 hydrogen bonds. π-π stacking interactions between the centroids of
N1-N3/C1/C2 triazol-1-yl rings (Cg1), with Cg1···Cg1i distance of 3.6750 (8) Å [symmetry code: (i) 1-X, -Y, 2-Z] are
observed. The crystal structure is further consilidated by N4–H1N4···Cg2 (Table 1) interactions, where Cg2 is the
centroid of C3-C8 phenyl ring.
S2. Experimental
1,2,4-Triazole (2 g, 0.02 mol) was added lot-wise to a suspension of sodium hydride (60%, 1.47 g, 0.0308 mol) in dry
DMF (20 ml) at 0°C. After the addition, the reaction mixture was stirred at the same temperature for 30 min. A solution
of 4-fluoro nitrobenzene (2.82 g, 0.02 mol) in dry DMF (20 ml) was then added and the reaction mixture was stirred at
room temperature for 18 h. The reaction mixture was then quenched with ice water and extracted with ethyl acetate. The
organic layer was concentrated to afford a yellow solid as a nitro compound intermediate (3 g). This nitro compound was
taken in methanol (30 ml) and hydrogenated using 10% palladium on carbon (0.2 g) at 3-kg pressure of hydrogen. After
the reaction was over, the catalyst was filtered, the filtrate was concentrated to afford the title compound as a yellow
solid. Yellow blocks were recrystallised from ethanol. Yield : 2.8g, 60 %. M.p. 433-435K.
S3. Refinement
H1N4 and H2N4 were located in a difference Fourier map and allowed to refined freely. The remaining H atoms were
positioned geometrically and refined using a riding model with C–H = 0.93 Å and Uiso(H) = 1.2 Ueq(C). The highest
Figure 1
The molecular structure of the title compound showing 50% probability displacement ellipsoids for non-H atoms.
Figure 2
The crystal structure of the title compound, viewed along the b axis. H atoms not involved in hydrogen bonds (dashed
lines) have been omitted for clarity.
4-(1,2,4-Triazol-1-yl)aniline
Crystal data
C8H8N4 Mr = 160.18
Monoclinic, P21/c Hall symbol: -P 2ybc a = 5.5488 (1) Å b = 7.3656 (2) Å c = 19.5477 (5) Å β = 99.416 (2)° V = 788.15 (3) Å3 Z = 4
F(000) = 336 Dx = 1.350 Mg m−3
Mo Kα radiation, λ = 0.71073 Å Cell parameters from 3245 reflections θ = 3.0–29.1°
µ = 0.09 mm−1 T = 296 K Block, yellow
[image:3.610.136.475.275.444.2]Data collection
Bruker SMART APEXII CCD diffractometer
Radiation source: fine-focus sealed tube Graphite monochromator
φ and ω scans
Absorption correction: multi-scan (SADABS; Bruker, 2009) Tmin = 0.957, Tmax = 0.988
8036 measured reflections 2160 independent reflections 1722 reflections with I > 2σ(I) Rint = 0.030
θmax = 29.4°, θmin = 2.1° h = −7→7
k = −10→10 l = −26→24
Refinement
Refinement on F2 Least-squares matrix: full R[F2 > 2σ(F2)] = 0.044 wR(F2) = 0.118 S = 1.05 2160 reflections 110 parameters 0 restraints
Primary atom site location: structure-invariant direct methods
Secondary atom site location: difference Fourier map
Hydrogen site location: inferred from neighbouring sites
H atoms treated by a mixture of independent and constrained refinement
w = 1/[σ2(F
o2) + (0.0509P)2 + 0.1531P] where P = (Fo2 + 2Fc2)/3
(Δ/σ)max = 0.001 Δρmax = 0.23 e Å−3 Δρmin = −0.17 e Å−3
Extinction correction: SHELXTL (Sheldrick, 2008), Fc*=kFc[1+0.001xFc2λ3/sin(2θ)]-1/4 Extinction coefficient: 0.042 (5)
Special details
Geometry. All esds (except the esd in the dihedral angle between two l.s. planes) are estimated using the full covariance matrix. The cell esds are taken into account individually in the estimation of esds in distances, angles and torsion angles; correlations between esds in cell parameters are only used when they are defined by crystal symmetry. An approximate (isotropic) treatment of cell esds is used for estimating esds involving l.s. planes.
Refinement. Refinement of F2 against ALL reflections. The weighted R-factor wR and goodness of fit S are based on F2, conventional R-factors R are based on F, with F set to zero for negative F2. The threshold expression of F2 > 2sigma(F2) is used only for calculating R-factors(gt) etc. and is not relevant to the choice of reflections for refinement. R-factors based on F2 are statistically about twice as large as those based on F, and R- factors based on ALL data will be even larger.
Fractional atomic coordinates and isotropic or equivalent isotropic displacement parameters (Å2)
x y z Uiso*/Ueq
N1 0.3298 (2) 0.17124 (18) 1.08332 (6) 0.0542 (3)
N2 0.58582 (19) 0.24895 (17) 1.00992 (6) 0.0498 (3)
N3 0.34993 (17) 0.26004 (14) 0.97774 (5) 0.0378 (3)
N4 0.0895 (3) 0.4820 (2) 0.70184 (6) 0.0597 (4)
C1 0.2029 (2) 0.2126 (2) 1.02227 (7) 0.0480 (3)
H1A 0.0334 0.2092 1.0117 0.058*
C2 0.5611 (3) 0.1960 (2) 1.07255 (7) 0.0533 (4)
H2A 0.6948 0.1768 1.1072 0.064*
C3 0.2865 (2) 0.31773 (16) 0.90734 (6) 0.0360 (3)
C4 0.4336 (2) 0.27300 (17) 0.85909 (6) 0.0411 (3)
H4A 0.5752 0.2056 0.8724 0.049*
C5 0.3691 (2) 0.32893 (18) 0.79107 (6) 0.0432 (3)
H5A 0.4686 0.2986 0.7589 0.052*
C6 0.1573 (2) 0.43007 (17) 0.76988 (6) 0.0404 (3)
H7A −0.1296 0.5415 0.8068 0.052*
C8 0.0763 (2) 0.41891 (17) 0.88743 (6) 0.0415 (3)
H8A −0.0218 0.4496 0.9200 0.050*
H2N4 0.171 (3) 0.447 (2) 0.6697 (8) 0.065 (5)*
H1N4 −0.029 (3) 0.560 (3) 0.6921 (9) 0.078 (6)*
Atomic displacement parameters (Å2)
U11 U22 U33 U12 U13 U23
N1 0.0549 (7) 0.0658 (8) 0.0435 (6) 0.0049 (6) 0.0124 (5) 0.0063 (5) N2 0.0340 (5) 0.0681 (8) 0.0452 (6) −0.0015 (5) 0.0006 (4) 0.0051 (5) N3 0.0318 (5) 0.0448 (5) 0.0367 (5) 0.0009 (4) 0.0052 (4) −0.0009 (4) N4 0.0711 (8) 0.0683 (9) 0.0406 (6) 0.0212 (7) 0.0116 (6) 0.0085 (6) C1 0.0392 (6) 0.0616 (8) 0.0447 (7) 0.0024 (6) 0.0115 (5) 0.0042 (6) C2 0.0485 (7) 0.0650 (9) 0.0439 (7) 0.0014 (6) −0.0002 (6) 0.0047 (6) C3 0.0324 (5) 0.0396 (6) 0.0355 (6) −0.0019 (4) 0.0043 (4) −0.0023 (4) C4 0.0313 (5) 0.0480 (7) 0.0445 (7) 0.0041 (5) 0.0074 (5) −0.0005 (5) C5 0.0388 (6) 0.0518 (7) 0.0412 (6) 0.0008 (5) 0.0133 (5) −0.0019 (5) C6 0.0427 (6) 0.0395 (6) 0.0386 (6) −0.0027 (5) 0.0051 (5) −0.0006 (5) C7 0.0388 (6) 0.0453 (7) 0.0451 (7) 0.0081 (5) 0.0042 (5) −0.0005 (5) C8 0.0375 (6) 0.0468 (7) 0.0413 (6) 0.0053 (5) 0.0096 (5) −0.0049 (5)
Geometric parameters (Å, º)
N1—C1 1.3183 (17) C3—C4 1.3842 (16)
N1—C2 1.3468 (19) C3—C8 1.3851 (16)
N2—C2 1.3134 (18) C4—C5 1.3821 (17)
N2—N3 1.3587 (14) C4—H4A 0.9300
N3—C1 1.3332 (16) C5—C6 1.3957 (17)
N3—C3 1.4284 (14) C5—H5A 0.9300
N4—C6 1.3758 (16) C6—C7 1.3987 (17)
N4—H2N4 0.871 (18) C7—C8 1.3755 (16)
N4—H1N4 0.87 (2) C7—H7A 0.9300
C1—H1A 0.9300 C8—H8A 0.9300
C2—H2A 0.9300
C1—N1—C2 102.04 (11) C8—C3—N3 119.62 (10)
C2—N2—N3 102.11 (11) C5—C4—C3 119.72 (11)
C1—N3—N2 109.16 (10) C5—C4—H4A 120.1
C1—N3—C3 128.78 (10) C3—C4—H4A 120.1
N2—N3—C3 122.06 (10) C4—C5—C6 121.17 (11)
C6—N4—H2N4 121.5 (11) C4—C5—H5A 119.4
C6—N4—H1N4 118.2 (12) C6—C5—H5A 119.4
H2N4—N4—H1N4 120.1 (16) N4—C6—C5 121.27 (12)
N1—C1—N3 111.01 (12) N4—C6—C7 120.72 (12)
N1—C1—H1A 124.5 C5—C6—C7 118.00 (11)
N3—C1—H1A 124.5 C8—C7—C6 120.95 (11)
N2—C2—H2A 122.2 C6—C7—H7A 119.5
N1—C2—H2A 122.2 C7—C8—C3 120.16 (11)
C4—C3—C8 120.00 (11) C7—C8—H8A 119.9
C4—C3—N3 120.38 (10) C3—C8—H8A 119.9
C2—N2—N3—C1 −0.42 (15) C8—C3—C4—C5 −0.32 (19)
C2—N2—N3—C3 178.65 (11) N3—C3—C4—C5 179.64 (11)
C2—N1—C1—N3 −0.25 (16) C3—C4—C5—C6 0.0 (2)
N2—N3—C1—N1 0.44 (16) C4—C5—C6—N4 −178.34 (13)
C3—N3—C1—N1 −178.55 (12) C4—C5—C6—C7 0.26 (19)
N3—N2—C2—N1 0.29 (17) N4—C6—C7—C8 178.50 (13)
C1—N1—C2—N2 −0.04 (18) C5—C6—C7—C8 −0.11 (19)
C1—N3—C3—C4 −146.03 (13) C6—C7—C8—C3 −0.3 (2)
N2—N3—C3—C4 35.09 (17) C4—C3—C8—C7 0.48 (19)
C1—N3—C3—C8 33.93 (19) N3—C3—C8—C7 −179.49 (11)
N2—N3—C3—C8 −144.95 (12)
Hydrogen-bond geometry (Å, º)
Cg2 is the centroid of the C3–C8 phenyl ring.
D—H···A D—H H···A D···A D—H···A
N4—H2N4···N1i 0.871 (16) 2.208 (16) 3.0709 (18) 171.1 (15)
C1—H1A···N2ii 0.93 2.50 3.4035 (16) 166
N4—H1N4···Cg2iii 0.87 (2) 2.58 (2) 3.3929 (16) 156.0 (17)