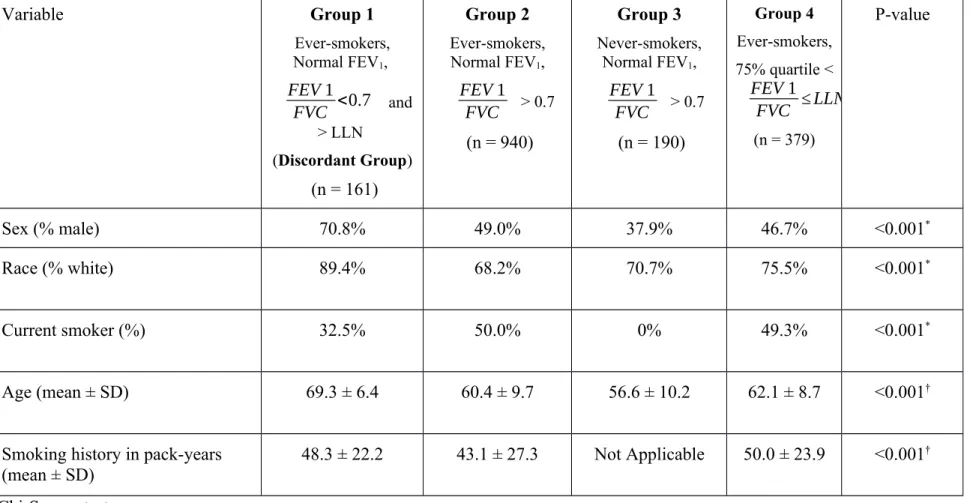
Table S1: Baseline characteristics for the four groups.
Variable Group 1
Ever-smokers, Normal FEV
1, FEV 1
FVC <0.7 and
> LLN (Discordant Group)
(n = 161)
Group 2 Ever-smokers, Normal FEV1,
FEV 1 FVC > 0.7 (n = 940)
Group 3 Never-smokers,
Normal FEV
1, FEV 1
FVC > 0.7 (n = 190)
Group 4 Ever-smokers, 75% quartile <
FEV 1 FVC ≤ LLN (n = 379)
P-value
Sex (% male) 70.8% 49.0% 37.9% 46.7% <0.001
*Race (% white) 89.4% 68.2% 70.7% 75.5% <0.001
*Current smoker (%) 32.5% 50.0% 0% 49.3% <0.001
*Age (mean ± SD) 69.3 ± 6.4 60.4 ± 9.7 56.6 ± 10.2 62.1 ± 8.7 <0.001
†Smoking history in pack-years
(mean ± SD) 48.3 ± 22.2 43.1 ± 27.3 Not Applicable 50.0 ± 23.9 <0.001
†*
Chi-Square test
†
ANOVA
Table S2
Comparison of physiologic and clinical variables between ever-smokers with normal FEV
1and FEV
1/FVC > LLN but < 0.70 (“discordant” group, Group 1), ever-smokers with normal FEV
1and FEV
1/FVC > 0.70 (Group 2), never-smokers with normal FEV
1and FEV
1/FVC > 0.70 (Group 3) and ever-smokers with FEV
1/FVC ≤ LLN and > 75
thquartile (Group 4).
Clinical Outcome
Group 1 Ever-smokers, Normal FEV
1,
FEV 1 FVC <0.7 and > LLN (Discordant
Group) (n = 161)
Group 2 Ever-smokers, Normal FEV
1,
FEV 1 FVC >
0.7 (n = 940)
Group 3 Never-smokers,
Normal FEV
1, FEV 1
FVC >
0.7 (n = 190)
Group 4 Ever-smokers, 75% quartile <
FEV 1 FVC ≤ LLN (n = 379)
Overall p-value*
Unadjusted (Adjusted)
P-values for pairwise comparisons (Unadjusted)
Group 1 vs. 2
Group 1 vs. 3
Group 1 vs. 4
Group 2 vs. 3
Group 2 vs. 4
Group 3 vs. 4
FEV
1% predicted
92.1 ± 12.0 97.5 ± 12.8 102.0 ± 11.5 76.9 ± 16.2 < 0.001 (< 0.001)
< 0.001 < 0.001 < 0.001 < 0.001 < 0.001 < 0.001**
FEF
25-75%% predicted
61.2 ± 11.0 102.3 ± 33.4 121.3 ± 32.5 45.3 ± 11.9 < 0.001 (< 0.001)
< 0.001 < 0.001 < 0.001 < 0.001 < 0.001 < 0.001**
6MWD (m) 437.5± 109.6 437.2 ± 97.7 479.3 ± 103.4 422.2 ± 128.1 < 0.001 (0.17)
0.97 < 0.001 0.13 < 0.001 0.02 < 0.001**
St George’s Respiratory Questionnaire Total Score
22.5 ± 17.4 24.2 ± 19.1 8.8 ± 10.0 34.6 ± 20.0 < 0.001 (<0.001)
0.28 < 0.001 < 0.001 < 0.001 < 0.001 < 0.001**
COPD Assessment Test (CAT)
10.7 ± 7.4 11.3 ± 8.1 4.7 ± 6.0 14.5 ± 7.7 < 0.001 (<0.001)
0.36 < 0.001 < 0.001 < 0.001 < 0.001 < 0.001**
Use of either inhaled corticosteroid or
bronchodilator
34.4% 25.1% 3.9% 34.6% < 0.001
(< 0.001)
0.01 <0.001 0.96 <0.001 0.003 <0.001**
Chronic bronchitis
17.3% 17.8% 2.1% 24.3% < 0.001
(<0.001)
0.88 <0.001 0.05 <0.001 <0.001 <0.001
†mMRC Dyspnea score
≥ 2
13.8% 13.6% 2.7% 21.6% < 0.001
(<0.001) 0.95 <0.001 0.03 <0.001 <0.001 <0.001
†Change in FEV
1-60.5± 120.5 -55.2 ± 127.5 -41.2 ± 99.7 -53.8 ± 123.2 0.53 0.64 0.17 0.60 0.19 0.87 0.30**
(ml/year) (0.99) Exacerbation
(#/year)
0.1 ± 0.4 0.1 ± 0.6 0.02 ± 0.1 0.3 ± 0.8 < 0.001 (< 0.001)
0.50 0.13 < 0.01 0.006 < 0.01 < 0.01**
Emphysema = % of voxels with CT attenuation <-950 Hounsfield Units (HU) on full inspiration. Functional small airways disease = % of voxels with CT attenuation > -950 HU on the inspiratory exam and <-856 HU on the expiratory scan, as determined via dynamic image registration (Parametric Response Mapping, PRM). Airway thickening = square root of the wall area for a standardized airway with an internal perimeter of 10 mm (Pi10).
* From likelihood ratio test comparing means of 3 groups from multivariable model with outcomes (rows) and group status as predictors adjusted for age, sex, race, smoking history (pack-years) and current smoking.
**
p-values from 2 sample t-test
†
Pairwise p-value form Wald test comparing means of 2 groups
Table S3
Comparison of CT variables between ever-smokers with normal FEV
1and FEV
1/FVC > LLN but < 0.70 (“discordant” group, Group
1), ever-smokers with normal FEV
1and FEV
1/FVC > 0.70 (Group 2), never-smokers with normal FEV
1and FEV
1/FVC > 0.70
(Group 3) and ever-smokers with FEV
1/FVC ≤ LLN and > 75
thquartile (Group 4).
Variable Group 1 Ever- smokers,
Normal FEV
1, FEV 1
FVC < 0.7 and > LLN (Discordant
Group) (n = 161)
Group 2 Ever- smokers,
Normal FEV
1, FEV 1
FVC
> 0.7 (n = 940)
Group 3 Never- smokers,
Normal FEV
1, FEV 1
FVC
> 0.7 (n = 190)
Group 4 Ever- smokers,
75%
quartile <
FEV 1 FVC ≤ LLN (n = 379)
Overall p- value*
Unadjusted (Adjusted)
P-values for pairwise comparisons (Unadjusted)
Group 1 vs. 2
Group 1 vs. 3
Grou p 1 vs. 4
Group 2 vs. 3
Group 2 vs. 4
Group 3 vs. 4
Emphysema (%)
2.1 ± 2.9 0.7 ± 2.6 0.3 ± 0.9 2.3 ± 4.4 < 0.001 (< 0.001)
< 0.001 < 0.001 0.55 < 0.001 < 0.001 < 0.001**
Functional small airways disease (%)
18.0 ± 10.6 9.1 ± 10.0 7.1 ± 8.3 16.6 ± 11.2 < 0.001 (< 0.001)
< 0.001 < 0.001 0.16 < 0.001 < 0.001 < 0.001**
Airway wall thickening (Pi10)
3.70 ± 0.01 3.71 ± 0.00 3.69 ± 0.01 3.73 ± 0.11 < 0.001 (< 0.001)
0.41 0.01 0.008 < 0.001 0.003 < 0.001**
Emphysema present >
ULN
38.7% 17.4% 8.2% 44.5% < 0.001
(<0.001)
<0.001 <0.001 0.22 0.004 <0.001 <0.001
†CT-defined 15.3% 7.8% 2.9% 24.9% < 0.001 0.003 <0.001 0.02 0.03 <0.001 <0.001
†functional small airway abnormality (fSAD) present >
ULN
(<0.001)
Either emphysema or fSAD present
44% 20.7% 9.4% 51.4% < 0.001
(<0.001)
<0.001 <0.001 0.13 <0.001 <0.001 <0.001
†Both emphysema and fSAD present
10% 4.5% 1.8% 18.0% < 0.001
(<0.001)
0.007 0.005 0.02 0.11 <0.001 <0.001
†Presence of emphysema = ≥ upper limit of normal (ULN); Presence of fSAD = ≥ upper limit of normal (ULN). Emphysema = % of voxels with CT attenuation <-950 Hounsfield Units (HU) on full inspiration. Functional small airways disease = % of voxels with CT attenuation >
-950 HU on the inspiratory exam and <-856 HU on the expiratory scan, as determined via dynamic image registration (Parametric Response Mapping, PRM).
* From likelihood ratio test comparing means of 3 groups from multivariable model with outcomes (rows) and group status as predictors adjusted for age, sex, race, smoking history (pack-years) and current smoking.
** P-value from 2 sample t test
†