Thesis by Hunter C Davis
In Partial Fulfillment of the Requirements for the degree of
Doctor of Philosophy in Chemistry
CALIFORNIA INSTITUTE OF TECHNOLOGY Pasadena, California
2020
No man is an island, least of all me. My work was made possible by the incredible scientific ecosystem that has supported me for the last five years. The nexus of this support was my advisor, Professor Mikhail Shapiro. Mikhail, I will never be able to thank you for taking a chance on a student who confessed in your first meeting that he knew nothing about biology. Your curiosity and grounded optimism inspire my own, pushing me to explore deep and impactful questions while regulating the more stochastic tendencies of my intellect. Thank you for valuing my insight and providing corrective guidance when I lose track of the larger scientific picture. I take profound pride in having worked with you from the early stages of your now burgeoning lab. I am also deeply grateful to Professor Greg Engel, who gave me a chance to prove myself as an undergraduate researcher when I knew less than nothing. Providing me with substantial independence early in my scientific career cultivated my confidence in device fabrication which has become a cornerstone of my research. I’m additionally indebted to Professor Markus Meister. Markus, I am incredibly grateful for your guidance and support over the past few years as we struggled to correct the scientific record. I hope that you feel, as I do, that it has been worth the headache. Exceptional claims require exceptional evidence. Thank you for helping to enforce that requirement. While the full list of my scientific mentors is too long to tell, I would also like to thank Professor Thomas Miller and Professor Scott Cushing for sitting on my thesis committee and for their continued council.
On my first day of undergraduate study, I stepped into a physics lecture mortified at my ill-preparedness for the challenges ahead. It was in this state of horror that I met Tankut Can, a TA who took the time to help me fill in the gaps in my knowledge that would have otherwise stalled my scientific career before it began. It is in a similar vein that I acknowledge Professor Graham Griffin, who spent years teaching me practical optics when I was an undergraduate researcher. His patience with my hours of questions as we built complex optical systems astounds me to this day, and I would not be the scientist I am today without his generosity.
an incredible privilege to explore strange new ideas with you. You’re my team. I am particularly grateful to Pradeep Ramesh, who I count among my dearest friends and most impressive colleagues. Thank you for recruiting me into the group and guiding me through my early days in biology. I am also grateful to my dear friend and next-door neighbor in the office, Arash Farhadi. You’ve made it so much fun to come into the office for the past few years. Thanks for always being willing to spend a few hours on an intellectual tangent. Many of the best ideas I’ve had have come out of our circuitous talks. An additional thanks is due for your constant willingness to travel with me through the joy, sadness, and frustration that pervades the daily life of graduate research. I have also been blessed by wonderful support from friends outside of the lab, chief among them being Alysha de Souza. Lysh, thank you for always being available to grab a cup of coffee and talk about the world. I’ll miss our protracted discussions about science, politics, and life, but I know we’ll find a way to stay in each other’s orbit.
The vast biomolecular toolkit for optical imaging and control of cellular function has revolutionized the study of in vitro samples and superficial tissues in living organisms but leaves deep tissue unexplored. To look deeper in tissue and observe system-level biological function in large organisms requires a modality that exploits a more penetrant form of energy than visible light. Magnetic imaging with MRI reveals the previously unseen, with endogenous tissue contrast and practically infinite penetration depth. While these clear advantages have made MRI a cornerstone of modern medical imaging, the sparse library of molecular agents for MRI have severely limited its utility for studies of cellular function in vivo. The development of new molecular agents for MRI has suffered from a lack of tools to study the connection between changes in the microscale cellular environment and the corresponding millimeter-scale MRI contrast. Bridging this gap requires revisiting the mechanistic underpinnings of MRI contrast, casting aside some of the simplifications that smooth over sub-voxel heterogeneity that is rich with information pertinent to the underlying cell state.
improved in vitro studies of cellular function.
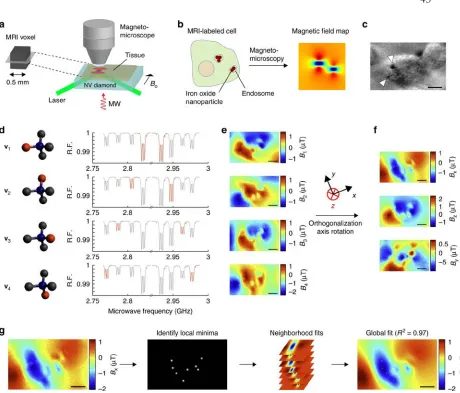
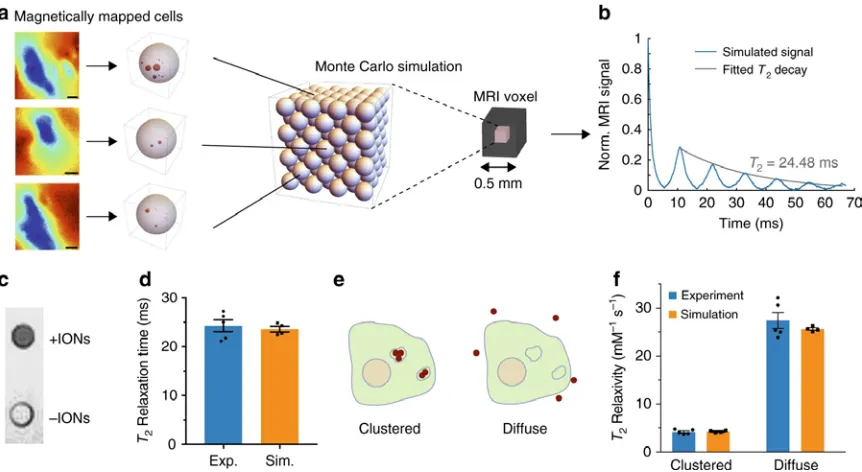
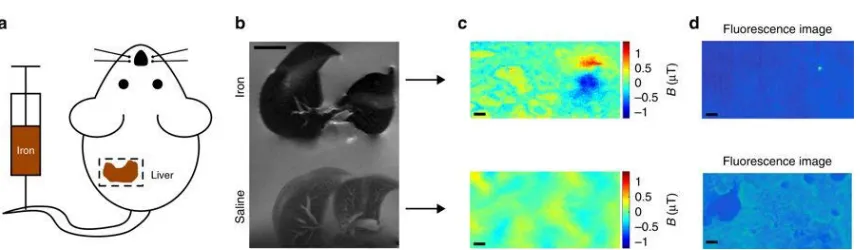
In the third chapter, we introduce our study that maps microscale magnetic fields in cells and tissues and connects those magnetic fields to MRI contrast. Such a connection has previously been experimentally intractable due to the lack of methods to resolve small magnetic perturbations with microscale resolution. To overcome this challenge, we leverage nitrogen vacancy diamond magnetometry to optically probe magnetic fields in cells with sub-micron resolution and nanotesla sensitivity, together with iterative localization of field sources and Monte Carlo simulation of nuclear spins to predict the corresponding MRI contrast. We demonstrate the utility of this technology in an in vitro model of macrophage iron uptake and histological samples from a mouse model of hepatic iron overload. In addition, we show that this technique can follow dynamic changes in the magnetic field occurring during contrast agent endocytosis by living cells. This approach bridges a fundamental gap between an MRI voxel and its microscopic constituents and provides a new capability for noninvasive imaging of opaque tissues.
Davis, H.C. et al. (2019). “Nanoscale fluorescent thermometry of magnetic nanoparticles and ferritin in an alternating magnetic field” In preparation.
HCD and MGS conceived the study. HCD designed the experiments, collected and analyzed the data, and wrote the in silico model for particle clustering. HCD and MGS prepared the manuscript.
Davis, H.C.† , Ramesh, P.† et al. (2018). “Mapping the microscale origins of MRI contrast with sub-cellular NV magnetometry”. In: Nature Communications 9, 131. doi:10.1038/s41467-017-02471-7
(†Equal Contribution)
HCD conceived the study with PR, acquired and processed all optical magnetometry data, designed the Monte Carlo simulations with help from AB, performed the MRI experiments with PR, and prepared the manuscript with PR and MGS.
Mukherjee, A, Wu, D, Davis, H.C., Shapiro, M.G. (2016) “Non-invasive imaging using reporter genes altering cellular water permeability” In: Nature Communications 7,13891. doi:10.1038/ncomms13891
HCD, AM, and MGS established the physical model for relaxation. HCD designed the Monte Carlo model for diffusion and signal attenuation and participated in the preparation of the manuscript.
Ramesh, P., Hwang, S.J., Davis, H.C. et al. (2018). “Ultraparamagnetic Cells Formed through Intracellular Oxidation and Chelation of Paramagnetic Iron”. In: Angewandte Chemie Internation Edition 57, pp. 12385-12389. doi: 10.1002/anei.201805042
HCD worked with PR to establish the physical model for transverse relaxation. HCD designed the Monte Carlo simulations with help from VI.
Mukherjee, A, Davis, H.C., et al. (2017). “Biomolecular MRI reporters: evolution of new mechanisms”. In: Progress in Nuclear Magnetic Resonance Spectroscopy, 102-103, pp. 32-42. doi: 10.1016/j.pnmrs.2017.05.002
HCD participated in the preparation of the manuscript.
Piranar, D, Farhadi, A, Davis, H.C. et al. (2017). “Going Deeper: Biomolecular Tools for Acoustic and Magnetic Imaging and Control of Cellular Function” In: Biochemistry 56(39): pp. 5202-5209. doi: 10.1021/acs.biochem.7b00443
TABLE OF CONTENTS
Acknowledgements………...iii
Abstract ……….v
Published Content and Contributions………...viii
Table of Contents………..ix
List of Figures……….………..xi
Chapter I: Foundational Physics of Magnetic Resonance Imaging ... 1-17 Introduction ... 1
The magnetic behavior of nuclear spins ... 2
The Bloch model of Nuclear Magnetic Resonance ... 3
RF pulses and rotating reference frames ... 4
Phenomenological relaxation equations ... 4
Longitudinal (T1) relaxation ... 6
Relaxation of pure water ... 6
Relaxation from interaction with paramagnetic molecules... 8
Transverse (T2) relaxation ... 10
Diffusion and relaxation near strong magnetic sources ... 14
Diffusion MRI ... 15
Bibliography ... 18
Chapter II: Some Random Walks in Computational MRI ... 20-36 Introduction ... 20
Non-invasive imaging using aquaporin ... 21
Physical Model and simulation of DWI contrast ... 23
Dynamic range of AQP1 ... 26
Contrast from AQP1 within a mixed population ... 27
Transverse relaxation from ultraparamagnetic cells ... 30
Design of the genetic construct ... 31
Experimental Results ... 32
Monte Carlo Simulations ... 34
Bibliography ... 37
Chapter III: Mapping the Microscale Origins of MRI Contrast with subcellular diamond magnetometry ... 41-77 Introduction ... 41
Results ... 43
Mapping sub-cellular magnetic fields ... 43
Connecting microscale fields to MRI contrast ... 46
Mapping magnetic fields in histological specimens ... 49
Magnetic imaging of endocytosis ... 50
Discussion ... 51
Nitrogen Vacancy Magnetomicroscope ... 54
Cell Culture ... 55
Vector Magnetometry ... 56
Live Cell Magnetometry ... 57
Intracellular Iron Quantification ... 57
Field Fitting and Dipole Localization ... 58
Monte Carlo Simulation & Cell Library ... 60
MR Imaging and Relaxometry ... 62
Mouse Model of Iron Overload ... 63
Software and Image Processing ... 64
Statistical Analysis ... 65
Supplementary Notes ... 65
Supplementary Figures ... 72
Bibliography ... 78
Chapter IV: Nanoscale fluorescent thermometry of magnetic nanoparticles And ferritin in an alternating magnetic field ... 82-107 Introduction ... 82
Materials and Methods ... 85
Probe conjugation and sample preparation for commercial particles .. 85
Core-shell nanoparticle synthesis and characterization ... 86
Fluorometry ... 87
Electromagnet construction and characterization... 88
Sample calibration chamber ... 89
Results ... 89
Supplementary Note: Simulations ... 100
Supplementary Figures ... 102
LIST OF FIGURES
Figure Page
2.1Monte Carlo simulations of water diffusion in AQP1+ and GFP+ Cells ... 25
2.2AQP1 reports gene expression over a large dynamic range ... 27
2.3AQP1 expression is observable in mixed cell populations ... 29
2.4Ultraparamagnetic Gene Circuit ... 31
2.5UPMAG cells produce enhanced MRI contrast ... 33
2.6Simulated and experimental R2 and T1 for multiple concentrations ... 36
3.1Subcellular mapping of magnetic fields in cells labeled for MRI. ... 45
3.2Predicted and experimental MRI behavior in cells. ... 48
3.3Magnetometry of histological samples ... 50
3.4Dynamic magnetic microscopy in live mammalian cells ... 51
3.S1Simulated Dipole Fields. ... 72
3.S2SQUID magnetometry and saturation of IONs ... 73
3.S3Additional cells for Monte Carlo library ... 73
3.S4Additional tissue sections. ... 74
3.S5Additional live cells. ... 74
3.S6Live cell imaging with extended time course ... 75
3.S7Supplementary in silico models of T2 relaxation ... 76
3.S8Magnetic-fluorescent colocalization ... 77
4.1Nanoscale thermometry during magnetic nanoparticle hyperthermia ... 90
4.2Thermochromic calibration of particle-bound and free dye ... 91
4.3Nanoscale thermometry of synthetic nanoparticles ... 93
4.4Ferritin shows no measurable heating during RF-AMF stimulation ... 95
4.5Artifactual measurement with a solid probe ... 96
4.6Artifact due to nanoparticle clustering under applied field ... 98
4.S1 Fluorescence Spectra of Dylight 550 conjugated nanoparticles and DY-521XL ... 102
4.S2 Additional hyperthermia trials with separate batches of magnetic particles. ... 102
4.S3 Artifact from background temperature variation due to the toroid.. ... 103
C h a p t e r 1
FOUNDATIONAL PHYSICS OF MAGNETIC RESONANCE IMAGING
1.1 Introduction
1.2 The magnetic behavior of nuclear spins
MRI signal is derived from nuclear magnetic resonance (NMR), a spin-state transition resonance for the magnetic moment of nuclei. For most biological cases, the nuclei of interest are protons bound to water in tissue. As protons have spin angular momentum S=1/2, their magnetization operator can be defined by:
𝒎𝒎� =𝛾𝛾𝑺𝑺�
Here 𝛾𝛾 is the gyromagnetic ratio for the proton and 𝑺𝑺� is the spin angular momentum operator, which has components in x, y, and z given by:
𝑆𝑆̂𝑧𝑧= ℏ2�10 −10 �,𝑆𝑆̂𝑦𝑦 =ℏ2�0𝑖𝑖 0𝑖𝑖�,𝑆𝑆̂𝑥𝑥 =ℏ2�0 11 0�
The hamiltonian of a magnetic dipole in an externally applied magnetic field 𝑩𝑩 is given by 𝐻𝐻� =−𝒎𝒎� ⋅ 𝑩𝑩
In NMR and MRI, a strong bias field 𝐵𝐵0 is applied, and the direction of this field is taken by convention to be in the +z direction. Thus,
𝐻𝐻� =−𝑚𝑚�𝑧𝑧𝐵𝐵0= −𝛾𝛾𝑆𝑆̂𝑧𝑧𝐵𝐵0 =−𝛾𝛾ℏ𝐵𝐵02 �10 −10 �
The orthonormal basis for this hamiltonian is formed by two states, |+⟩ =�1
0� and |−⟩= �01�, with
energy levels 𝐻𝐻|±⟩ =∓𝛾𝛾ℏ𝐵𝐵0
2 . This magnetic field dependent energy splitting of these spin states is known as Zeeman splitting and causes a preferential alignment of the magnetic moment of the proton with the magnetic field. An arbitrary state in this system can be written as |𝜓𝜓⟩=𝑎𝑎|+⟩+𝑏𝑏|−⟩=
along the bias field is only a few protons per million. In thermal equilibrium, the density matrix for this two-level system is:
𝜌𝜌= � 1 2 +
ℏ𝛾𝛾𝐵𝐵0
4𝑘𝑘𝑇𝑇 0
0 12−ℏ𝛾𝛾𝐵𝐵4𝑘𝑘𝑇𝑇0�
As would be expected, the off-diagonal terms representing superposition states are zero at thermal equilibrium and as a result, so too are the expectation values of the magnetization in the x and y dimensions.
1.3 The Bloch model and Nuclear Magnetic Resonance
As demonstrated by Richard Feynman in his landmark paper on two-level systems 7, the dynamics of the expectation value of the magnetization of an isolated nuclear spin in a magnetic field can be calculated using the Liouville equation for quantum mechanical observables:
𝑑𝑑
𝑑𝑑𝑑𝑑⟨𝒎𝒎� ⟩= 1
𝑖𝑖ℏ��𝒎𝒎�,𝐻𝐻���=𝛾𝛾⟨𝒎𝒎� ⟩×𝑩𝑩
This solution is equivalent to the equation of motion for a classical magnetic dipole m with intrinsic angular momentum S in a magnetic field B. If the magnetic moment of the dipole is 𝒎𝒎= 𝛾𝛾𝑺𝑺, it will experience a torque 𝝉𝝉 =𝒎𝒎×𝑩𝑩. The equation of motion for 𝒎𝒎 is thus,
𝑑𝑑𝒎𝒎 𝑑𝑑𝑑𝑑 =
𝑑𝑑(𝛾𝛾𝑺𝑺)
𝑑𝑑𝑑𝑑 =𝛾𝛾(𝝉𝝉) =𝛾𝛾𝒎𝒎×𝑩𝑩.
NMR, and it is still widely used today 8. We will rely heavily on Bloch’s simple model for the remainder of this thesis.
1.4 RF Pulses and Rotating Reference Frames
As the transverse component of the magnetic moment of a water bound proton in a strong bias field is zero at equilibrium, a perturbation is necessary to induce precession. Let’s examine the response of our semi-classical model of a proton magnetic dipole 𝒎𝒎 in a strong longitudinal bias field 𝑩𝑩𝟎𝟎 to a second magnetic field 𝑩𝑩𝟏𝟏 applied orthogonal to 𝑩𝑩𝟎𝟎. If 𝑩𝑩𝟏𝟏 is constant and much weaker than 𝑩𝑩𝟎𝟎, there will be no net effect as the precession of the dipole around the 𝑩𝑩𝟎𝟎 field will average out any torque applied by 𝑩𝑩𝟏𝟏 in a single revolution. If instead our magnetic perturbation is an oscillating field 𝑩𝑩𝟏𝟏= 2𝐵𝐵1sin(𝜔𝜔0𝑑𝑑+𝜙𝜙)𝒚𝒚� the proton magnetic moment will tip off of the z axis. RF excitations are generally referred to by magnitude of the induced rotation of the nuclear spin with the angle 𝜃𝜃 = 𝑑𝑑𝛾𝛾𝐵𝐵1. If the oscillating field is held on for 𝑑𝑑 =2𝜔𝜔𝜋𝜋1 where 𝜔𝜔1 =𝛾𝛾𝐵𝐵1, a magnetic moment that starts
aligned with the 𝐵𝐵0 bias field will be rotated into the xy plane, where it will precess at the Larmor frequency 𝜔𝜔0, driven by the torque from 𝐵𝐵0. The precession of an ensemble of nuclear magnetic dipole moments in the transverse plane will form an AC magnetic signal that can be measured by way of an induced voltage on a receiver coil according to Farraday’s law 9.
This picture is greatly simplified in a rotating reference frame that rotates at a frequency equal to the Larmor precession frequency in the transverse plane. If we decompose the linearly polarized 𝑩𝑩𝟏𝟏 field into an equal sum of two counter-rotating circularly polarized fields rotating at 𝜔𝜔𝑅𝑅𝑅𝑅 =𝜔𝜔0 = 𝛾𝛾𝐵𝐵0 in the lab frame, one of these fields will be static in the rotating reference frame
nuclear dipole in this perturbing field is then simply a rotation around the y axis, with rotation frequency 𝜔𝜔1 = 𝛾𝛾𝐵𝐵1. Once in the transverse plane, a magnetic dipole precessing at the Larmor frequency 𝜔𝜔0 = 𝛾𝛾𝐵𝐵0 will remain static.
1.5 Phenomenological relaxation equations
The excitation of an ensemble of nuclear spins by a perturbing 𝑩𝑩𝟏𝟏 field generates only a transient perturbation to the equilibrium magnetic state. The perturbation to the longitudinal magnetization (𝑚𝑚𝑧𝑧) of our spin ensemble will relax to the thermal equilibrium through a process known as spin-lattice relaxation with a characteristic time 𝑇𝑇1 such that after an RF pulse rotates the magnetic moment of the proton into the transverse plane,
𝑀𝑀𝑧𝑧(𝑑𝑑) =𝑀𝑀0(1− 𝑒𝑒−
𝑡𝑡 𝑇𝑇1).
Immediately after the RF pulse is applied, the magnetic moments of the spins inside of a given ensemble will precess in phase around 𝐵𝐵0. The precession of these spins will decohere over time and as a result, the transverse magnetization will relax to zero with a characteristic time 𝑇𝑇2 such that
𝑀𝑀𝑥𝑥𝑦𝑦 =�𝑀𝑀𝑥𝑥2 +𝑀𝑀𝑦𝑦2 =𝑀𝑀0𝑒𝑒− 𝑡𝑡𝑇𝑇2
Both the longitudinal and transverse relaxation times are heavily affected by the chemical and magnetic environment experienced by the water-bound protons and combined they represent the basis of image contrast in MRI. The model of Felix Bloch was adapted with phenomenological terms to account for these relaxation dynamics and the effects of water diffusion in the Bloch-Torrey Equation 10:
𝑑𝑑𝑴𝑴
𝑑𝑑𝑑𝑑 = 𝛾𝛾𝑴𝑴×𝑩𝑩 − 𝐷𝐷∇2𝑴𝑴 −
𝑴𝑴𝒙𝒙+𝑴𝑴𝒚𝒚 𝑇𝑇2 −
Here 𝐷𝐷 is the diffusion constant for the nuclei of interest. This simple equation is incredibly powerful for predicting the magnetic response of a large ensemble of water molecules in a homogeneous environment to an exogenously imposed magnetic field and is extensively used as a first pass approximation for everything from basic pulse sequence design to advanced techniques like compressed sensing and MRI fingerprinting11. However, the phenomenological relaxation parameters are of limited utility for molecular-scale insights without significant further development. In the remainder of this chapter, I will examine the molecular magnetic perturbations that undergird the relaxation of water-bound protons in MRI, demonstrating the pitfalls of assuming phenomenological relaxation rates on the millimeter scale along the way.
1.6 Longitudinal (𝑻𝑻𝟏𝟏) Relaxation
While this thesis will heavily focus on the rich physical underpinnings of transverse (𝑇𝑇2) relaxation, it is also useful to consider the significance of longitudinal relaxation both for understanding the magnetodynamcis of the water-bound proton and the significant practical applications of molecular agents that enhance 𝑇𝑇1 contrast for research and clinical applications.
1.6.1 Relaxation of pure water
produced by sources inside of the lattice as a mechanism to couple to the bath. As discussed during the introduction to excitation RF pulses, exciting changes in the longitudinal magnetization requires a perturbing magnetic field that is resonant with the Larmor precession frequency of the proton in the bias field. In pure water, this perturbing field can be generated by the Brownian motion of
neighboring water-bound protons. This dipolar coupling with neighboring molecules scales as 1 𝑟𝑟6
where 𝑟𝑟 is the distance between the two molecules, so it is a very near-field interaction. In the case of water, each proton has a corresponding partner bound to the same molecule. The precession of this nearest neighbor proton combined with the tumbling of the water molecule leads to a complex spectral density of magnetic field dependent both on the Brownian motion of the water and on the magnetic dynamics of the proton. Using these relationships, Bloembergen, Purcell, and Pound came up with a simple model for predicting the 𝑇𝑇1 relaxation rate of a water-bound proton due only to this nearest neighbor proton 12. This solution is referred to as the BPP equation for longitudinal relaxation and states:
1 𝑇𝑇1 =
3 10�
𝛾𝛾4ℏ2 𝑏𝑏6 � �
𝜏𝜏𝑐𝑐 1 + 4𝜋𝜋2𝜈𝜈
02𝜏𝜏𝑐𝑐2+
2𝜏𝜏𝑐𝑐 1 + 16𝜋𝜋2𝜈𝜈
02𝜏𝜏𝑐𝑐2�
Here 𝑏𝑏 is the interproton distance, 𝜈𝜈0 is the Larmor frequency of the proton in Hz (~42.58 MHz/Tesla), and 𝜏𝜏𝑐𝑐 is the correlation time for the orientation of the molecule. In pure water at 20°
C, the correlation time is around 3.5 ps, so 16𝜋𝜋2𝜈𝜈02𝜏𝜏𝑐𝑐2 ≪1 and 1
𝑇𝑇1 = .19 𝑠𝑠
−1. In this regime, the
𝜔𝜔0⋅ 𝜏𝜏𝑐𝑐 = √21.
The contribution of neighboring water molecules to the relaxation of a water bound proton can also be calculated as:
1 𝑇𝑇1 =
9𝜋𝜋2𝛾𝛾4ℏ2𝜂𝜂𝑁𝑁 0 5𝑘𝑘𝐵𝐵𝑇𝑇
Here 𝑁𝑁0 is the number density of water molecules and 𝜂𝜂 is the viscosity of the fluid. In pure water
at 20° C, this corresponds to 1
𝑇𝑇1 = .1 𝑠𝑠
−1. This implies that the majority of the longitudinal magnetic
relaxation for a proton in pure water comes from the partner proton bound to the same water molecule. Combining the two relaxation rates, the predicted 𝑇𝑇1 for pure water comes to 3.4 seconds, which corresponds well with experimental values 13.
1.6.2 Relaxation from interaction with paramagnetic molecules
The quantitative model for the combined relaxation enhancement from a paramagnetic center is described by the Solomon-Bloembergen-Morgan (SBM) equations 12.
1 𝑇𝑇1 =
𝑃𝑃𝑀𝑀𝑞𝑞 𝑇𝑇1𝑀𝑀+𝜏𝜏𝑀𝑀
Here 𝑇𝑇1𝑀𝑀 is the relaxation rate of water molecules bound to a site near the metal ion, 𝜏𝜏𝑀𝑀 is the
residence lifetime of water bound to a site near the metal ion, 𝑃𝑃𝑀𝑀 is the mole fraction of metal ions, and q is the number of coordination sites for water per metal ion. The relaxation rate for coordinated water can be approximated by 1214:
1 𝑇𝑇1𝑀𝑀=
2 15�
𝛾𝛾𝐼𝐼2𝑔𝑔2𝑆𝑆(𝑆𝑆+ 1)β2 𝑟𝑟6 � �
7𝜏𝜏𝑐𝑐 1 +𝜔𝜔𝑠𝑠2𝜏𝜏𝑐𝑐2+
3𝜏𝜏𝑐𝑐 1 +𝜔𝜔𝐼𝐼2𝜏𝜏𝑐𝑐2�+
2
3𝑆𝑆(𝑆𝑆+ 1)� 𝐴𝐴 ℏ�
2
�1 +𝜏𝜏𝜔𝜔𝑍𝑍 𝑠𝑠2𝜏𝜏𝑐𝑐2�
1 𝜏𝜏𝑍𝑍 =
1 𝑇𝑇1𝑍𝑍+
1 𝜏𝜏𝑀𝑀
Here,𝛾𝛾𝐼𝐼 is the proton gyromagnetic ratio, g is the electronic g-factor, S is the total electron spin of the metal ion, 𝛽𝛽 is the Bohr magneton, r is the distance between the water-bound proton and the
metal ion, 𝜔𝜔𝑠𝑠 is the electronic Larmor precession frequency of the metal ion, 𝜔𝜔𝐼𝐼 is the proton Larmor
precession frequency, 𝐴𝐴
ℏ is the electron-nuclear hyperfine coupling constant, and 𝜏𝜏𝑐𝑐 is the correlation time of the magnetic field experienced by the water-bound proton given by:
1 𝜏𝜏𝑐𝑐 =
1 𝑇𝑇1𝑍𝑍+
1 𝜏𝜏𝑀𝑀+
1 𝜏𝜏𝑅𝑅
Here, 𝑇𝑇1𝑍𝑍 is the longitudinal relaxation time of the electron on the paramagnetic center and 𝜏𝜏𝑅𝑅 is the rotational tumbling time of the water-bound paramagnetic complex.
As with spin-lattice relaxation, we expect the maximum enhancement in longitudinal relaxation rate
(minimum 𝑇𝑇1) to occur when 1
The vast majority of 𝑇𝑇1 contrast agents are small molecules with paramagnetic metal centers like
gadolinium. As a result, the rate of molecular tumbling (1
𝜏𝜏𝑅𝑅) tends to dominate the correlation time,
with 𝜏𝜏𝑅𝑅 ≈.1 𝑛𝑛𝑠𝑠, 𝑇𝑇1𝑍𝑍 ≈ .54 ns, and 𝜏𝜏𝑀𝑀 ≈1 𝜇𝜇𝑠𝑠 at 20° C and in a 2 Tesla bias field 15, 16. Improved T1 agents with substantially increased molecular tumbling time have been developed that use protein macromolecules with paramagnetic metal centers as T1 agents. These agents have proven particularly effective for low-field MRI, where the low proton Larmor frequency requires 𝑇𝑇1 contrast agents with long correlation times 17, 18.
1.7 Transverse (𝑻𝑻𝟐𝟐) relaxation
Transverse relaxation is driven by a dephasing of the precession of the magnetic dipoles of an ensemble of water-bound protons. After perturbing an ensemble of these dipoles that reside in a homogeneous static field with a resonant 𝑩𝑩𝟏𝟏 field that tips the magentizations into the transverse plane, the dipoles will begin to precess in-phase with each other and will generate a macroscopic and measurable signal:
𝑆𝑆(𝑑𝑑) =𝑆𝑆0cos (𝜔𝜔0𝑑𝑑)
The coherence of precession of the dipoles will tend to decay overtime, with the expectation value for the transverse magnetization exponentially decaying to zero with the time constant 𝑇𝑇2. This decoherence is principally driven by inhomogeneities in the local field experienced by the different protons inside of a solution. Much like 𝑇𝑇1 relaxation, an ensemble of water molecules can decohere each other by providing a random perturbing field. It is worth noting at this point that while 𝑇𝑇1
relaxation. The rate of this 𝑇𝑇2 decay for pure water is given by the BPP equation for transverse relaxation 12:
1 𝑇𝑇2 =
3𝛾𝛾4ℏ
20𝑟𝑟6�3𝜏𝜏𝑐𝑐+
5𝜏𝜏𝑐𝑐 1 +𝜔𝜔02𝜏𝜏
𝑐𝑐2+
2𝜏𝜏𝑐𝑐 1 + 4𝜔𝜔02𝜏𝜏
𝑐𝑐2�
While BPP theory can be instructive for understanding 𝑇𝑇1 relaxation, it suffers from severely reduced
predictive power for 𝑇𝑇2 relaxation studies, where inhomogeneities and magnetic inclusions are a much stronger contributor to relaxation than dipolar couplings between protons. In order to analyze the effect of a heterogeneous magnetic environment on the coherence of the oscillation of the transverse magnetization of an ensemble of protons, it is instructive to return to the Bloch model. Immediately after a perturbing RF field (𝐵𝐵1) is applied to rotate the magnetization of an ensemble of dipoles into the transverse plane, the dipoles will precess at a rate that is proportional to the local field experienced by each proton. For the 𝑗𝑗𝑡𝑡ℎ proton in a solution:
𝜔𝜔𝑗𝑗(𝑑𝑑) =𝜔𝜔0+δ𝜔𝜔𝑗𝑗(𝑑𝑑)
Where 𝜔𝜔0 =𝛾𝛾𝐵𝐵0 is the proton Larmor frequency at the bias field 𝐵𝐵0 and δ𝜔𝜔𝑗𝑗 = 𝛾𝛾 δ𝐵𝐵𝑧𝑧(𝒓𝒓𝑗𝑗,𝑑𝑑) is the
change in Larmor precession frequency due to local inhomogeneities in the longitudinal field at the coordinates of the 𝑗𝑗𝑡𝑡ℎ proton. The complex signal generated by this ensemble is then:
𝑆𝑆(𝑑𝑑) =𝑆𝑆0Σ𝑗𝑗ei ∫ 𝜔𝜔𝑗𝑗�𝑡𝑡′�𝑑𝑑𝑡𝑡′
𝑡𝑡
0 =𝑆𝑆0𝑒𝑒𝑖𝑖𝜔𝜔0𝑡𝑡Σ𝑗𝑗𝑒𝑒𝑖𝑖 ∫ δ𝜔𝜔0𝑡𝑡 𝑗𝑗�𝑡𝑡′�𝑑𝑑𝑡𝑡′ =𝑆𝑆0𝐴𝐴(𝑑𝑑)𝑒𝑒𝑖𝑖𝜔𝜔0𝑡𝑡
In a reference frame rotating at the Larmor frequency, dipoles precess at 𝛿𝛿𝜔𝜔𝑗𝑗. This small variation
in precession frequency will, over time, reduce the summed signal of the precessing dipoles. The amplitude of the measured voltage in a receiver coil from the oscillating transverse magnetization of the ensemble of spins can then be calculated as:
Where
𝛿𝛿𝜙𝜙𝑗𝑗(𝑑𝑑) =� δ𝜔𝜔𝑗𝑗(𝑑𝑑′)𝑑𝑑𝑑𝑑′ 𝑡𝑡
0
= 𝛾𝛾 � δ𝐵𝐵�𝒓𝒓𝒋𝒋(𝑑𝑑′),𝑑𝑑′�𝑑𝑑𝑑𝑑′ 𝑡𝑡
0
In the following sections, we will discuss a few examples of field perturbations and the mechanism through which they decohere precessing protons.
The signal that an ensemble of water molecules will produce immediately after being perturbed from
equilibrium by a 𝜋𝜋
2 pulse is referred to as the free induction decay (FID). The Fourier transform of this FID will recover the spectral density 𝑃𝑃(𝜔𝜔) which will, in general, be a Lorentzian centered on 𝜔𝜔0 with a linewidth dictated by the heterogeneity of the magnetic environment experienced by
protons in the ensemble. The finite width of the distribution of Larmor frequencies will cause the amplitude of the oscillating transverse magnetization to exponentially decay to zero with a time constant 𝑇𝑇2∗.
In the limiting condition where the protons are static and the perturbing field 𝛿𝛿𝐵𝐵𝑗𝑗 is not time
dependent, the dephased signal can be perfectly recovered into an “echo” by applying a resonant RF pulse in the transverse plane that rotates the magnetic dipoles by 𝜋𝜋 radians. For a simple model of
why such a pulse would be effective, we return to our rotating reference frame. If a 𝜋𝜋
2 pulse is applied to excite an ensemble of dipoles into the transverse plane, then after waiting time 𝜏𝜏𝑐𝑐𝑐𝑐, the phase
accumulation of the 𝑗𝑗𝑡𝑡ℎ dipole in the rotating reference frame will be: 𝛿𝛿𝜙𝜙𝑗𝑗�𝜏𝜏𝑐𝑐𝑐𝑐�=𝛾𝛾 ⋅ δBj⋅ 𝜏𝜏𝑐𝑐𝑐𝑐
𝛿𝛿𝜙𝜙𝑗𝑗 = −𝛾𝛾 ⋅ δBj⋅ 𝜏𝜏𝑐𝑐𝑐𝑐
As the magnetic field and position of all protons is constant, after another waiting time 𝜏𝜏𝑐𝑐𝑐𝑐, the net
phase accumulation of all dipoles will be zero in the rotating frame, resulting in a signal maximum in the lab frame. This simple case fails to account for the realities of biological tissue, where the diffusion of water causes a substantial time dependence for the local field experienced by a given proton. Accounting for this motion, the signal of an echo of an ensemble of spins is:
𝐴𝐴�2𝜏𝜏𝑐𝑐𝑐𝑐�= Σ𝑗𝑗cos (𝛿𝛿𝜙𝜙𝑗𝑗(2𝜏𝜏𝑐𝑐𝑐𝑐))
𝛿𝛿𝜙𝜙𝑗𝑗�2𝜏𝜏𝑐𝑐𝑐𝑐�=−𝛾𝛾 � δ𝐵𝐵�𝒓𝒓𝒋𝒋(𝑑𝑑′),𝑑𝑑′�𝑑𝑑𝑑𝑑′ 𝜏𝜏𝑐𝑐𝑐𝑐
0
+𝛾𝛾 � δ𝐵𝐵�𝒓𝒓𝒋𝒋(𝑑𝑑′),𝑑𝑑′�𝑑𝑑𝑑𝑑′ 2𝜏𝜏𝑐𝑐𝑐𝑐
𝜏𝜏𝑐𝑐𝑐𝑐
Though the spin echo can mitigate the effect of static magnetic perturbations, it is unable to fully negate the effect of dynamic magnetic perturbations such as those experienced by protons diffusing past magnetic inclusions in tissue. As a result, the signal of echoes from repeated refocusing 𝜋𝜋 pulses will exponentially decay over time with a time constant 𝑇𝑇2. It is worth noting that in biological samples this time constant will differ significantly from the intrinsic 𝑇𝑇2 predicted by BPP theory and, as will be discussed in the next section, can also have a strong dependence on experimental parameters. While this model for relaxation is quite simple, it has great predictive power for relaxation in a variety of biologically relevant magnetic environments.
1.7.1 Diffusion and relaxation near strong magnetic sources
perturbation to the magnetic field in tissue. As the vast majority of nanoparticles used in MRI are approximately spherical, their contribution to the local longitudinal magnetic field can be calculated using the point dipole equation:
𝐵𝐵𝑧𝑧 =4𝜋𝜋 ⋅ �𝜇𝜇0 3(𝒓𝒓 ⋅ 𝒛𝒛�)(𝒎𝒎 ⋅ 𝒓𝒓)𝑟𝑟5 −𝒎𝒎 ⋅ 𝒛𝒛�𝑟𝑟3 �
Here 𝒎𝒎 is the magnetic moment vector of the nanoparticle and 𝒓𝒓 is the displacement vector from the center of the nanoparticle.
If precessing water-bound protons were to remain static in a solution with magnetic nanoparticles, the magnetic field perturbation from the nanoparticles would induce strong 𝑇𝑇2∗ relaxation. The rate of relaxation in this situation can be calculated as: 19
1
𝑇𝑇2∗ =𝜋𝜋√15𝑣𝑣Δ𝜔𝜔𝑟𝑟9
Here 𝜈𝜈 is the volume fraction of nanoparticles in solution and Δ𝜔𝜔𝑟𝑟 is the rms shift in the angular Larmor frequency at the nanoparticle surface, which is a constant for a given material (Δ𝜔𝜔𝑟𝑟 ≈3⋅ 107𝑟𝑟𝑎𝑎𝑑𝑑/𝑠𝑠 for the commonly used magnetite nanoparticles). This prediction for 𝑇𝑇
2∗ relaxation is valid in the Static Dephasing Regime (SDR) where the motion of water is sufficiently slow. That is, the
characteristic time for diffusion of water past the source 𝜏𝜏𝐷𝐷 = 𝐷𝐷
𝑅𝑅2 is much greater than
1
Δ𝜔𝜔𝑟𝑟. Here 𝐷𝐷
is the diffusion constant for water and 𝑅𝑅 is the radius of the magnetic source 20.
In the opposite extreme, the motion of water molecules is rapid compared to the size of the magnetic source or the strength of the magnetic source is small (Δ𝜔𝜔𝑟𝑟𝜏𝜏𝐷𝐷 ≪1 ). This “motional-averaging regime” is well characterized by classical outer sphere theory provided that 𝜏𝜏𝑐𝑐𝑐𝑐≫ 𝜏𝜏𝐷𝐷.
1 𝑇𝑇2∗ ≈
1 𝑇𝑇2 ≈
4
9𝜈𝜈𝜏𝜏𝐷𝐷(Δ𝜔𝜔𝑟𝑟)2
The phase dispersion of water near magnetic sources can also be controlled by limiting the time between refocusing pulses. If 𝜏𝜏𝑐𝑐𝑐𝑐 ≪ 𝜏𝜏𝐷𝐷, the water molecules only move a short distance between
refocusing pulses, and the effect of the magnetic inhomogeneity is reduced. In this echo-limited regime, the 𝑇𝑇2 time can be approximated as
1
𝑇𝑇2 ≈2.25𝜈𝜈(Δ𝜔𝜔) 2�𝜏𝜏𝑐𝑐𝑐𝑐2
𝜏𝜏𝐷𝐷�
While these analytical approximates are instructive for the relaxation of solutions of spherical, monodisperse, and weakly-magnetized particles, computational techniques are required to predict transverse relaxation in more biologically relevant environments 22, 23. The analytical models are nonetheless instructive for highlighting the sensitivity of MRI contrast to microscale features 24. This insight has profound and wide-ranging applicability from the development of contrast agents that dynamically change their spatial frequency (and thus their level of induced contrast) in response to a molecular signal 25 to improving the diagnostic efficacy of MRI for conditions that change the distribution of magnetic material in tissue 26.
1.8 Diffusion Weighted MRI
voxel using strong magnetic field gradients. To see how this is possible, we can return to our model for transverse relaxation.
We choose to apply a magnetic field gradient to an ensemble of nuclear spins in the transverse plane such that:
𝐵𝐵𝑧𝑧(𝑥𝑥) =𝐵𝐵0+𝛿𝛿𝐵𝐵𝑧𝑧(𝑥𝑥) =𝐵𝐵0+𝐺𝐺 ∗ 𝑥𝑥
Here, 𝐵𝐵𝑧𝑧 is the total longitudinal field as a function of the x coordinate, 𝐵𝐵0 is the local bias field, and 𝛿𝛿𝐵𝐵𝑧𝑧(𝑥𝑥) is a linear applied magnetic field gradient with slope 𝐺𝐺. If we leave the gradient applied for
a short time 𝑑𝑑𝐺𝐺, then the phase accumulated for nuclear spins in the sample will be:
𝛿𝛿𝜙𝜙𝑗𝑗�𝑥𝑥𝑗𝑗�= � δ𝜔𝜔(𝑑𝑑′)𝑑𝑑𝑑𝑑′ 𝑡𝑡𝐺𝐺
0
=𝛾𝛾𝛾𝛾 ∗ 𝑥𝑥𝑗𝑗(0)∗ 𝑑𝑑𝐺𝐺
Here, 𝑥𝑥𝑗𝑗(0) is the x coordinate of the 𝑗𝑗𝑡𝑡ℎ nuclear spin at the time the gradient is applied. We turn the
gradient off after 𝑑𝑑𝐺𝐺 and after a waiting time Δ apply the negative of the initial field gradient such that:
𝐵𝐵𝑧𝑧(𝑥𝑥) =𝐵𝐵0+𝛿𝛿𝐵𝐵𝑧𝑧(𝑥𝑥) =𝐵𝐵0− 𝐺𝐺 ∗ 𝑥𝑥
Leaving this new second gradient on for time 𝑑𝑑𝐺𝐺, the total phase accumulated by the 𝑗𝑗𝑡𝑡ℎ proton will then be:
𝛿𝛿𝜙𝜙𝑗𝑗(𝑥𝑥) = � δ𝜔𝜔(𝑑𝑑′)𝑑𝑑𝑑𝑑′ 2𝑡𝑡𝐺𝐺+Δ
0
=𝛾𝛾𝛾𝛾 ∗ 𝑑𝑑𝐺𝐺∗ �𝑥𝑥𝑗𝑗(0)− 𝑥𝑥𝑗𝑗(Δ)�= 𝛾𝛾𝐺𝐺𝑑𝑑𝐺𝐺𝛿𝛿𝑥𝑥𝑗𝑗
where 𝛿𝛿𝑥𝑥𝑗𝑗 is the change in the x coordinate of the 𝑗𝑗𝑡𝑡ℎ proton. Thus, the motion of water in the sample
�|𝛿𝛿𝑥𝑥𝑗𝑗(Δ)|�= √2𝐷𝐷Δ
Thus, a more diffusive environment will increase dephasing and reduce signal intensity. Quantitatively,
𝑆𝑆= 𝑆𝑆0𝑒𝑒−𝑏𝑏𝐷𝐷
Here 𝑏𝑏= 𝛾𝛾2𝐺𝐺2𝑑𝑑𝐺𝐺2(Δ −𝑡𝑡𝐺𝐺
3) is the so-called “b-value” coined by Stejskal and Tanner 29.
Bibliography
1. Glover, G.H. Overview of functional magnetic resonance imaging. Neurosurg Clin N Am22, 133-vii (2011).
2. Hernando, D., Levin, Y.S., Sirlin, C.B. & Reeder, S.B. Quantification of liver iron with MRI: state of the art and remaining challenges. J Magn Reson Imaging40, 1003-1021 (2014).
3. Le Bihan, D. & Johansen-Berg, H. Diffusion MRI at 25: exploring brain tissue structure and function. Neuroimage61, 324-341 (2012).
4. Alexander, A.L., Lee, J.E., Lazar, M. & Field, A.S. Diffusion tensor imaging of the brain. Neurotherapeutics4, 316-329 (2007).
5. Mukherjee, A., Davis, H.C., Ramesh, P., Lu, G.J. & Shapiro, M.G. Biomolecular MRI reporters: Evolution of new mechanisms. Progress in Nuclear Magnetic Resonance Spectroscopy102-103, 32-42 (2017).
6. Piraner, D.I. et al. Going Deeper: Biomolecular Tools for Acoustic and Magnetic Imaging and Control of Cellular Function. Biochemistry56, 5202-5209 (2017).
7. Feynman, R.P., Vernon, F.L. & Hellwarth, R.W. Geometrical Representation of the Schrödinger Equation for Solving Maser Problems. Journal of Applied Physics28, 49-52 (1957).
8. Bloch, F. Nuclear induction. Physical review70, 460 (1946).
9. Griffiths, D.J. Introduction to Electrodynamics. (Pearson Education, 2014).
10. Torrey, H.C. Bloch Equations with Diffusion Terms. Physical Review104, 563-565 (1956). 11. Ma, D. et al. Magnetic resonance fingerprinting. Nature495, 187-192 (2013).
12. Bloembergen, N. Proton Relaxation Times in Paramagnetic Solutions. The Journal of Chemical Physics27, 572-573 (1957).
13. Krynicki, K. Proton spin-lattice relaxation in pure water between 0°C and 100°C. Physica32, 167-178 (1966).
14. Lauffer, R.B. Paramagnetic metal complexes as water proton relaxation agents for NMR imaging: theory and design. Chemical Reviews87, 901-927 (1987).
15. Belorizky, E. & Fries, P.H. Simple analytical approximation of the longitudinal electronic relaxation rate of Gd(iii) complexes in solutions. Physical Chemistry Chemical Physics6, 2341-2351 (2004).
16. Caravan, P., Farrar, C.T., Frullano, L. & Uppal, R. Influence of molecular parameters and increasing magnetic field strength on relaxivity of gadolinium- and manganese-based T1 contrast agents. Contrast Media Mol Imaging4, 89-100 (2009).
17. Lelyveld, V.S., Brustad, E., Arnold, F.H. & Jasanoff, A. Metal-Substituted Protein MRI Contrast Agents Engineered for Enhanced Relaxivity and Ligand Sensitivity. Journal of the American Chemical Society133, 649-651 (2011).
18. Shapiro, M.G. et al. Directed evolution of a magnetic resonance imaging contrast agent for noninvasive imaging of dopamine. Nat Biotechnol28, 264-270 (2010).
19. Vuong, Q.L., Berret, J.-F., Fresnais, J., Gossuin, Y. & Sandre, O. A Universal Scaling Law to Predict the Efficiency of Magnetic Nanoparticles as MRI T2-Contrast Agents. Advanced Healthcare Materials1, 502-512 (2012).
20. Gillis, P., Moiny, F. & Brooks, R.A. On T2-shortening by strongly magnetized spheres: A partial refocusing model. Magnetic Resonance in Medicine47, 257-263 (2002).
22. Novikov, D.S. & Kiselev, V.G. Transverse NMR relaxation in magnetically heterogeneous media. Journal of Magnetic Resonance195, 33-39 (2008).
23. Matsumoto, Y. & Jasanoff, A. T2 relaxation induced by clusters of superparamagnetic nanoparticles: Monte Carlo simulations. Magnetic resonance imaging26, 994-998 (2008). 24. Vuong, Q.L., Gillis, P. & Gossuin, Y. Monte Carlo simulation and theory of proton NMR transverse
relaxation induced by aggregation of magnetic particles used as MRI contrast agents. Journal of Magnetic Resonance212, 139-148 (2011).
25. Sosnovik, D.E. & Weissleder, R. Emerging concepts in molecular MRI. Current Opinion in Biotechnology18, 4-10 (2007).
26. Ghugre, N.R. & Wood, J.C. Relaxivity-iron calibration in hepatic iron overload: Probing underlying biophysical mechanisms using a Monte Carlo model. Magnetic Resonance in Medicine65, 837-847 (2011).
27. O'Donnell, L.J. & Westin, C.-F. An introduction to diffusion tensor image analysis. Neurosurg Clin N Am22, 185-viii (2011).
28. Mukherjee, A., Wu, D., Davis, H.C. & Shapiro, M.G. Non-invasive imaging using reporter genes altering cellular water permeability. Nature Communications7, 13891 (2016).
29. Stejskal, E.O. & Tanner, J.E. Spin Diffusion Measurements: Spin Echoes in the Presence of a Time-Dependent Field Gradient. The Journal of Chemical Physics42, 288-292 (1965).
C h a p t e r 2
SOME RANDOM WALKS IN COMPUTATIONAL MRI
2.1 Introduction
The clear advantages of MRI for biological imaging include its penetration depth, noninvasiveness, and strong endogenous anatomical contrast. However, the murky and multifactorial origins of MRI contrast limit the applicability of even the most complex analytical models. In order to accelerate the development of molecular reporters for MRI that operate on cellular length scales, we developed an in silico platform to simulate the effect of genetic perturbations to target cells on the magnetic relaxation of surrounding water molecules.
Our first application of this platform helped us understand the mechanism of contrast for the diffusion MRI reporter gene aquaporin, which enhances water mobility by increasing the water permeability of the plasma membrane. In addition to providing key insights to the physical mechanism of contrast for this reporter gene, the simulations in this study helped us optimize the pulse-sequence parameters to maximize contrast over background tissue. The first section of this chapter is an adapted excerpt from our publication on the study1, focusing on the physical model and simulations.
not produce significant contrast according to classical outer-sphere relaxation theory. We were nonetheless able to account for the physical mechanism behind the observed transverse relaxation enhancement using a Monte Carlo simulation that simultaneously modeled the restricted diffusion and magnetic relaxation of water molecules in and around cells expressing UPMAG.
2.2 Non-invasive imaging using aquaporin
Adapted from: A . Mukherjee, D. Wu, H.C. Davis, M.G. Shapiro (2016). "Non-invasive imaging using reporter genes altering cellular water permeability." Nature Communications 7(1): 13891.
Metal-based reporters can be hindered by metal ion bioavailability and toxicity33-37, while CEST reporters tend to require high expression levels to achieve observable contrast8, 23, 24, 32. Hence, a major need exists for new MRI reporter genes that do not require metals and can be detected at low levels of expression.
to the best of our knowledge, aquaporins have not hitherto been described as MRI reporter genes. In this work, we introduce human aquaporin 1 (AQP1) as a new genetically encoded reporter for diffusion weighted MRI. This reporter gene requires no metals, is nontoxic in a wide range of cells, produces contrast orthogonal to paramagnetic and CEST reporters and is detectable when expressed at low levels and in small subsets of cells. We characterize the imaging performance and mechanisms of AQP1 through live cell experiments and Monte Carlo models and demonstrate its utility by imaging tumor gene expression in vivo.
2.2.1 Physical Model and simulation of DWI contrast
A key parameter in diffusion weighted pulse sequences is the effective diffusion time, Δeff,
corresponding to the time interval between dephasing and rephasing gradient pulses38, 39, 45, 46, 48, 58. Long Δeff times are important for probing the effects of water exchange between
intracellular and extracellular pools because longer times allow a larger proportion of cytoplasmic molecules to interact with the cell membrane and experience the effects of restriction and exchange38, 39, 48, 51. In order to simulate the effects of the effects of this restricted diffusion on MRI signal, we developed a model for restricted water diffusion and exchange in cells, building on the previously described Karger and Szafer48, 51, 59 models of tissue water diffusion. We modeled our experimental cell pellets as a face-centered cubic lattice packed with 108 spherical cells with water molecules distributed randomly throughout the lattice at t = 0. Cell radii were sampled from a normal distribution with a mean of 6.8 μm and a standard deviation of 1.2 μm. We set the simulation time step τ = 50 μs and at each
𝑁𝑁�𝜋𝜋/2 √2𝐷𝐷𝜏𝜏 in each direction. Here, N is sampled from a random normal distribution and
D is the free diffusion coefficient of water at 12.9°C (the bore temperature of our MRI scanner) in the intracellular compartment (554.7 μm2/s) or in the extracellular space (1664.2 μm2/s)60. If a water molecule encounters a membrane, the propagation step is recalculated
and the molecule either transmitted or reflected off the membrane with a probability given
by 1−4𝑃𝑃 �𝜏𝜏/6𝐷𝐷, wherein P is the membrane permeability and D is the free diffusion
coefficient of water in the intracellular compartment. Diffusion paths were simulated in Python and the apparent diffusion coefficient (ADC) was calculated using Matlab as
described in the Szafer model48: 𝐴𝐴𝐷𝐷𝛾𝛾(∆) = − lim 𝑞𝑞→0+
𝑙𝑙𝑍𝑍<𝑍𝑍−𝑞𝑞∑ 𝑥𝑥
2 2 >
𝑞𝑞∆ where ∑ 𝑥𝑥2 represents the sum square displacement of a water molecule from its starting position and q is given
by (𝛾𝛾𝛿𝛿𝑔𝑔)2 where γ is the gyromagnetic ratio, g is the gradient strength and δ is the duration of the pulsed diffusion gradient. We note that b-value is calculated as: 𝑏𝑏=𝑞𝑞. (∆ − 𝛿𝛿/3). In the first set of simulations (ADC vs. permeability), we varied the cell permeability from .034 to 0.39 μm/s and calculated ADC(Δ) for each value of cell permeability. In the second set of
simulations (ADC vs. fraction of expressing cells) the permeability of AQP1-expressing cells and control cells were fixed at 0.14 μm/s and 0.039 μm/s respectively, in
accordance with previously published values55. We incrementally varied the fraction of cells expressing AQP1 and for each composition, simulated 3 x 10⁴ (nonunique) random arrangements of AQP1 expressing and control cells to exclude geometry or arrangement dependent bias in the results. ADC(Δ) was estimated corresponding to varying fractions of
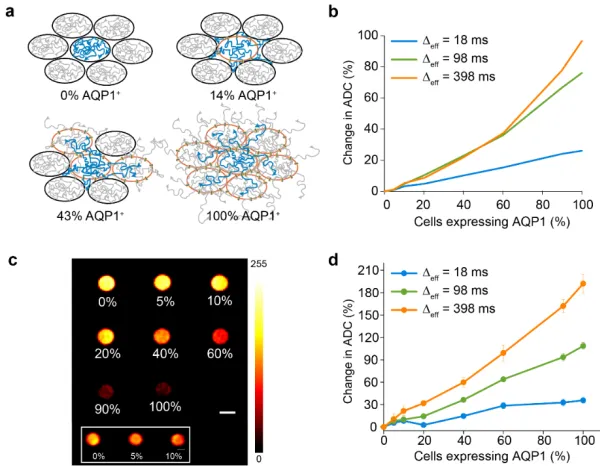
Our Monte Carlo simulations of a packed cellular lattice suggested that the effects of an aquaporin-mediated increase in water diffusion would be most pronounced at Δeff > 100 ms (Figure 2.1). To access these longer diffusion times, we used a stimulated echo DWI sequence, in which net magnetization is stored along the longitudinal axis in the interval between the diffusion gradients, and is thereby limited by T1 relaxation, rather than the typically shorter T2 relaxation limit of the more widely used spin echo DWI46, 58, 61. Pellets of AQP1-expressing cells appeared much darker in diffusion-weighted images than GFP controls (Figure 2.2a), corresponding to dramatic increases in their apparent diffusion coefficients. We found that the relative increase in ADC is more pronounced at Δeff = 398 ms compared to Δeff = 18 ms (Figure 2.2b), consistent with AQP1 expression facilitating the
[image:37.612.115.534.408.528.2]exchange of water across the cell membrane.
Figure 2.1 Monte Carlo simulations of water diffusion in AQP1+ and GFP+ (control) cells as a
function of cell membrane permeability (Pmem), effective diffusion time (Δeff), and percentage of
-expressing control cells are assigned a basal permeability 0.035 μm/s in accordance with literature values55.
2.2.2 Dynamic range of AQP1
2.2.3 Contrast from AQP1 within a mixed population
[image:39.612.117.529.113.213.2]The ability to specifically detect small numbers of genetically labeled cells in a population of unlabeled cells would enable the use of genetically encoded reporters in applications such as in vivo tracking of cell based therapeutics18, 62, 63. Having shown that AQP1 can appreciably increase water diffusion even at low levels of expression (Figure 2.2), we tested whether apparent water diffusion could be significantly increased if AQP1 expression was restricted to a small subset of cells in a mixed population. In general, the relationship between expressing fraction and ADC is expected to be nonlinear, since in small-fraction scenarios, cells expressing AQP1 would be surrounded mostly by cells without enhanced water permeability, and the impact of AQP1 expression would therefore be diminished (Figure 2.3a). However, our Monte Carlo simulations predicted that even in this scenario, expressing
fractions as small as 10% could be sufficient to increase the overall ADC in heterogeneous cell populations, particularly at long Δeff times (Figures 2.3b, 2.1c). To verify this
experimentally, we measured ADC in mixed populations comprising AQP1 expressing CHO cells and GFP expressing control cells in varying proportions. Strikingly, diffusion measurements revealed a significant increase in ADC in cell populations comprising 10% AQP1 expressing cells (21.44 ± 5.21% relative to GFP expressing cells, measured at Δeff =
2.3 Transverse relaxation from ultraparamagnetic cells
Adapted from: P. Ramesh, S.-J. Hwang, H. C. Davis, et al. (2018). “Ultraparamagnetic cells formed through intracellular oxidation and chelation of paramagnetic iron.” Angew. Chem. Int. Ed. , 57, 12385.
[image:41.612.174.474.111.344.2]Inspired by magnetotactic bacteria, chemical and synthetic biologists have attempted to impart ferromagnetism or superparamagnetism onto non-magnetic microbial and eukaryotic cell types to enable their localization and isolation from complex samples using magnetic
fields and visualization with magnetic resonance imaging (MRI)[1–4]. Such capabilities would facilitate, for example, the study of commensal and pathogenic microbes inside mammalian hosts and the development of magnetically engineered microbial diagnostic and therapeutic agents[5,6]. However, because of the stringent pH, iron concentrations and redox potentials required for the synthesis of magnetosomal magnetite and other forms of superparamagnetic or ferromagnetic iron oxides, attempts to engineer the formation of these minerals in natively non-magnetic species such as E. coli have had limited success[7–11].
Here, we introduce an alternative paradigm for producing magnetic cells that is focused on maximizing cellular paramagnetism rather than forming superparamagnetic or ferromagnetic deposits. This approach arises from the recognition that many applications of magnetic cells, including MRI and cellular separation, involve multi-Tesla magnetic fields, in which sufficiently paramagnetic cells would be expected to act as microscale magnets, capable of producing MRI contrast and experiencing magnetic gradient forces for localization and separation (Fig. 2.4a)[12,13]. With such “ultraparamagnetism” as the stated goal, ferritin – the main iron storage protein in most cells and the focal point of previous efforts in magnetic cell engineering – represents a relatively poor iron host because most of the electron spins in its ferrihydrite core are cancelled by antiferromagnetic partners, such that its net paramagnetic moment equates to only ~5% of the available spin at 37 ºC [14,15].
ferritin-overexpressing controls. This allows these cells to be localized via magnetic field gradients, visualized with MRI, and isolated from complex biological samples.
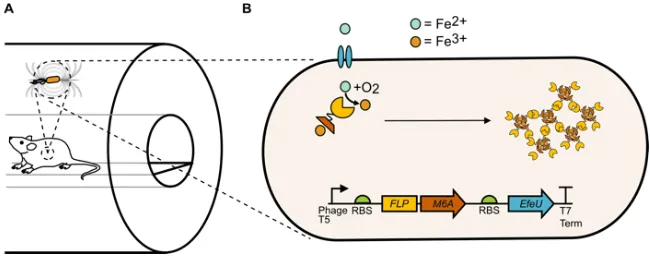
Figure 2.4 Ultraparamagnetic gene circuit. a Paramagnetic cells produce magnetic fields and experience force when placed inside a strong magnetic field, such as in an MRI scanner. b UPMAG gene circuit, comprising a ferroxidase (FLP) fused to a magnetite nucleating peptide (M6A), and a ferrous iron transporter (EfeU). The circuit is driven using an IPTG-inducible T5 phage promoter. The ferrous iron transporter increases the intracellular iron content available to FLPM6A. FLPM6A then forms macromolecular assemblies with oxidized iron.
2.3.1 Design of the genetic construct
FLP oxidizes iron to Fe3+,M6A would bind any available ferrous iron as well as oxidized ferric iron and promote the nucleation of small iron oxide minerals[20], stabilized by multiple M6A binding interactions (Fig. 2.4 b). We predicted that this iron would remain in a loosely ordered, strongly paramagnetic state. As control constructs, we generated E. coli overexpressing bacterioferritin (BFR) or fluorescent proteins (FP: mRuby2 or eGFP). BFR was chosen as our standard for comparison based on its previous use as a genetically encoded contrast agent for MRI [21]. All vectors also included the iron transporter EfeU from E. coli Nissle 1917 to facilitate the uptake of ferrous iron from the growth medium. These constructs were expressed in a model strain of E. coli (BL21 DE3) with no additional alterations to endogenous iron-handling genes. The complete genetic circuit consisting of FLPM6A and EfeU is hereafter referred to as UPMAG, for UltraParaMagnetic Genes.
2.3.2 Experimental Results
To assess whether the cellular paramagnetism conferred by UPMAG could be used for noninvasive cellular imaging in addition to magnetic actuation, we imaged cells expressing this construct with MRI. When imaged in agarose phantoms at 7 Tesla, UPMAG cells produced T2 contrast relative to both background and controls at densities as low as 1 × 10¹⁰, colony forming units (cfu) per ml, corresponding to a cellular volume fraction of
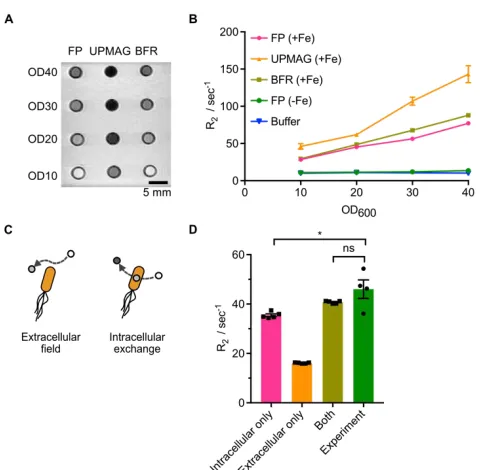
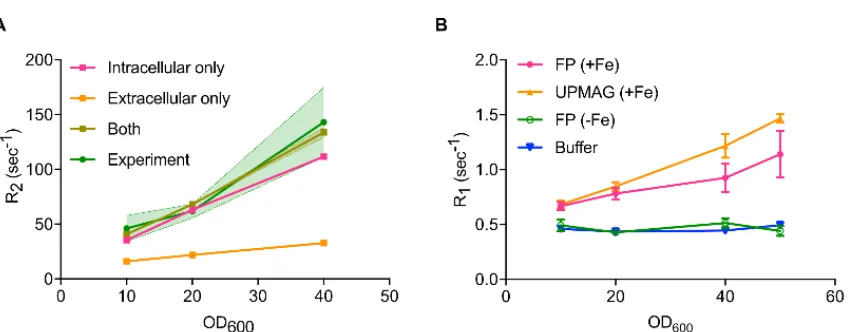
Figure 2.5 UPMAG cells produce enhanced MRI contrast. a A T2 weighted image of E.coli in an agarose phantom, acquired at 7 Tesla using a spin echo sequence with TR = 2500 ms and TE = 11 ms.
b R2 vs. OD600 for E.coli expressing either UPMAG or controls in a Bruker 500 MHz NMR spectrometer with a spin echo sequence and TE = 0.5 ms. (c) Schematic of two potential mechanisms of T2 contrast, one in which water relaxes due to extracellular outer-sphere dipole relaxation, and a second in which water relaxes via diffusional exchange into the intracellular compartment. d Monte Carlo simulation results for cells at OD600 = 10, in comparison with experimental data.
Quantitative NMR measurements at 11.7 Tesla showed that solutions of E. coli expressing UPMAG had 70% faster relaxation rates compared to controls at cell optical
density OD10 (Fig. 2.5b), with a cellular T2 relaxivity of approximately 3.4 sec−1 OD600, or
equivalently a per-iron relaxivity of 20.7 mM−1sec−1, as determined by linear fit. Monte Carlo simulations of water diffusion and spin precession in media containing ultraparamagnetic bacteria further revealed that most of the observed T2 relaxation enhancement can be explained by diffusional water exchange between the bulk and the
Nuclear spin relaxation was simulated for by randomly distributing spherical E. coli cells with 𝜒𝜒𝑉𝑉 = + 4.68 ppm inside a 1000 μm3 cubic simulation volume using periodic boundary conditions. Cell radius was set to 0.65 μm to match previously reported equivalent cell volumes of E. coli [10]. The number of cells in the simulation volume was set to match the OD of our experimental data using the Agilent estimate of Ncells= OD600⋅V𝐸𝐸.𝑐𝑐𝑐𝑐𝑙𝑙𝑖𝑖⋅ 8 × 10¹¹, where V is the simulation volume in cubic meters. The magnetic moment of each
E. coli cell was calculated as m = χV⋅V⋅H where χ is the bulk magnetic susceptibility, V is the volume of the cell, and H is the bias field in the NMR spectrometer (11.7 Tesla). The magnetic field B in the extracellular space was explicitly calculated for each water molecule based on the sum contribution from each E. coli cell. 4032 water molecules were randomly assigned initial 3D spatial coordinates (𝐫𝐫= [𝑥𝑥,𝑦𝑦,𝑧𝑧]) in the simulation volume with phase ϕ(t0) = 0 and allowed to diffuse according to previously established cellular diffusion
models[8,9]. The phase in the rotating reference frame evolves according to δϕ(t) =−γ ∙ 𝐁𝐁(𝐫𝐫)∙ δt for water in the extracellular space, where 𝛾𝛾 is the proton gyromagnetic ratio and
𝐁𝐁 is the total magnetic field in the rotating reference frame as experienced by the water
molecules. For water in the intracellular space, phase evolves according to δϕ(t) = Δω ⋅ δt, where ∆𝜔𝜔 is the shift in the Larmor frequency due to the difference in intracellular bulk
magnetic susceptibility relative to external media. Re-focusing pulses were simulated by setting ϕ(t) =− ϕ(t− δt). Cell membranes were modeled as semi-permeable boundaries
with a permeability of 2 μm
ms , in accordance with previously measured values for E.coli
cells[11]. Intracellular and extracellular water diffusivity were set to 1 and 2 μm2
in accordance with previous studies of cellular diffusion and established values for water diffusivity at the temperature of our spectrometer bore (20 ℃). Bulk spin magnetization in the sample was calculated as M(t) =∑icos [ϕi(t)], where i is the index of simulated water molecules and the magnetic moment of a single molecule is normalized to 1. T2 values were extracted from each simulated sample with a mono-exponential fit to the first 10 echoes. Background relaxation from buffer was accounted for by multiplying all simulated exponential decays with a mono exponential decay whose rate constant was equal to the experimentally measured relaxation rate of pure buffer.
Bibliography
1. Mukherjee, A., Wu, D., Davis, H.C. & Shapiro, M.G. Non-invasive imaging using reporter genes altering cellular water permeability. Nature Communications7, 13891 (2016). 2. Ramesh, P. et al. Ultraparamagnetic Cells Formed through Intracellular Oxidation and
Chelation of Paramagnetic Iron. Angewandte Chemie International Edition57, 12385-12389 (2018).
3. Rao, J., Dragulescu-Andrasi, A. & Yao, H. Fluorescence imaging in vivo: recent advances. Current opinion in biotechnology18, 17-25 (2007).
4. Contag, C.H. & Bachmann, M.H. Advances in in vivo bioluminescence imaging of gene expression. Annual review of biomedical engineering4, 235-260 (2002).
5. Chudakov, D.M., Matz, M.V., Lukyanov, S. & Lukyanov, K.A. Fluorescent proteins and their applications in imaging living cells and tissues. Physiological reviews90, 1103-1163 (2010).
6. Weissleder, R. A clearer vision for in vivo imaging. Nature biotechnology19, 316-316 (2001).
7. Ntziachristos, V., Ripoll, J., Wang, L.V. & Weissleder, R. Looking and listening to light: the evolution of whole-body photonic imaging. Nat Biotech23, 313-320 (2005).
8. Bar-Shir, A. et al. Human protamine-1 as an MRI reporter gene based on chemical exchange. ACS chemical biology9, 134-138 (2013).
9. Louie, A.Y. et al. In vivo visualization of gene expression using magnetic resonance imaging. Nat Biotech18, 321-325 (2000).
10. Bar-Shir, A. et al. Transforming thymidine into a magnetic resonance imaging probe for monitoring gene expression. Journal of the American Chemical Society135, 1617-1624 (2013).
11. Zurkiya, O., Chan, A.W. & Hu, X. MagA is sufficient for producing magnetic nanoparticles in mammalian cells, making it an MRI reporter. Magnetic resonance in medicine59, 1225-1231 (2008).
12. Cohen, B., Dafni, H., Meir, G., Harmelin, A. & Neeman, M. Ferritin as an endogenous MRI reporter for noninvasive imaging of gene expression in C6 glioma tumors. Neoplasia7, 109-117 (2005).
13. Cohen, B. et al. MRI detection of transcriptional regulation of gene expression in transgenic mice. Nature medicine13, 498-503 (2007).
14. Patrick, P.S. et al. Dual-modality gene reporter for in vivo imaging. Proceedings of the National Academy of Sciences of the United States of America111, 415-420 (2014). 15. Patrick, P.S. et al. Development of Timd2 as a reporter gene for MRI. Magnetic
resonance in medicine (2015).
16. Matsumoto, Y., Chen, R., Anikeeva, P. & Jasanoff, A. Engineering intracellular
biomineralization and biosensing by a magnetic protein. Nature communications6, 8721 (2015).
17. Genove, G., DeMarco, U., Xu, H., Goins, W.F. & Ahrens, E.T. A new transgene reporter for in vivo magnetic resonance imaging. Nature medicine11, 450-454 (2005).
19. Deans, A.E. et al. Cellular MRI contrast via coexpression of transferrin receptor and ferritin. Magnetic resonance in medicine56, 51-59 (2006).
20. Bartelle, B.B., Mana, M.D., Suero-Abreu, G.A., Rodriguez, J.J. & Turnbull, D.H. Engineering an effective Mn-binding MRI reporter protein by subcellular targeting. Magnetic resonance in medicine74, 1750-1757 (2015).
21. Bartelle, B.B., Szulc, K.U., Suero-Abreu, G.A., Rodriguez, J.J. & Turnbull, D.H. Divalent metal transporter, DMT1: A novel MRI reporter protein. Magnetic resonance in medicine70, 842-850 (2013).
22. Westmeyer, G.G. & Jasanoff, A. Genetically controlled MRI contrast mechanisms and their prospects in systems neuroscience research. Magnetic resonance imaging25, 1004-1010 (2007).
23. Airan, R.D. et al. MRI biosensor for protein kinase A encoded by a single synthetic gene. Magnetic resonance in medicine68, 1919-1923 (2012).
24. Gilad, A.A. et al. Artificial reporter gene providing MRI contrast based on proton exchange. Nature biotechnology25, 217-219 (2007).
25. Gilad, A.A., Winnard, P.T., Van Zijl, P. & Bulte, J. Developing MR reporter genes: promises and pitfalls. NMR in biomedicine20, 275 (2007).
26. Gilad, A.A. et al. MRI reporter genes. Journal of nuclear medicine : official publication, Society of Nuclear Medicine49, 1905-1908 (2008).
27. Minn, I. et al. Tumor-specific expression and detection of a CEST reporter gene. Magnetic resonance in medicine74, 544-549 (2015).
28. Shapiro, M.G. et al. Genetically encoded reporters for hyperpolarized xenon magnetic resonance imaging. Nature chemistry6, 629-634 (2014).
29. Shapiro, M.G., Szablowski, J.O., Langer, R. & Jasanoff, A. Protein Nanoparticles Engineered to Sense Kinase Activity in MRI. Journal of the American Chemical Society
131, 2484-2486 (2009).
30. Shapiro, M.G. et al. Directed evolution of a magnetic resonance imaging contrast agent for noninvasive imaging of dopamine. Nature biotechnology28, 264-270 (2010). 31. Matsumoto, Y. & Jasanoff, A. Metalloprotein-based MRI probes. FEBS letters587,
1021-1029 (2013).
32. van Zijl, P. & Yadav, N.N. Chemical exchange saturation transfer (CEST): what is in a name and what isn't? Magnetic resonance in medicine65, 927-948 (2011).
33. Kim, J.-W., Kim, Y., Cheong, H. & Ito, K. Manganese induced parkinsonism. Journal of Korean medical science13, 437-439 (1998).
34. Caravan, P., Ellison, J.J., McMurry, T.J. & Lauffer, R.B. Gadolinium (III) chelates as MRI contrast agents: structure, dynamics, and applications. Chemical reviews99, 2293-2352 (1999).
35. Silva, A.C., Lee, J.H., Aoki, I. & Koretsky, A.P. Manganese-enhanced magnetic resonance imaging (MEMRI): methodological and practical considerations. NMR in biomedicine17, 532-543 (2004).
36. Cacheris, W.P., Quay, S.C. & Rocklage, S.M. The relationship between thermodynamics and the toxicity of gadolinium complexes. Magnetic resonance imaging8, 467-481 (1990).