Studying the Interrelationship amongst Various Barriers
in Adoption of BIM in Developing Countries using ISM
Methodology
Arnav Jain
Techture Structures PrivateLimited Nagpur, India
Remica Aggarwal
School of Business, University of Petroleum & Energy Studies,Dehradun, India
Veena Aggarwal
Recventures Education Services Private LimitedDelhi, India
ABSTRACT
Building Information Modelling is an emerging area of technology which deals with the process of creating and using design models for design, construction and operation of projects. However, it is still in its nascent stage in developing countries and suffers due to various barriers which hinder its development and adoption. Present research work deals with recognizing such barriers in adoption of BIM in developing countries like India and further studying the inter-relationships amongst them using ISM methodology.
Keywords
Interpretive Structural Modeling Methodology (ISM); Building Information Modeling (BIM); Architectural Engineering and Construction (AEC) industry
1.
INTRODUCTION
Building Information Modelling (BIM) is an emerging area of technology that is set to transform the way buildings are designed, constructed and ultimately managed. McGraw Hill regularly publishes smart market reports on Building Information Modelling which provides regular updates focused on benchmarking the adoption and value of BIM. “The Business Value of BIM” Report (2009)1
defines BIM as, “The process of creating and using digital models for design, construction and/or operations of projects.” The level and acceptance of BIM differs from country to country. For example, in US it is been made mandatory to large extent while in developing countries like India , despite being new , it is a highly acceptable concept . In a survey report , BIM is not only approachable for architectural and construction management firms who have a financial incentive to use it on their project but also expanded its domain to those who are rigorously involved in designing for Hi-Tech facilities which includes labs, healthcare, higher education as well as government facilities .
Despite its popularity at one end, it also faces a series of impediments. For example, a two phase survey based research is conducted by [1] to identify the drivers and barriers to BIM implementation and its fair adoption in India. Based on the interaction with industry professionals, it is found that use and implementation of BIM is still in its nascent stage despite displaying an upward trend in recent years. A qualitative survey is used by [2] to identify the various factors affecting the productivity of construction projects in Iran. In a similar research, [3] identify various barriers to implementation of BIM in scheduling and planning phase in Iran.
Next section explains some of the common barriers which BIM normally faces while being adopted by AEC firms in developing countries. Presents research identifies these barriers and apply Interpretive Structural
Modelling methodology (ISM) to recognize the interrelationship amongst these barriers.
The paper is arranged as follows. Section 2 presents the review of literature with respect to BIM adoption. Section 3 presents the ISM methodology and development of ISM model.
2.
LITERATURE REVIEW ON
VARIOUS BARRIERS TO BIM IN
DEVELOPING COUNTRIES
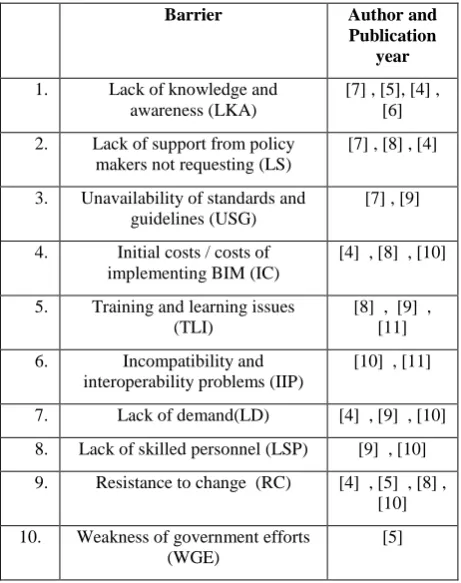
31 Table 1. Common barriers to BIM in developing countries
Barrier Author and
Publication year
1. Lack of knowledge and awareness (LKA)
[7] , [5], [4] , [6]
2. Lack of support from policy makers not requesting (LS)
[7] , [8] , [4]
3. Unavailability of standards and guidelines (USG)
[7] , [9]
4. Initial costs / costs of implementing BIM (IC)
[4] , [8] , [10]
5. Training and learning issues (TLI)
[8] , [9] , [11]
6. Incompatibility and interoperability problems (IIP)
[10] , [11]
7. Lack of demand(LD) [4] , [9] , [10]
8. Lack of skilled personnel (LSP) [9] , [10]
9. Resistance to change (RC) [4] , [5] , [8] , [10]
10. Weakness of government efforts (WGE)
[5]
3.
ISM METHODOLOGY
Suggested by [12] , the technique has been used widely to develop a map of the relationships between the many elements in the form of a hierarchy graph. Group’s judgement decides whether and how the items are related.
ISM works with the following steps:
1. Identification of elements, which are relevant to the decision maker’s problems and issues.
2. Establishing the contextual relationship between elements and with respect to which pairs of elements will be examine.
3. 3. A structural self-interaction matrix (SSIM) may be developed between two variables i.e. i and j. It establishes the “Lead to” relationship between criteria. Four symbols viz. V, A , X & O are used for establishing the relationships.
4. SSIM may be further used to develop an initial reachability matrix which has all values in binary form. Rule of transitivity is usually checked at this stage . After removing the transitivity, final reachability matrix will form.
5. Afterwards, the reachability set and antecedent set for each criterion and for each element can be obtained from the final reachability matrix .
6. After that a level partition matrix can be obtained based on establishing the precedence relationships and arranging the elements in a topological order.
7. A Mic-Mac analysis can be performed which categorize the variables as per the driving and dependence power in to autonomous, dependent, driver and linkage category.
8. Finally a diagraph can be obtained.
4.
Development of ISM model
In this section, ISM model is developed for studying the interrelationships amongst the various barriers to adoption of BIM in India. Ten important criteria are considered viz. Lack of knowledge and awareness (LKA) , Lack of support from policy makers not requesting (LS) , Unavailability of standards and guidelines (USG) , Initial costs / costs of implementing BIM (IC) , Training and learning issues (TLI) , Incompatibility and interoperability problems (IIP) , Lack of demand(LD) , Lack of skilled personnel (LSP) , Resistance to change (RC) , Weakness of government efforts (WGE).
4.1
Construction of Structural
Self-Interaction Matrix (SSIM)
This matrix gives the pair-wise relationship between two variables i.e. i and j based on VAXO.
Table 2. Structural self – interaction matrix
Barri ers
1 2 3 4 5 6 7 8 9 10
LK A
L S
US G
HI C
T LI
II P
L D
L SP
R C
W GE
LKA V A V V V V V V V
LS A A A V V V V V
USG V V V V V V X
HIC A A A A A A
TLI V V V V A
IIP V V V A
LD V V A
LSP V A
RC A
WGE
4.2
Construction of Initial reachability
matrix
The SSIM has been converted in to a binary matrix called the initial reachability matrix by substituting V, A, X, O by 1 or 0 as per the case. After incorporating the transitivity, the final reachability matrix is shown below in the table III.
Table 3. Initial reachability Matrix
Barriers 1 2 3 4 5 6 7 8 9 10 LK
A L S
US G
HI C
T LI
II P
L D
L SP
R C
W GE
LKA 1 1 0 1 1 1 1 1 1 1
LS 0 1 0 0 0 1 1 1 1 1
USG 1 1 1 1 1 1 1 1 1 1
HIC 0 1 0 0 0 0 0 0 0 0
TLI 0 1 0 0 1 1 1 1 1 0
IIP 0 0 0 0 1 0 1 1 1 0
LD 0 0 0 0 1 0 1 1 1 0
LSP 0 0 0 0 1 0 0 1 1 0
RC 0 0 0 0 1 0 0 0 1 0
4.3
Construction of final reachability
matrix
After removing the transitivity, final reachability matrix is obtained along with the driving power as well as dependence power . Based on driving power and dependencies, these factors may be classified in to four groups of autonomous, dependent, linkage and independent (driver) factors.
Table 4. Final reachability matrix
Barriers 1 2 3 4 5 6 7 8 9 10 D. P
L K A
L S
U S G
I C
T L I
I I P
L D
L S P
R C
W G E
1. LKA 1 1 0 1 1 1 1 1 1 1 9
2. LS 0 1 0 0 1 1 1 1 1 1 7
3. USG 1 1 1 1 1 1 1 1 1 1 10
4. IC 0 1 0 1 0 1 1 1 1 1 7
5. TLI 0 1 0 0 1 1 1 1 1 0 6
6. IIP 0 0 0 0 1 1 1 1 1 0 5
7. LD 0 0 0 0 1 0 1 1 1 0 4
8. LSP 0 0 0 0 1 0 0 1 1 0 3
9. RC 0 0 0 0 1 0 0 0 1 0 2
10 WGE 0 1 1 0 1 1 1 1 1 1 8
De .P. 2 6 2 3 9 7 8 9 10 5
4.4
Level Partition
From the final reachability matrix, reachability and final antecedent set for each factor are found. The element for which the reachability and intersection sets are same are the top-level element in the ISM hierarchy. After the identification of top level element, it is separated out from the other elements and the process continues for next level of elements. Reachability set, antecedent set, intersection set along with different level for elements have been shown below in table V to table XI.
Table 5. Iteration I
S.No. Reachabili ty set
Antecedent set
Intersect ion set
Iteration / Levels
1. 9 1,2,3,4,5,6,7,8 ,9,10
9
I 2. 5,8,9 1,2,3,5,6,7,8,9
,10
5,8,9
3. 5,7,8 1,2,3,5,6,7,10 5,7
4. 6,7,8,9 1,2,3,4,5,6,10 6
5. 6,7,2,10 1,2,3,4,10 2,10
6. 2,10,1 1,3 1
7. 2,10,3 3,10 3
8. 2,10, 4 1,3,4 4
9. 1,2,3,4,5,6, 7,8,9,10
3 3
10. 2,3,5,6,7,8, 9,10
3,10 3,10
11. 2,4,5,6,7,8, 9,10
[image:3.595.40.558.173.451.2]1,4 4
Table 6. Iteration II
S.N o.
Reachabili ty set
Antecedent set
Intersectio n set
Iteration/ Levels
2. 5,8 1,2,3,5,6,7,8, 10
5,8
II 3. 5,7,8 1,2,3,5,6,7,
10
5,7
4. 6,7,8 1,2,3,4,5,6,
10
6
5. 6,7,2,10 1,2,3,4,10 2,10
6. 2,10,1 1,3 1
7. 2,10,3 3,10 3
8. 2,10, 4 1,3,4 4
9. 1,2,3,4,5,6, 7,8,10
3 3
10. 2,3,5,6,7,8, 10
3,10 3,10
11. 2,4,5,6,7,8, 10
1,4 4
Table 7. Iteration III
S.No. Reachability set
Antecedent set
Intersection set
Iteration/ Levels
3. 7 1,2,3,6,7,10 7
III 4. 6,7 1,2,3,4,6,10 6
5. 6,7,2,10 1,2,3,4,10 2,10
6. 2,10,1 1,3 1
7. 2,10,3 3,10 3
8. 2,10, 4 1,3,4 4
9. 1,2,3,4,6,7,10 3 3
10. 2,3,6,7,10 3,10 3,10
11. 2,4,6,7,10 1,4 4
33 Table 8. Iteration IV
S.No. Reachabili ty set
Anteceden t set
Intersectio n set
Iteration / Levels
4. 6 1,2,3,4,6,1 0
6
IV 5. 6,2,10 1,2,3,4,10 2,10
6. 2,10,1 1,3 1
7. 2,10,3 3,10 3
8. 2,10, 4 1,3,4 4
9. 1,2,3,4,6, 10
3 3
10. 2,3,6,10 3,10 3,10
[image:4.595.47.298.73.726.2]11. 2,4,6,10 1,4 4
Table 9. Iteration V
S.No. Reachability set
Antecedent set
Intersection set
Iteration/ Levels
5. 2,10 1,2,3,4,10 2,10
V
6. 2,10,1 1,3 1
7. 2,10,3 3,10 3
8. 2,10, 4 1,3,4 4
9. 1,2,3,4,10 3 3
10. 2,3,10 3,10 3,10
11. 2,4,10 1,4 4
Table 10. Iteration VI
S.No .
Reachabilit y set
Anteceden t set
Intersectio n set
Iteration / Levels
6. 1 1,3 1
VI
7. 3 3 3
8. 4 1,3,4 4
9. 1,3,4 3 3
10. 3 3 3
11. 4 1,4 4
Table 11. Iteration VII
S.No .
Reachabilit y set
Anteceden t set
Intersectio n set
Iteration / Levels
6. 1 1,3 1
VII
7. 3 3 3
9. 1,3 3 3
[image:4.595.299.555.75.169.2]10. 3 3 3
Table 12. Iteration VIII
S.No. Reachability set
Antecedent set
Intersection set
Iteration/ Levels
7. 3 3 3
VIII
9. 3 3 3
10. 3 3 3
4.5
Classification of factors
[image:4.595.310.547.304.588.2]The critical success factors described earlier are classified in to four clusters viz. autonomous factor, dependent factors, linkage factors and independent factors (mentioned in Table 13 below). As it can be seen that there is no autonomous criteria . Criteria USG , LK , RGE and IC are drivers . Criteria such as LS and TLI are linkage criteria whereas IIP , LD , LSP and RC are dependent criteria.
Table 13 . Driving Power & Dominance Diagram
D
R
I
V
I
N
G
P
O
W
E
R 1 0
US G
9 LK
A
Linkage
8 Drivers W
G E
7 I
C
L S
6 TL
I
5 II
P
4 Autonomous L
D
Depende nt
3 LS
P
2 R
C
1
1 2 3 4 5 6 7 8 9 10
4.6
ISM The Diagraph
[image:5.595.123.224.121.360.2]The diagraph presenting the hierarchy of the various barriers is shown in figure below
Figure 4.5 : Diagraph for barriers to BIM in developing countries
5.
CONCLUSIONS
This study focuses on presenting the inter-relationship amongst the various barriers to implementation of BIM in developing countries with the help of Interpretive Structural Modeling methodology.
6.
ACKNOWLEDGEMENTS
Authors are thankful to Birla Institute of Technology & Science , Pilani for imparting the knowledge about Building Information Modeling and Prof. S.P Singh of IIT Delhi, India in disseminating the knowledge about ISM methodology which helped the authors substantially in preparing the manuscript.
7.
REFERENCES
[1] Sawhney, A. and Singhal, P. 2013. Drivers and Barriers to the Use of Building Information Modelling in India. International Journal of 3-D Information Modeling (IJ3DIM). 2(3), 46-63.
[2] Ghoddousi, P., & Hosseini, M. R. 2012. A survey of the factors affecting the productivity of construction projects in Iran. Technological and Economic Development of Economy. 18(1), 99-116.
[3] Kiani, I., Sadeghifam, A. N., Ghomi, S. K. and Marsono, A. K. B. 2015. Barriers to Implementation of Building Information Modeling in Scheduling and Planning Phase in Iran. Australian Journal of Basic and Applied Sciences . 9(5), 91-97.
[4] Matarneh , R.T. and Hamed , S. 2017. Barriers to adoption of building information modelling in the Jordanian Building industry , Open Journal of Civil Engineering . 07 (03) , 325-335
[5] Wadhah , A.H. , Abbas , M.A. and Nagham , N.A. 2018. Barriers of adoption building information modelling in construction projects of Iraq. Engineering Journal , 22(2). DOI: 10.4186/ej2018.22.2.59.
[6] Hosseni , M.R , Azari , E. , Tivendale , L. and Chileshe , N. (2016), Barriers to adoption of building information modelling in Iran : preliminary results. https://www.researchgate.net/publication/281209928_Ba rriers_to_adoption_of_building_information_modeling_ BIM_in_Iran_Preliminary_results .
[7] Zakaria, B. Z., Mohamed Ali, N., Tarmizi Haron, A., Marshall-Ponting, A.J. and Abd Hamid, Z. 2013, 'Exploring the adoption of Building Information modelling in the Malaysian construction industry.
usir.salford.ac.uk/30827/1/IJRET_110208060_FINAL.pdf
[8] Abubakar, M., Ibrahim, Y., Kado, D. and Bala, K. 2014. Contractors’ Perception of the Factors Affecting Building Information Modelling (BIM) Adoption in the Nigerian Construction Industry. Paper presented at the Computing in Civil and Building Engineering (2014), Orlando, Florida, United States.
[9] Chan, C. T. W. 2014. Barriers of Implementing BIM in Construction Industry from the Designers’ Perspective: A Hong Kong Experience. Journal of System and Management Sciences. 4(2), 24-40.
[10] Rogers, J., Heap-Yih, C., Preece, C., McCaffer, R. and Thomson, D. 2015. Adoption of Building Information Modelling technology (BIM): perspectives from Malaysian engineering consulting services firms. Engineering, Construction and Architectural Management. 22(4). Glendale, CA: Pyrczak Pub.
[11] Nanajkar, A. and Gao, Z. 2014. BIM Implementation Practices at India's AEC Firms. Paper presented at the International Conference on Construction and Real Estate Management, Kunming, China.
[12] Warfield, J., N. 1974. Developing interconnection matrices in structural modeling. IEEE Transactions on System, Man, and Cybernetics (SMC) .4 (1), 81-87.
LKA
WGE
LS
LSP IIP
LD
RC TLI