A Simplified Analytical Model Toward Big Data Analysis
using Ridge Regression Method
Afreen Ali
Computer Science & Engineering, Department All Saint’s College of Technology
Bhopal, India
Sarwesh Site
Computer Science & Engineering, Department All Saint’s College of Technology
Bhopal, India
ABSTRACT
Ridge Regression is a essential method in linear regression used to analyze multiple regression data which have multicollinearity. For solving highly related multicollinearity problems, Ridge Re-gression is a better modeling technique than ordinary least square method. The analytical data in modern technology is becoming ex-tremely large in size and the term which describes this large vol-ume of data is “Big Data”, and ordinary tools are insufficient to analyzes big data. In this paper, we are presenting an approach toward big data analysis through ridge regression method. Our simulation result represents a mapping model of Gaussian data from big data in sufficient scale. This model presents the new gateway for big data for statistical and mathematical analysis.
General Terms
Ridge Regression
Keywords
Big Data, MapReduce, Statistics, Regression Model, Gaussian Data
1. INTRODUCTION
Ridge regression is used as a part of highly correlated multi-independent factor related dependent variables. It is worked to re-duce the effect of all factor on the any other. It is a process for examining multiple regression data that suffer from multicollinear-ity [1]. When multicollinearmulticollinear-ity happens, least squares estimates are unbiased, but their differences are large so their may be far to the true value. From computing a degree of bias to the regression ap-proximations, ridge regression undermine the standard errors [2]. The world has come into the era of big data in any case, more and more big data issues are deriving in fields, such as scientific re-search, international economics, public administration and so on. Discovering techniques to big data became a current eventuality and challenge. In big data applications, it is usual for the attribute to work in the same manner with response or explanatory variable [3]. Various techniques of analysis was developed in view of such problems, like logistic regression, andk−nearest neighbor method so on. In any way, some research express an important type of big data issue in which the response variable works as the real numeric type and the explanatory variable is the attribute type [4].
In ordinary least squares, the regression coefficients are estimated represented in formula
ˆ
B= (X0X)−1
X0Y (1)
Note that fact since then the variables are standardized,X0X=R, whereRis the correlation matrix of independent variables. These approximations are unbiased so that the expected value of the esti-mates are the population values. That is,
E(ˆB) =B (2)
The variance-covariance matrix of the estimations is
V(ˆB) =σ2R−1 (3)
and since then we are supposing that they0s are standardized,σ2=1.
From the above, we find that
V(ˆbj) =rjj= 1 1−R2
j
(4)
whereR2
jis theR−squared value obtained from regressionXjon the other independent variables. Ridge regression advances by in-cluding a small value,k, to the diagonal elements for the correlation matrix. This is the place ridge regression gets its name since the di-agonal of ones in the correlation matrix might be consideration of as a ridge.
That is shown as,
˜
B= (R+kI)−1X0Y (5)
where,kis a positive amount less than one. The measure of bias in this estimator is predicted by
E B˜−B
=h(X0X+kI)−1X0X−IiB (6)
and the covariance matrix is given by
V B˜
=X0X+kI
−1
X0XX0X+kI
−1
(7)
1.1 MapReduce
MapReduce is a system using that the applications can be com-posed to process enormous magnitude of data, in similar, on major clusters of objective hardware in a determined manner [7][8]. M. R. Thakareet al.[9] presented the master node having the input that classify data into minor sub parts and partition in worker nodes. It is a software development model which is inspired by functional pro-gramming and permits expressing distributed calculations on ex-tensive amounts of data [10].
MapReduce is a method to process massive amounts of data, in par-allel, on large sets of commodity hardware in a dependable manner [11]. It is a software development model and a related implemen-tation for generating and processing large data sets. The distributed data processing feature by Apache has been used for mining really massive datasets [12].
MapReduce as a model of programming can be understandable as a method which is executed to process big data, by the usage of a distributed and parallel running calculation in a groups [13]. It is a handling technique and a program show for distributed comput-ing depended on java. The MapReduce algorithm consists of two essential task, that is Map and Reduce [14]. Map takes a collection of data and converts it into another collection of data, where indi-vidual elements are separated into tuples (key/value pairs) [2][15]. Also, reduce task, which takes the output from a map as an input and joins those data tuples into a smaller collection of tuples. As the arrangement of the name MapReduce suggests, the reduce task is constantly performed after the map job [16].
1.2 Decision Tree
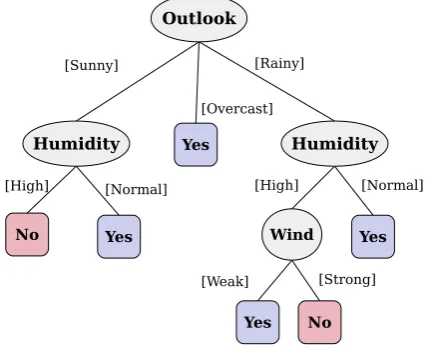
A decision tree is a tool of a tree-like graph of decisions and their conceivable outcomes, including chance event results, and utility. B. Guptaet al.[17] suggested a way to view an algorithm that ex-clusive contains conditional control statements. It influences uses of recursive tree to structure and is a consecutive classifier. There are three kinds of nodes in the decision tree. The node from which the tree is coordinated and has no approaching edge is known as the root node. A node with dynamic edge is called internal or test node however the different nodes are called leaves (also known as terminal or decision node). The data set in decision tree is exam-ined by developing a branch like structure with proper decision tree algorithm. Each internal node of tree parts into branches in view of the splitting criteria. Each test node signifies a class. Each terminal node represents the decision. They can work for categorical and continuous properties.
A decision tree for the concept check ‘Humidity’, indicating whether a checking humidity is shown in Figure 1. Each internal node represents a test on an attribute. Each external node repre-sents a class (either indicate the humidity is high = “no” or normal = “yes”).
1.3 Types of Decision Trees
Decision trees applied in data mining are of two types:
• Classification Treein which analysis is when the predicted come is the class to which the data belongs. For example out-come of loan application as safe or risky.
[image:2.595.328.542.72.246.2]• Regression Treein which analysis is when the predicted out-come can be considered a real number. For example population of a state.
Fig. 1. A Decision Tree for The Concept of Check The Weather
1.4 Big Data Research
In the current digitally connected world, each and every thing can be examined of creating data. The terminology Big Data is not just about the importance of data that comes in the scope of MapRe-duce is considered a simplification approach for parallel computa-tion of large data [18]. The MapReduce implementacomputa-tion depends on specific or customized cluster management that is responsible for distributing and running peta bytes or zeta bytes something it is more about the capability to consider large amounts of data. This data that is getting added to the current ocean of Big Data formed from uncountable sources like web logs, PDAs, smart phones, so-cial network sites, satellite pictures, biological records, client ex-changes and astronomical, poses immense opportunities as well as challenges for researchers to handle and provide useful result. S. Junet al.[19] proposed an approach to overcome the computing burden in big data analysis because most statistical methods were determined on small sample data. Also in big data analysis, it ana-lyze entire data which are considered as population in statistics, and this data set is so huge. This research divided the big data closed to population into sub data set like sample for solving the computing cost in big data analysis. In addition, they applied this approach to regression problem in statistics. They applied the divided method of big data to multiple regression analysis, and used simple random sampling for big data dividing. Big data have also these four fields. Big data analysis is one of big data science, and statistics support key performance to the big data analysis. Figure 2 presents a rela-tion of statistics to big data.
Fig. 2. From Big Data to Statistics
[image:2.595.353.514.571.643.2]as a population. In statistics, a population is defined as a set of total elements in the subject of study, and the population cannot be ana-lyzed because of its analyzing cost or changeable. But in big data, a data set can be analyzed closed to the population. It is caused by the development of computing large data and decreasing the price of data storage. But, the computing burden of big data analysis re-mains because the traditional analyses such as statistical methods have a limitation for analyzing big data.
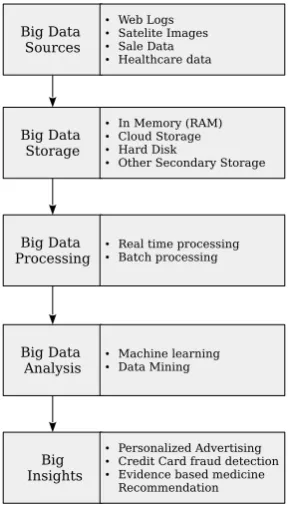
[image:3.595.344.532.183.454.2]L. R. Nairet al.[20] presented the research of in Big Data pro-gresses in different dimensions including effective capture of data, discovering novel storage solutions and recovery techniques. Fig-ure 3 gives an outline of Big Data analytics flow. Also, much con-sideration has been given to Big Data analytics in cloud environ-ment. Social network source big data analytics is also a dynamic area of research to discover cutting edges. Bo-Wei Chenet al.[21] presented Big Data analytic framework for scalable machine learn-ing, data mining algorithms, exact learnlearn-ing, accurate predictions, developing new representation techniques, receiving tight security, privacy preservation strategies and benchmarking.
Fig. 3. Big Data Analytic Flow
2. BIG DATA TECHNOLOGIES
Big data technologies are important in giving more precise analy-sis, which may lead to more concrete decision-making resulting in greater operational efficiencies, cost reductions and reduced risks for the business. There are different technologies in the market from various vendors including Amazon, IBM, Microsoft to deal with big data which look into the technologies that handle big data. Goldaret al.[22] presented realistic tools, techniques and meth-ods for parallelization of big data such as Hadoop, MongoDB and Spark, the description of these tools are as follows:
2.1 Hadoop
[image:3.595.100.245.277.531.2]Hadoop [23][24] is an Apache open source system composed in java that permits distributed processing of large datasets across clusters of computers operating basic programming models. A Hadoop frame-worked application works in a space that gives distributed storage and computation across clusters of computers. Hadoop is intended to scale up from single server to an expansive number of machines, each offering nearby computation and stor-age capacity. The working flow of big data parallelization under Hadoop is represented in Figure 4.
Fig. 4. Hadoop
2.1.1 Hadoop MapReduce. Hadoop MapReduce is a software framework for easily composing applications which process big amounts of data in-parallel on large clusters (a huge number of nodes) of commodity hardware in a dependable, fault-tolerant man-ner [25]. The term MapReduce really refers to the following two other tasks that Hadoop programs perform:
—The Map TaskThis is the primary task, which takes input infor-mation and converts it into a collection of data, where individual elements are separated into tuples.
—The Reduce TaskThis task takes the output from a map task as input and joins those data tuples into a smaller collection of tuples. The reduce task is always performed after the map task.
in the occurrence of system failures. HDFS uses the master/slave framework where one master device controls one or more other slave devices.
The Hadoop Distributed File System (HDFS) depends on the Google File System (GFS) and gives a distributed file system that is intended to running on large clusters (thousands of computers) of small computer machines in a reliable, fault-tolerant manner. A document in an HDFS namespace is part into few blocks and those blocks are stored in a set of DataNodes. The NameNode decides the mapping of blocks to the DataNodes. The DataNodes deal with read and write operation with the file system. They additionally deal with block creation, deletion and replication in view of direc-tion given by NameNode.
HDFS gives a shell like some other file system and a list of com-mands are accessible to cooperate with the file system.
2.2 MongoDB
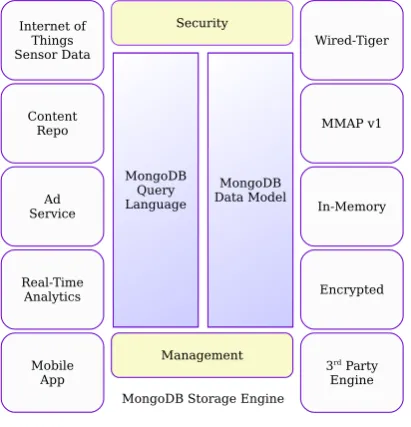
MongoDB [27][28] is a cross-platform, document oriented database that gives, high performance,and easy scalability. Mon-goDB works on concept of collection and document. The structure of MongoDB is presented in Figure 5.
Ad Service Content Repo Internet of
Things Sensor Data
Real-Time Analytics
Mobile App
Security
Management MongoDB
Query Language
MongoDB Data Model
Wired-Tiger
MMAP v1
In-Memory
Encrypted
[image:4.595.71.277.302.516.2]3rd Party Engine MongoDB Storage Engine
Fig. 5. MongoDB
—DatabaseDatabase is a physical container for collections. Every database gets its own particular arrangement files on the file sys-tem. A single MongoDB server regularly has multiple databases. —CollectionCollection is a group of MongoDB records. It is the equivalent of an RDBMS table. A collection exists inside a sin-gle database. Collections don’t authorize a pattern. Documents within a collection can have different fields. Normally, all docu-ments in a collection are of similar or related purpose.
—DocumentA document is an arrangement of key-value pairs. Documents have dynamic pattern. Dynamic schema implies that documents in a similar collection don’t need to have the same set of fields or structure, and common fields in a collection’s docu-ments may hold different types of data.
2.3 Spark
Industries are using Hadoop broadly to examine their data sets. The reason is that Hadoop structure depends on a basic program-ming model (MapReduce) and it enables a computing solution that is scalable, fault-tolerant and cost effective. Here, the fundamen-tal concern is to keep up speed in processing extensive datasets in terms of waiting time between queries and holding up time to run the program.
Spark was presented by Apache Software Foundation for speeding up the Hadoop computational computing software process. Spark uses Hadoop in two ways one is storage and second is processing. Since Spark has its own cluster management computation, it works Hadoop for storage.
Apache Spark. Apache Spark [29] is a lightning-fast cluster com-puting technology, intended for fast computation. It depends on Hadoop MapReduce and it extends the MapReduce model to ef-fectively use it for more types of computations, which includes interactive queries and stream processing. The principle of Spark is its in-memory cluster computing that increases the processing speed of an application. Spark is intended to cover an extensive range of workloads for example batch applications, iterative algo-rithms, interactive queries and streaming. Aside from supporting all these workload in a particular system, it decreases the adminis-tration burden of maintaining separate tools. The structure of Spark is presented in Figure 6.
Spark SQL + Data Frame
Spark Streaming
Mllib (Machine Learning Library)
GraphX (Graph Calculation)
Apache Spark Core
Fig. 6. Spark
3. RELATED WORK
3.1 An exact approach to ridge regression for big data
[image:4.595.331.537.340.418.2]Ridge regression has turned to be popular and all around acknowl-edged since it was first proposed by Hoerl and Kennardet. al[33] in 1970. At the point when multicollinearity happens, despite the fact that the standard thing least squares estimators are as yet unbiased, their variances are absolutely inflated. By including a small degree of bias to the least squares estimators, ridge regression can signifi-cantly reduce their standard errors and in this manner increment the levels of significance. The aim of the present article is to propose new methods and algorithms for ridge regression which can over-come these challenges. Ridge regression is one of the extremely common techniques to increase the power [34].
3.2 Classical Ridge Regression
R. L. Obenchainet al.[35] proposed a method For testing gen-eral linear speculations in multiple regression models. it is demon-strated that non-stochastically shrunken ridge estimators yield a similar central F-ratios and t-statistics as does the least squares es-timator. Thus although ridge regression does produce biased point estimates which deviate from the least squares solution, ridge tech-niques do not generally yield “new” normal theory statistical in-ferences: in particular, ridging does not necessarily produce shifted confidence regions. A concept, the “ASSOCIATED PROBABIL-ITY” of a ridge estimate, is defined using the standard, hyper-ellipsoidal confidence region centered at the least squares estimator, and it is contended that ridge estimates are of moderately little in-terest when they are so extreme to the point that they lie outside of the least squares region of say 90 percent confidence.
Recently, the term big data has advance quickly in both statistics and computer science. When handling with statistical methods for big data, computing the approximation of model parameters via tra-ditional methods and algorithms is impossible because they attempt to load the total data set to the memory, indicating that neither the memory barrier nor the computational efficiency barrier is consid-ered. To conquer these difficulties, new reasoning in statistics and computer science is required Fanet al.[36] 2014. Traditional al-gorithms perform well only in moderate data. If the entire data set is stacked to memory of a computer, at that point standard algo-rithms can be connected. Examples incorporate the computation of the rank statistics, the order statistics, and the standardization[37]. Be that as it may, these algorithms are infeasible in big data.
3.3 Regression Model for Big Data with Attributive Explanatory Variables
Qing-Tinget al.[38] proposed using the SLR method to address big data problems of linear relation. Compared with the direct es-timation method, which requires extensive historical sample data, our SLR method uses limited storage space, even as the data size grows. In addition, the sequential updating process is extremely efficient. As the applications for modeling of big data and analy-sis advance in scope, computational efficiency faces greater chal-lenges in terms of storage and speed. In many practical problems, a great amount of historical data is sequentially collected and used for online statistical modeling. For modeling sequential data, It is a sequential linear regression method that extracts essential infor-mation from historical data. This carefully selected inforinfor-mation is then utilized to update a model according to a sequential estimation scheme. With this technique, the earlier data no longer needs to be stored, and the sequential updating is computationally efficient in speed and storage. A weighted strategy is introduced on the cur-rent model to determine the impact of data from diffecur-rent periods. When compared with estimation methods that use historical data,
our numerical experiments demonstrate that our solution increased the speed while decreasing the storage load.
3.4 Statistics in Data Mining
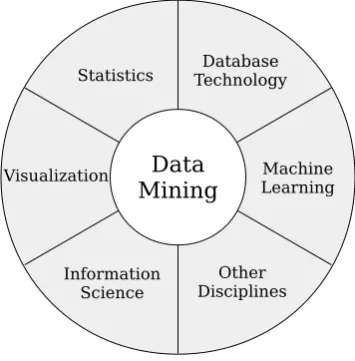
[image:5.595.346.524.230.411.2]A research by J. H. Friedmanet al.[39], explains the connection between Statistics and Data Mining. Statistics is the study of col-lection, analysis, interpretation, presentation, and organization of data. Statistics is a component of data mining that provides the tools and analytics techniques for dealing with large amounts of data. It is the science of learning from data and includes everything from collecting and organizing to analyzing and presenting data. It is concerned with probabilistic models, specifically inference, us-ing data [40]. Figure 7 represents relation of data minus-ing to other disciplines of computer science and mathematics. While the aims
Fig. 7. Statistics in Data Mining
of statistics and data mining are similar, it is estimated that there are very few statisticians to deal with the demands of data analysts [41]. Data mining and statistics are related to learning from data. They are all about discovering and identifying structures in them, thus aimed at turning data to information. And although the aims of both these techniques overlap, they have different approaches. Statistics is only about quantifying data. While it uses tools to find relevant properties of data, it is a lot like math. It provides the tools necessary for data mining [42].
The two main statistical methodologies are descriptive statistics and inferential statistics. Descriptive statistics organize and sum-marize the data for the sample. The methodology of using these summaries to draw conclusions from entire data sets, is called in-ferential statistics.
4. PROPOSED APPROACH
in a sensible amount of time. A method and algorithm based on a single processor system is presented for big data analysis. The proposed method is an approach for the computation of the ex-act ridge regression parameters for big data. The approach contains statistical methods and numerical algorithms forβs,λˆ andVˆ( ˆβs,λ)
with respect a single processor system. The entire data set cannot be loaded to the memory but can be saved to the hard disk of a computer, so it is assumed that any standard treatment procedure of the raw data cannot be applied because the results from these procedures must be saved either to the memory or the hard disk, which is infeasible.
In order to propose an efficient method for ridge regression to big data, the properties of the likelihood function is considered. Based on the distribution ofi, the log likelihood function is
`(β, σ2) =−n
2log(2π)−
n
2logσ 2− 1
2σ2
n X i=1
(yi−x0iβ)
2
(8)
The maximum likelihood estimation (MLE) ofβis
ˆ
β=
n X i=1
xix
0
i !−1
(9)
and the maximum likelihood estimation (MLE) ofσ2is
ˆ
σ2= 1
n n X i=1
y2i− n X i=1
xiyi !0 n
X i=1
xix
0
i ! n
X i=1 xiyi ! (10) Observing the right sides of Equation 9 and 10, we find thatβˆand
ˆ
σ2can be expressed as functions ofsyy=
n X i=1
yi2, Sxy=
n X i=1
xiyi
andSxx= n X i=1
xix
0
iwheresyyis a univariate quantity,sxyis ap−
dimensional vector, andSxxis ap×p−dimensional matrix. Then,
ˆ
β=S−xx1sxy (11) and
ˆ
σ2= 1
n(syy−s
0
xyS
−1
xxsxy). (12)
Let
Ai=
yi
xi
yi x
0 i = y2
i yix
0
i
xiyi xix
0
i
(13)
be the(p+ 1)×(p+ 1)−dimensional augmented matrix of theith observation by combining the response and the explanatory vari-ables together. Let
A=
n X i=1
Ai=
syy s0xy
sxy Sxx
(14)
be the(p+ 1)×(p+ 1)−dimensional augmented matrix of the entire data set. Then,syy,sxy, andSxxcan be obtained ifAis de-rived. Therefore, we have the following theorem.
For cross-validation specifically, Cross-Conformal Prediction (CCP) partitions the training set intoK subsetsS1, S2, . . . , SK
and calculates the nonconformity scores of the examples in each
subsetSkand of(xl+1,y˜)for each possible labely˜as
αi=A
[ m6=k
Sm, zi
, zi∈Sk, m= 1, . . . , K, (15)
αy,kl˜+1=A
[ m6=k
Sm, zly˜+1
, m= 1, . . . , K, (16)
where zyl˜+1 = (xl+1,y˜). For z ˜
y
l+1 K nonconformity scores
αy,kl˜+1, k = 1, . . . , Kare calculated, one with each of theKfolds. Now thep−value for each possible labely˜is computed as
p(˜y) =
PK k=1 n
zi∈Sk:αi≥αy,kl˜+1o + 1
l+ 1 . (17)
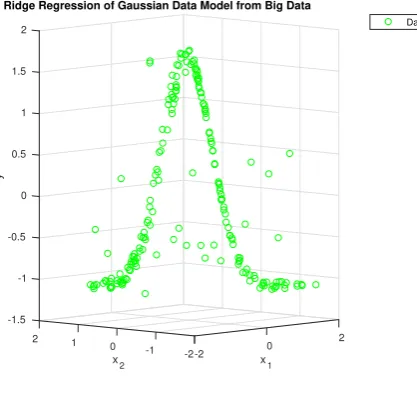
5. RESULT ANALYSIS
All of the computations were carried out by a seventh generation Intel Core−i52.8 GHz processor with 8 GB DDR3 memory. The big data is scanned and mapped, then a scale-model were created based on co-variant matrix, and Gaussian data as a model of big data were taken as a input for analysis. The Gaussian is a continu-ous distribution
P(y) = 1
σ√2πe
−(y−µ)
2
2σ2 (18)
µ= mean of distribution (also at the same place as mode and me-dian)
σ2= variance of distribution
[image:6.595.322.531.432.632.2]yis a continuous variable (-∞ ≤y≤ ∞)
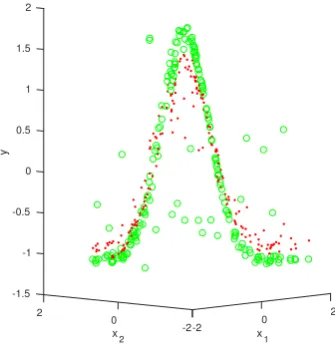
Figure 9 and 8 represent simulation of Gaussian data taken as model of big data.
2 -1.5 -1 -0.5 0 0.5 2 1
Ridge Regression of Gaussian Data Model from Big Data
1.5 2 y 1 0 x 1 0 x 2
-1 -2-2
Data Points
Fig. 8. Proposed Method
The simulation involves one response to be ridge regressive. Data points for the covariates, denoted axis such as (x1, x2, y), are drawn
[image:6.595.53.295.459.551.2]2 -1.5
-1 -0.5 0 0.5
2 1
Ridge Regression of Gaussian Data Model from Big Data
1.5 2
y
0 x1 0
x2 -2-2
[image:7.595.56.224.86.263.2]Actual Data Predicted Data
Fig. 9. Proposed Method
(2to−2), and points ofx2is also (2to−2) and points ofyaxis is
between (−1.5to2).
6. CONCLUSION AND FUTURE WORK
In this paper, an approach was proposed to overcome the comput-ing load in big data analysis since mostly Ridge Regression as a statistical methods were focused on small sample Gaussian data. In Big data analysis, whole data should be analyzed which are recog-nized as population in statistics, and this data collection is so large. In the experimental results, the regression parameters estimated by the big data were not different to the parameters by sub data sets. This research contributes to avoid the computing problem in many fields for big data analysis.
This approach can be applied to more diverse methods in statistics such as factor analysis and clustering. More diverse methods of big data sampling are needed in the future works. More advanced combining methods for merging the results of sun data sets can be proposed.
References
[1] A. J. Bush, “Ridge: A program to perform ridge regression analysis,” Behavior Research Methods & Instrumentation, vol. 12, no. 1, pp. 73–74, Jan 1980.
[2] R. Tibshirani, “Regression shrinkage and selection via the lasso,” Journal of the Royal Statistical Society. Series B (Methodological), vol. 58, no. 1, pp. 267–288, 1996. [3] A. Gepp, M. K. Linnenluecke, T. J. ONeill, and T. Smith,
“Big data techniques in auditing research and practice: Cur-rent trends and future opportunities,”Journal of Accounting Literature, vol. 40, pp. 102 – 115, 2018.
[4] Q. Gao and T. C. Lee, “High-dimensional variable selection in regression and classification with missing data,”Signal Pro-cessing, vol. 131, pp. 1 – 7, 2017.
[5] B. Efron, T. Hastie, I. Johnstone, and R. Tibshirani, “Least angle regression,”Ann. Statist., no. 2, pp. 407–499, 04.
[6] J. S. Vitter, “Algorithms and data structures for external mem-ory.” Found. Trends Theor. Comput. Sci., vol. 2, no. 4, pp. 305–474, 2006.
[7] J. Dean and S. Ghemawat, “Mapreduce: Simplified data pro-cessing on large clusters,” pp. 137–150, 01 2004.
[8] H. Karloff, S. Suri, and S. Vassilvitskii, “A model of com-putation for mapreduce,” inProceedings of the Twenty-first Annual ACM-SIAM Symposium on Discrete Algorithms, ser. SODA ’10, 2010, pp. 938–948.
[9] M. R. Thakare, S. W. Mohod, , and A. N. Thakare, “Various data-mining techniques for big data,” IJCA Proceedings on International Conference on Quality Up-gradation in Engi-neering, Science and Technology, vol. ICQUEST 2015, no. 8, pp. 9–13, October 2015, full text available.
[10] M. Enea, “Fitting linear models and generalized linear models with large data sets in r,”Statistical Methods for the Analysis of Large Datasets: book of short papers, pp. 411–414, 2009. [11] J. Polo, D. Carrera, Y. Becerra, M. Steinder, and I. Whalley,
“Performance-driven task co-scheduling for mapreduce envi-ronments,” in2010 IEEE Network Operations and Manage-ment Symposium - NOMS 2010, April 2010, pp. 373–380. [12] A. Fernndez, S. del Ro, V. Lpez, A. Bawakid, M. J. del
Je-sus, J. M. Bentez, and F. Herrera, “Big data with cloud com-puting: an insight on the computing environment, mapreduce, and programming frameworks,” Wiley Interdisciplinary Re-views: Data Mining and Knowledge Discovery, vol. 4, no. 5. [13] D. Miner and A. Shook,MapReduce Design Patterns:
Build-ing Effective Algorithms and Analytics for Hadoop and Other Systems, 1st ed. O’Reilly Media, Inc., 2012.
[14] P. Ma and X. Sun, “Leveraging for big data regression,”Wiley Interdisciplinary Reviews: Computational Statistics, vol. 7, no. 1.
[15] S. Guha, R. Hafen, J. Rounds, J. Xia, J. Li, B. Xi, and W. S. Cleveland, “Large complex data: divide and recombine (d and r) with rhipe,”Stat, vol. 1, no. 1.
[16] N. Lin and R. Xi, “Aggregated estimating equation estima-tion.”Stat. Interface, vol. 4, no. 1, pp. 73–83, 2011.
[17] B. Gupta, A. Rawat, A. Jain, A. Arora, and N. Dhami, “Anal-ysis of various decision tree algorithms for classification in data mining,” International Journal of Computer Applica-tions, vol. 163, no. 8, pp. 15–19, Apr 2017.
[18] R. V. Hogg and A. T. Craig,Introduction to mathematical statistics.(5”” edition). Upper Saddle River, New Jersey: Prentice Hall, 1995.
[19] S. Jun and S.-J. L.-B. Ryu, “A divided regression analysis for big data,”International Journal of Software Engineering and Its Applications, vol. 9, no. 5, 2015.
[20] L. R. Nair and S. D. Shetty, “Research in big data and analyt-ics: An overview,”International Journal of Computer Appli-cations, vol. 108, no. 14, pp. 19–23, December 2014, full text available.
[22] P. Goldar, Y. Rai, and S. Kushwaha, “A review on paralleliza-tion of big data analysis and processing,”International Jour-nal of Emerging Technology in Computer Science & Electron-ics (IJETCSE), vol. 23, no. 4, pp. 60–65, August 2016. [23] H. Geng,HADOOP TECHNOLOGY. Wiley Telecom, 2017,
pp. 816–.
[24] D. Vohra,Using Apache Hadoop. Berkeley, CA: Apress, 2016, pp. 117–130.
[25] W. Q. Meeker and Y. Hong, “Reliability meets big data: Opportunities and challenges,”Quality Engineering, vol. 26, no. 1, pp. 102–116, 2014.
[26] Y. Mao and W. Min, “Storage and accessing small files based on hdfs,” inProceedings of International Conference on Com-puter Science and Information Technology, S. Patnaik and X. Li, Eds. New Delhi: Springer India, 2014, pp. 565–573. [27] S. G. Edward and N. Sabharwal, Introducing MongoDB.
Berkeley, CA: Apress, 2015, pp. 25–28.
[28] L. Vokorokos, M. Uchnr, and A. Bal, “Mongodb scheme anal-ysis,” in2017 IEEE 21st International Conference on Intel-ligent Engineering Systems (INES), Oct 2017, pp. 000 067– 000 070.
[29] D. Vohra,Using Apache Spark. Berkeley, CA: Apress, 2016, pp. 219–228.
[30] T. Zhang and B. Yang, “An exact approach to ridge regres-sion for big data,”Computational Statistics, vol. 32, no. 3, pp. 909–928, Sep 2017.
[31] J. Haworth, J. Shawe-Taylor, T. Cheng, and J. Wang, “Local online kernel ridge regression for forecasting of urban travel times,”Transportation Research Part C: Emerging Technolo-gies, vol. 46, no. Supplement C, pp. 151 – 178, 2014. [32] H. Xue, Y. Zhu, and S. Chen, “Local ridge regression
for face recognition,”Neurocomputing, vol. 72, no. 4, pp. 1342 – 1346, 2009, brain Inspired Cognitive Systems (BICS 2006) / Interplay Between Natural and Artificial Computation (IWINAC 2007).
[33] A. E. Hoerl and R. W. Kennard, “Ridge regression: Bi-ased estimation for nonorthogonal problems,”Technometrics, vol. 12, no. 1, pp. 55–67, 1970.
[34] H. Zhan and S. Xu, “Adaptive ridge regression for rare variant detection,”PLOS ONE, vol. 7, 08 2012.
[35] R. L. Obenchain, “Classical f-tests and confidence regions for ridge regression,”Technometrics, vol. 19, no. 4, pp. 429–439, 1977.
[36] J. Fan, F. Han, and H. Liu, “Challenges of big data analysis,” National Science Review, vol. 1, no. 2, pp. 293–314, 2014. [37] X. Shen, M. Alam, F. Fikse, and L. R¨onneg˚ard, “A novel
gen-eralized ridge regression method for quantitative genetics,” Genetics.
[38] Q.-T. Zhang, Y. Liu, W. Zhou, and Z.-W. Yang, “A sequen-tial regression model for big data with attributive explana-tory variables,”Journal of the Operations Research Society of China, vol. 3, no. 4, p. 475.
[39] J. H. Friedman, “Data mining and statistics: What’s the con-nection?”Computing Science and Statistics, vol. 29, no. 1, pp. 3–9, 1998.
[40] Y. Benjamini and M. Leshno, “Statistical methods for data mining,” in Data Mining and Knowledge Discovery Hand-book. Springer, 2005, pp. 565–587.
[41] F. Z. Maksood and G. Achuthan, “Analysis of data min-ing techniques and its applications,”International Journal of Computer Applications, vol. 140, no. 3, pp. 6–14, April 2016, published by Foundation of Computer Science (FCS), NY, USA.
[42] A. Mohammadighavam, N. Rajabpour, and A. Naserasadi, “A survey on data mining approaches,”International Journal of Computer Applications, vol. 36, no. 6, pp. 14–18, December 2011, full text available.