Developmental Change of Vegetative Plant Architecture of
Annual-Form-Wild Rice (Oryza rufipogon Griff.) Elevates
Competitive Ability during the Late Development under a
Dense Condition
Hiroyuki Shimizu, Youki Itoh
Crop Breeding Research Division, Hokkaido Agricultural Research Center, National Agriculture and Food Research Organization, Sapporo, Japan.
Email: [email protected]
Received January 13th, 2012; revised February 17th, 2012; accepted March 5th, 2012
ABSTRACT
Annual-form-wild (AFW) rice developmentally changes the vegetative plant architecture from flat to elect shape. The main objective of the present study is to suggest that the change might be related to competitive ability (CA). Recombi-nant inbred lines (RILs) derived from a cross between an AFW rice and a cultivar were grown under high-density (H) and low-density (L) conditions in a weedy paddy field. At two and three months after transplanting (MATs), we evalu-ated the two traits associevalu-ated with utilization of light resource, tiller angle (TA) and actual plant height (APH), and amount of the growing weeds using an index, weed-denseness score (WDS). Then, DC-TA, DC-APH and SC-WDS was defined as the amount of change in TA, APH, and WDS from two to three MATs, respectively. Multiple regression analysis revealed that only DC-TA significantly affected SC-WDS specific under H condition that is relatively similar to habitats of AFW rice. Quantitative trait locus (QTL) analyses identified that one of the two QTLs associated with DC-TA shared a linked molecular marker with a QTL associated with SC-WDS only under H condition. Further, RILs with AFW-rice-derived allele on the QTL associated with DC-TA tended to show drastic changes of TA toward narrow angle as well as large decreases of weed amount. All the QTLs associated with DC-APH were not linked to the QTL associated with SC-WDS under H condition. Therefore, it is suggested that under the crowded conditions during the late plant development, AFW-rice plants might not survive through canopy domination but elevate CA through increases of efficiency of capturing light due to changes from wide to narrow tiller angle. Since flat-plant shape of AFW rice during the early development would have been evolved by trampling pressures, the present finding suggest that different selec- tive pressures in life time might have cooperatively evolved the developmental change.
Keywords: Competition; Development; Heterogeneous Environments; Genetic Analysis; RIL; Wild Rice
1. Introduction
The wild progenitor of Asian cultivated rice, Oryza rufi-
pogon Griff., tends to show annual-perennial continuum within a species [1,2]. Annual-form-wild (AFW) rice prefers to temporary swamps that are parched in dry season [3,4]. The habitat is mainly characterized by the three disturbances, drought stress in dry season, tram- pling pressures by large size of mammals during the early vegetative plant development and water stress in rainy season [3-5]. Due to the disturbances, AFW-rice plant has been evolved as an r-strategist, inclining to a high reproductive effort in the life history [2]. The dis- persed seeds are eaten by rodents or small bards at a high rate, and hence, buried seeds with a large variation of
seed longevity (or dormancy) play an important role of population persistence [3,4,6,7].
can be established. Against the expectation, AFW-rice plants were very inferior to rice cultivars so far as fit- ness-related traits measured at maturity stage were con- cerned under a common cultivation practice (indicating low density condition relative to natural habitat of AFW rice) [11].
Later, the reason was suggested by the empirical de- monstrations that the variation of the plant architecture associated with canopy domination, especially, plant height, at a time of early vegetative plant development might be associated with the intergenotypic competition under paddy-field conditions in Asian tropic cultivated rice (Oryza sativa L.) [12-14]. Under the implicit pre- condition that there is no trampling pressure in paddy- field, Jennings and coworkers discussed that plant de- velopments of rice cultivars could have simply concen- trated on scrambling for the occupation of light resources to result in evolution of tall stature. This viewpoint is also applicable to the feature of vegetative plant archi- tecture of land races in one of northern-limit regions of rice cultivation [15]. Light resources would be also a major factor for interspecific competition between culti- vated rice and weeds under paddy-field conditions [16, 17]. It suggests that competitions of cultivated rice against weeds might have also evolved some weed spe- cies toward a (potentially) tall stature [18-21]. The vege- tative plant architecture of AFW rice generally maintains flat-plant shape with many short tillers during the early development, indicating short stature [22,23]. Therefore, AFW rice in the early developmental phase would also show a weak CA against weeds, if canopy domination is the primal factor of competition under paddy-field condi- tions [4,6]. However, there has been an underestimated empirical fact that CA of AFW rice against weeds in a single generation was not so weak as that of land race strains of the tropics and clearly higher than that of a modern cultivar under a dense condition in paddy field [4, 24].
The surveys of developmental behaviors of AFW rice during the life time should be required to understand the density-dependent CA expression measured at maturity stage (i.e. result of competition) like the competition studies of the other annual plant species [20,25,26], but the behaviors have been treated as a black box. AFW rice drastically changes the plant architecture from flat to elect shape during the late vegetative plant development [27]. Experimental plantings of germinated seeds of wild rice strains under a dense condition in semi-natural weedy habitat revealed that AFW rice expressed a high mortality during the early plant development but most of the remaining plants survived during the late one and also reached maturity [6]. In addition, the rate of survival of AFW rice was clearly higher than a rice cultivar dur-
ing the late development [6]. Hence, it is expected that the developmental change may, in some way, affect the change of CA under a dense condition.
However, it is not easy to give more than an inference to an ecological function of morphology itself or the drastic changes along a temporal axis of ontogeny (i.e. development) without complicated experiments with de- tailed statistical analyses or philosophical meta-analysis [20,28,29]. The function of flat plant shape of AFW rice has been inferred from ecological records in relation to trampling pressure [3,5]. Recently, using quantitative trait locus (QTL) analysis, Sano and colleagues geneti- cally suggested that the flat-plant shape shown by AFW rice might be associated with tolerance against trampling pressure, since they could detect a chromosomal region where a major QTL associated with the shape was closely linked to a QTL associated with the tolerance [22]. This method is important because linkage (or QTL) analysis can be used for reexamining a hypothesis about function of morphology (or development) based on ecological observations or a statistical relationship between mor- phology (or development) and the function. But it re- mains to be studied as to why another QTL that AFW- rice-derived allele contributed to flat-plant shape was not linked to QTL associated with the tolerance [22]. How- ever, an extension of this way may give us for a new methodology if an additional analysis can overcome the reason [e.g. 30].
2. Materials and Methods
2.1. Genetic Materials
Materials used in the present study were thirty-five RILs, which were randomly selected from eighty-nine W107RILs (F6 generation), derived from the cross between A58
(Kokushoku-to 2, a japonica form of rice cultivar (Oryza
sativa L.) from one of the northern-limit regions of rice cultivation, Hokkaido, Japan) and W107 (a common wild rice (Oryza rufipogon Griff.) from Orissa, India) [22,43]. The two-parental lines, A58 and W107, were also in- cluded in the present study. W107RILs and the parental lines have been developed and preserved in Hokkaido University [22]. A58 is a strain, selected from a variation of the initial population that was adapted to Hokkaido islands [41]. Hence A58 is a land race (or an ecotype) of Hokkaido, indicating that no genetic improvement has been consciously performed on A58. W107 is a strain with showing the typical developmental feature of AFW rice [27,42]. In order to compare a feature of CA be- tween RILs and Hokkaido cultivars, twelve-Hokkaido- cultivar strains from an introduced to the latest one were added. The six strains of the twelve involved the one- introduced cultivar, Tsugaru-wase (A110), the three ini- tial-land races, Akage (A1), Akaine (A2) and Akamuro (A5), and the two-land race, Bozu (A9) and Kurikara- mochi (A60). They are preserved in Hokkaido University. The other six strains preserved in Hokkaido Agricultural Research Center (HARC), Fukoku, Fukuyuki, Yukara, Hoshi-no-yume, Nanatsu-boshi and Kita-aoba, were es- tablished from the crossbreeding cultivars. They are so- called modern cultivars [15].
2.2. Cultivations
Germination treatments were carried out in the late April. The seeds of each genotype were soaked in distilled wa- ter in a Petri dish in the dark (30˚C) for three days. Ninety-germinated seeds per strain were strictly im- planted in a culture soil at uniform intervals, according to the way the coleoptiles were above the soil surface and the horizontal directions of coleoptiles in all the rows were same in a seedbed. The treatments were for obtain- ing uniform seedlings of a strain through minimizing the intragenotypic competitions, due to the effects of pheno- typic plasticity on seedling morphologies in the late stage [42,43]. The seedlings were grown in a greenhouse at HARC in Sapporo (43˚N). In the late May, sixty-six plants with showing a uniform leaf age and plant height were, further, selected for transplanting in each genotype. At the transplanting time (i.e. the late May), the selected seedlings of a genotype were randomly divided into the high-density (H) and low-density (L) conditions. In both
density conditions, two replicates were prepared in an identical paddy field at HARC. In each genotype, the eighteen and fifteen plants per replicate for H and L con- dition were transplanted into three rows with a space of 12.5 × 30.5 and 25.0 × 30.5 cm, respectively. Fertilizers were applied at a rate of 0.40-0.49-0.35 NPK (Kg/a), regardless of density condition. The fertilizer application was half the amount of that in common cultivation in Hokkaido. There were large variations in the component traits of vegetative plant architecture among W107RILs [22]. To minimize intergenotypic competitions, the geno- types were arranged according to the genotypic mean of plant height [22]. The order in replicate I was from the genotype showing the largest plant height to that show- ing the smallest one, while that in replicate II was the reversed order of replicate I in the first year. In the sec- ond year, the order in replicate I and II was the same or- der in replicate II and I in the first one, respectively. Any herbicides were not used during the two years to result in an increase of weeds in the paddy field in the second year. The paddy field was irrigated directly after the end of transplanting. It is noteworthy that the paddy field has been used for examining modern-rice strains under a direct-seeded cultivation until the present experiments were performed, indicating that the field was potentially weedier than that for transplanting cultivations [24].
2.3. Weed-Denseness Score
In our paddy field, there were seven-weed species, but the four species, Echinochloa crus-galli (L.) Beauv. var. crus-galli (barnyard grass, annual form), Scirpus jun-
coides Roxb. var. ohwianus T. Koyama (rock bulrush, annual form), Alisma canaliculatum A. Br. Et Bouche (Hera-omo-daka, perennial form), Cyperus difformis L. (sedge, annual form), were the dominant weeds.
vided into three degrees, according to same way of the second-step determination. Therefore, WDS can express values, ranging from zero (= no growing weed) to nine (= the highest degree of denseness of weeds). It is notewor- thy that WDS in a field plot was not determined by rela- tive comparisons with the degrees of weed denseness of the other field plots, but was intuitively determined. For this, the researchers were required to instantaneously decide WDS of a field plot. At 3 MATs, WDS was eva- luated after all the rice plants of a field plot were har- vested except for the evaluated plants since some geno- types dominated the canopies.
WDS of a field plot was mean of three WDSs, which were separately determined by three researchers. WDS of a genotype under a density condition was mean of WDSs of the two replicates (or field plots). The genotypic mean of WDS in the first year varied from 0.0 to 7.5 under H condition and from 2.5 to 9.0 under L one in the thirty RILs of which we could completely obtain WDSs. Analysis of variance (ANOVA) revealed that both of the effects of genotype and density on WDS showed the high significances at 1% levels (genotype, df = 29, MS = 15.179; density, df = 1, MS = 40.833; genotype × density, df = 29, MS = 2.178NS). It suggests that the variation of WDS in the first year might not be explained only by accidentally uneven distributions of weeds and/or a per- sonal impression.
WDSs of all the field plots were evaluated at 2 and 3 MATs to examine a dynamics of the amount of growing weeds in the second year. It is noted that the research in the first year confirmed that all the RILs showing flat- plant shape in the early plant development maintained prostrate growth like W107, at least, until 2 MATs. To minimize the effect of memories of the research at 2 MATs on the evaluations of WDS at 3 MATs, the re- searchers have not been informed about data of the rice-
morphological traits and WDS at 2 MATs. At 3 MATs in the second year, to add an objective evidence to WDS, we measured the total fresh weight of all growing weeds in each of the field plots. The bodies of weeds above the ground were cut within five lines × three rows and within four lines × three rows in each of the field plots of H and L condition, respectively. Immediately after all the weeds were cut in each of the field plots, we measured the total weight. To be compared with the fresh weight of weeds (FWW) under H condition, FWW in each of field plots under L condition was multiplied by 2/3, since the cut area in a field plot under H condition was two-thirds times of that under L one.
Each of the three indexes of amount of the growing weeds (i.e. WDS at 2 MATs, WDS and FWW at 3 MATs) of A58 was clearly smaller than that of W107 under both H and L conditions (Table 1), suggesting that W107 might show weaker CA against the weeds than A58. Genotypic mean of WDS at 2 and 3 MATs and FWW varied among RILs. Under a same density condition at a same survey time, each of the three-minimum values of RILs transgressed that of A58, but each of the three- maximum values of RILs were similar to that of W107
(Table 1). ANOVA for WDS at 2 and 3 MATs and
[image:4.595.60.540.556.687.2]FWW revealed the three properties of WDS (Table 2): 1) since WDS at 3 MATs in the second year were also sig- nificantly affected only by genotype and density, we ob- tained repeatability, as to the significant factors for WDS in the variation of RILs. 2) In RILs, the significant fac- tors for WDS were common between 2 and 3 MATs. In Hokkaido cultivars, WDS at 2 MATs was mainly af- fected by density with showing the high significance (P < 0.01), while WDS at 3 MATs was only affected by genotype. Therefore, WDS might be sensitive to differ- ences in population and/or developmental time. 3) In each of RILs and cultivars, the significant factor(s) was
Table 1.Weed-denseness score and flesh weight of weeds.
Strain(s)a Densityb Statisticc WDSd (2 MATse) WDS (3 MATs) FWWf (3 MATs)
W107 H mean ± sd 7.8 ± 0.7 6.5 ± 0.7 505.0 ± 155.6
L mean ± sd 7.8 ± 0.7 6.5 ± 0.7 554.0 ± 32.1
A58 H mean ± sd 3.5 ± 1.4 3.5 ± 0.7 272.5 ± 67.2
L mean ± sd 3.7 ± 1.1 3.5 ± 0.7 295.0 ± 30.6
RILs H Range (max. - min.) (7.2 - 1.3) (6.5 - 2.0) (587.5 - 140.0)
L Range (max. - min.) (8.0 - 2.2) (7.0 - 2.0) (510.0 -183.3)
Hokkaido H Range (max. - min.) (5.5 - 1.0) (6.0 - 1.5) (355.0 - 143.0)
Cultivars L Range (max. - min.) (6.5 - 2.0) (6.5 - 3.0) (386.7 -151.7)
a
W107 (an annual-form-wild rice) and A58 (a land-race cultivar of Hokkaido) are the parental lines of W107RILs [22]. The thirty-five RILs used; were ran-domly selected from eighty-nine W107RILs. The thirteen strains, including A58, were used in the Hokkaido cultivars. bH and L indicates high and low density, respectively. cThe ranges of RILs and Hokkaido cultivars were calculated using genotypic mean. dWeed denseness score (WDS) is an index of the degree of
denseness of weeds, which was directly measured by eyes, and can range from zero (no growing weed) to nine (the highest degree of denseness of weeds). ATs indicate months after transplanting. fFWW is fresh weight of weeds (g/3050 cm2).
eM
common between WDS and FWW at 3 MATs, suggest- ing an association between them.
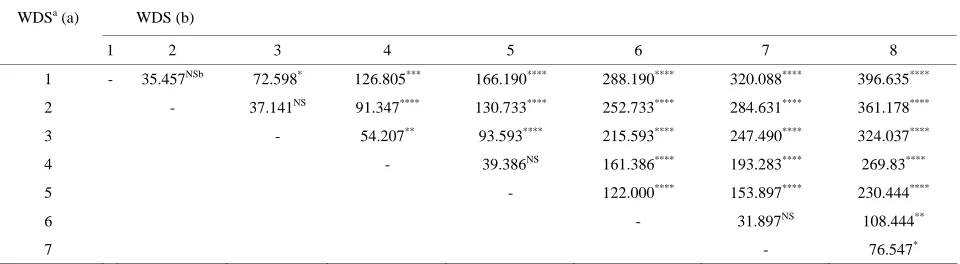
When WDS at 3 MATs is X, FWW (= Y) was ex- pressed by the regression equation, Y = 65.418 + 58.423X (r = 0.771, P < 0.0001, N = 196). It suggests that actual weight of weeds within a field plot might be well pre- dicted by the eye measurement. To obtain a criterion for estimating the statistically reliable difference between two WDSs, we performed Fisher-PLSD test (i.e. a multi- ple comparison) [45]. All of the mean differences of FWW in the twenty-eight comparisons were positive
(Table 3). In addition, all of the mean differences were
significant except for the four comparisons between WDS1 and WDS2, between WDS2 and WDS3, between WDS4 and WDS5 and between WDS6 and WDS7. It suggests that the difference between two WDSs might be
reliable in estimating a significant difference between the two FWWs, if the absolute difference between the two WDSs is at least more than 1.
2.4. Trait Evaluations of Rice Strain
[image:5.595.58.537.324.497.2]In the variation of Oryza sativa, CA is closely associated with traits conferring an ability of canopy domination [12, 16]. Then, we evaluated the two-morphological traits, actual plant height (APH) and tiller angle (TA), part of vegetative body of a plant and was measured in the natu- ral form of vegetative plant architecture.TA was evalu- ated by the degree from one (elect-plant shape) to five (flat-plant shape).The middle three plants in the central row of each of field plots were individually evaluated, and the genotypic mean of a character was calculated
Table 2. Analysis of variance for flesh weight of weeds (FWW, g/3050 cm2), weed-denseness score (WDS) in the thirty-five RILs and thirteen-Hokkaido cultivars.
Source df FWW (3 MATsa) WDSb (3 MATs) WDS (2 MATs)
SS MS Fc SS MS F SS MS F
<RILs>
Genotype (G) 34 1094139.987 32180.588 1.995** 202.243 5.948 2.652*** 209.388 6.158 2.869***
Density (D) 1 107993.829 107993.829 6.694* 22.400 22.400 9.987** 52.841 52.841 24.618***
G × D 34 181645.587 5342.517 0.331NS 34.100 1.003 0.447NS 42.692 1.256 0.585NS
Residual 70 1129251.944 16132.171 157.000 2.243 150.251 2.146
<Cultivars>
G 12 193917.914 16159.826 2.376* 72.577 6.048 3.083** 60.025 5.002 2.198*
D 1 10521.284 10521.284 1.547NS 6.231 6.231 3.176NS 22.631 22.638 13.208**
G × D 12 3199.966 266.664 0.039NS 11.269 0.939 0.479NS 7.193 0.599 0.350NS
Residual 26 176804.500 6800.173 51.000 1.962 44.563 1.714
aMATs indicate months after transplanting. bWDS is an index of the degree of denseness of weed, which was directly measured by eyes, and can range from
zero (no growing weed) to nine (the highest degree of denseness of weeds). c*, ** and ***: Significance at 5%, 1% and 0.1% level, respectively. NS indicates
non-significance.
Table 3. Differences in mean of fresh weight of weeds (FWW, g/3050 cm2) among eight-weed denseness scores (WDSs) at three months after transplanting (N = 196).
WDSa (a) WDS (b)
1 2 3 4 5 6 7 8
1 - 35.457NSb 72.598* 126.805*** 166.190**** 288.190**** 320.088**** 396.635****
2 - 37.141NS 91.347**** 130.733**** 252.733**** 284.631**** 361.178****
3 - 54.207** 93.593**** 215.593**** 247.490**** 324.037****
4 - 39.386NS 161.386**** 193.283**** 269.83****
5 - 122.000**** 153.897**** 230.444****
6 - 31.897NS 108.444**
7 - 76.547*
aWDS is an index of the degree of denseness of weeds, which was directly measured by eyes, and can range from zero (no growing weed) to nine (the highest
degree of denseness of weeds). It is noted that no field plot showing WDS0 or WDS9 was identified at the survey time. bThe each number was obtained by
subtracting of mean of FWW in WDS (a) from that in WDS (b). The differences were tested by Fisher-PLSD test (a multiple comparison) [45]. *, **, ***, ****:
[image:5.595.60.540.566.698.2]
using the phenotypic values of the six plants. Develop- mental change of (DC-) a trait in a genotype was con- veniently defined as subtraction of genotypic mean of the trait at 2 MATs from that at 3 MATs. Here, seasonal change of WDS (SC-WDS) was defined as the subtrac- tion of genotypic mean of WDS at 2 MATs from that at 3 MATs. This index is regarded as change of CA of a rice strain against weeds during the late plant development. Since several researchers reported that growth duration (GD) conferred CA in some crop species including rice [16,46,47], we also recorded heading (or flowering) time by daily observation. GD of a plant was conveniently expressed by days to the third heading from germination. To avoid damaging developments of the rice strains and weeds, we carried out trait evaluations from the boundary between two-field plots.
2.5. Data Statistical Analysis
In the present study, all the statistical analyses were per- formed using Stat View 5.0 (SAS) [45] except for path analysis. As mentioned in the subsection 2.3., effects of genotype and density on WDS at 3 MATs were tested by a two-way ANOVA using thirty RILs in the first year. In addition, effects on WDS at 2 and 3 MATs and FWW were also tested by a two-way ANOVA using thirty-five RILs in the second year (Table 2). When WDS at 3 MATs and FWW was independent and dependent vari- able, respectively, we obtained a significant regression coefficient (P < 0.0001, N = 196). Hence, a liner post hoc contrast was performed using Fisher-PLSD test to know a criterion for estimating the statistically reliable differ- ence between two WDSs (Table 3). Fisher-PLSD test analyzes mean differences in each of contrasts between two groups using multiple t-test and is applicable to the case that the two groups tested show different sample sizes.
Based on the amount of change in WDS between 2 and 3 MATs, the thirty-five RILs were classified into the two groups (Figure 1). In each of the three traits, TA, APH and WDS, under a same density condition at a same survey time, mean difference between the two groups was examined by (two-sample) t-test after we checked that each of the differences of variance between the two groups were not significant using F-test. The statistical analyzes suggest that developmental change of a trait related to utilization of light resource or canopy domina- tion might be associated with change of CA. To know how the developmental changes of the two traits, TA and APH, contribute to CA change (i.e. SC-WDS), we car- ried out multiple regression analysis under each of den- sity conditions. It is noted that DC-TA was statistically independent of DC-APH under each of density condi-
tions (H condition, r = –0.313NS; L condition, r = –0.156NS (N = 35)). The model of multiple regression was ex- pressed by Y = a0 + a1X1 + a2X2, where Y, X1 and X2 was
SC-WDS, DC-TA and DC-APH, respectively. The sta- tistical significances of partial regression coefficients (i.e.
a1 and a2) were examined by t-test. The multiple
regres-sion analyses suggest that developmental change in only one trait of the two might affect SC-WDS in both of den- sity conditions. Then, to simply and visually grasp the relationship between developmental change of a trait and SC-WDS, regression analysis was performed under each of density conditions (Figure 3). The model of regres- sion was expressed by Y = a0 + a1X1, where Y and X1 was
SC-WDS and developmental change of a trait (i.e. DC-TA or DC-APH), respectively. As for L condition, regression analysis was, further, carried out for identify- ing the relationship between GD and SC-WDS. The ad- ditional regression analysis was done because of the two reasons: 1) the viewpoint from the result of genetic ana- lyses were not consistent with that of regression analysis under L condition (Figures 3(b) and 4(b)), and 2) it was reported that GD was associated with CA under rela- tively L condition [16,46,47].
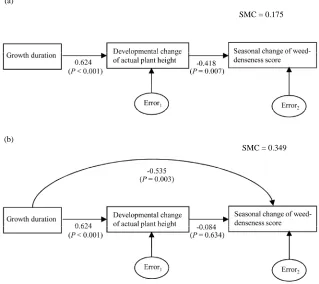
In the present study, GD was significantly correlated with DC-APH and SC-WDS under L condition (between GD and DC-APH, r = 0.624, P < 0.001; between GD and SC-WDS, r = –0.587, P < 0.001). DC-APH was also significantly correlated with SC-WDS under L one (r = –0.419, P < 0.05). The three-correlation relationships were qualitatively consistent with previous competition study of rice [16]. Until now, it has been thought that GD would be indirectly associated with CA through the di- rect contribution to plant height in rice (Figure 5(a)) [e.g. 16]. But the present study showed that correlation coeffi-cient between GD and SC-WDS was higher than that between DC-APH and SC-WDS (Figures 3(b), (c)). It implied that GD might directly affect CA change (or SC- WDS). Therefore, we examined the associations among GD, DC-APH, and SC-WDS using path analysis. We constructed the two-path models to be compared. One was based on the traditional viewpoint of the associations among the three traits in competition of rice (Figure 5(a)), and the other was characterized by the supposition that GD might directly affect SC-WDS as well as DC- APH (Figure 5(b)). To implement identification con- straint, the coefficient of path from errori (i = 1 or 2) was
fixed at the default, 1. After the path coefficients were estimated by maximum likelihood methods, they were standardized. The statistical significances of path coeffi- cients were tested by t-test. To determine which model explained the variation of SC-WDS better, we used squared multiple correlation of SC-WDS which is the roportion of its variance that is accounted by its predic- p
4
Figure 1. Relationships of weed-denseness score (WDS) between two and three months after transplanting (MATs) in thirty- five RILs, the two-parental lines (W107 and A58) and thirteen cultivars of Hokkaido under high- and low-density conditions. WDS is an index of the degree of denseness of weeds, which were directly measured by eyes, and can range from zero (no growing weed) to nine (the highest degree of denseness of weeds). The WDSs expressed genotypic mean. The dotted and bro- ken lines indicate Y = X + 1 and Y = X – 1, respectively. Based on Table 3, it is estimated that two-flesh weights of weeds in a genotype between 2 and 3 MATs might be significantly different when the absolute difference of WDS is at least more than 1. Therefore, circles and squares in the region between the lines of Y = X + 1 and Y = X – 1 (called in-point region) are esti- mated as that the genotype might not significantly change the weed amount during the period. The region under the line of Y = X – 1 is called out-point region, and the points involved in the region are called out-points, which were expressed by closed circles and squares in Figures 1(a) and (b).
tors, GD and DC-APH. Path analyses were performed using AMOS 5.0 (SPSS) [48].
In multiple regression analysis under L condition, only DC-APH significantly affected SC-WDS. Hence, QTL analysis was performed on DC-APH and SC-WDS under L condition, and we detected the chromosomal region where a QTL associated with DC-APH was nearly linked to a QTL associated with SC-WDS. But the pre- sent result of path analysis suggested that GD might di- rectly affect SC-WDS but DC-APH might not signifi- cantly affect SC-WDS. Then, we checked the chromo- somal regions where a DC-APH-related QTL identified in the present study is linked to a GD-related QTL de-
tected in the previous study [22]. As a result, the two regions were founded, but we detected only the one re- gion where a QTL associated with DC-APH was nearly linked to a QTL associated with SC-WDS. To confirm that only the GD-related QTL linked to the QTL associ- ated with SC-WDS is effective on the behavior of GD under L condition in our paddy field, effects of the two- GD-related QTLs on GD were tested by a two-way ANOVA.
2.6. Non-Parametric QTL Analysis
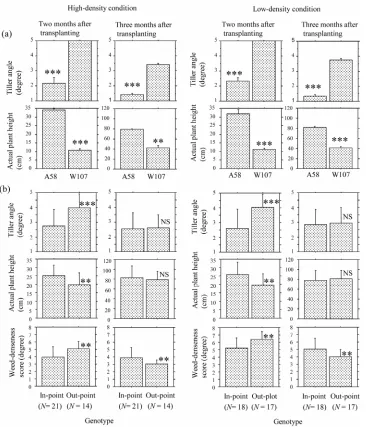
A
Figure 2. Comparisons of tiller angle (TA), actual plant height (APH) between the two-parental lines, A58 and W107 (a), and those of TA, APH and weed-denseness score (WDS) between in-point and out-point genotypes of the recombinant-inbred lines (b). TA is expressed by the degree from one (elect plant shape) to five (flat plant shape). APH is the height from the ground to the highest part of vegetative body in the natural shape. WDS is an index of the degree of denseness weeds, which were directly measured by eyes, and can range from zero (no growing weed) to nine (the highest degree of denseness of weeds). The mean differences of a trait between the two classes were tested by t-test, ** and *** indicates significance at 1% and 0.1% level, respectively, NS indicates non-significance. (a) The dotted boxes and line bars indicate genotypic mean and standard deviations (N = 6), respectively. All the TAs of W107 plants were five at 2 MATs. WDSs of the two parental lines are shown in Table 1. (b) The area under the line of Y = X + 1 in Figures 1(a), (b) was divided into the two regions, in-point and out-point region. Genotypes of which the points were positioned in in-point (or out-point) region were classified as in-point (or out-point) genotype. The dotted boxes and line bars indicate mean and standard deviations, which were calculated based on genotypic mean.
in eighty-nine W107RILs of the F6 generation [43], using
JoinMap version 3.0 [49]. As for the segregation distor- tion in the thirty-five RILs, the deviation from Mendelian inheritance was examined by χ2-test from segregation for the eighty-eight makers [22,43]. The tests revealed that extreme distortions for segregation were detected in the
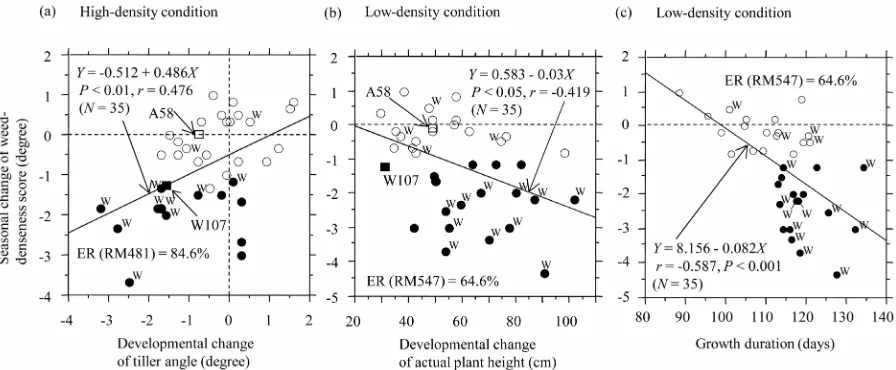
Figure 3. Relationships analyses between developmental change of tiller angle (DC-TA) and seasonal change of weed-dense- ness score (SC-WDS) under the high-density (H) condition (a), between developmental change of actual plant height (DC- APH) and SC-WDS (b) and between growth duration (GD) and SC-WDS (c) under the low-density (L) one. TA and WDS are expressed by the degree from one (elect shape) to five (flat shape) and from zero (no weed) to nine (the highest degree of denseness of weeds), respectively. APH is the height from the ground to the highest part of vegetative body in the natural shape. The change of a trait (including WDS) was calculated by subtracting the genotypic mean of the trait at two-month after transplanting (MATs) from that at 3 MATs. GD in a plant was measured by days to the third heading (or flowering) from germination. Genotypes that the points were positioned in in-point (or out-point) region of Figures 1(a), (b) were classi- fied as in-point (or out-point) genotype. The opened and closed circles represent in-point and out-point genotypes under each of density conditions, respectively. The circles with W indicate the genotypes (or RILs), possessing W107-derived allele (W- allele) on RM481 (on chromosome (Ch) 7) under H condition (a) and on RM547 (on Ch 8) under L condition (b, c), respec- tively. ER indicates an explanation rate: ER (a focal marker locus) = (number of out-point genotypes with W-allele on the marker locus/number of genotypes with W-allele on the marker locus) × 100 (%).
sis of segregation distortion in F5 generation of W107RILs
[22].
In the present study, we performed non-parametric QTL analysis, due to the small number of used RILs. The mapping was carried out using MapQTL version 4.0 [50], which uses the rank sum test of Kruskal-Wallis (KW) that can be regarded as the non-parametric equivalent of the one-way ANOVA. The test is performed on each locus separately under the supposition that segregating QTL (with large effect) linked to a tested maker locus will result in large difference in average rank between the two-maker-genotype classes. Usually, several marker loci, showing significant K-value (i.e. the statistic of KW analysis), continuously distribute around the marker lo- cus that shows the highest K among the loci on a chro- mosomal region. It is a supposition of the non-parametric QTL analysis that the marker locus showing the highest
K might be the nearest marker locus (NML) linked to the focal QTL. As for the plausibility of an estimated QTL, the severe significance threshold, P < 0.005, was strictly used for KW-test, according to the suggestion [50]. In the present study, under the supposition that a NML and the linked QTL in each of the RILs might share the chromo- somal segment derived from an identical parent, the al- lele on the linked QTL, which increased average rank of
a trait, was estimated. The estimated allele on the QTL was conveniently abbreviated to i-allele (i is the abbre- viation of increasing). Intuitively to say, i-allele contrib- utes to increase of trait value since average rank of a trait tended to be positively correlated with the trait mean value. We performed the non-parametric QTL analysis on DC-TA, DC-APH and SC-WDS.
3. Results
3.1. Changes of Weed-Denseness Score during the Plant Development of Rice
To characterize how a genotype changed WDS during the vegetative development of rice, the two-genotypic mean of WDS at 2 and 3 MATs were compared under each of the density conditions (Figure 1). Based on Ta-
ble 3, it was supposed that the two-actual amounts of
weeds (i.e. FWW) in a genotype might be significantly different when the absolute difference in WDS between 2 and 3 MATs was at least more than 1. Under the suppo- sition, the points (i.e. circles or squares in Figure 1), which were positioned in the region between the lines of
Y = X + 1 and Y = X – 1 (called in-point hereafter), indi- cate that the genotypes might not significantly change
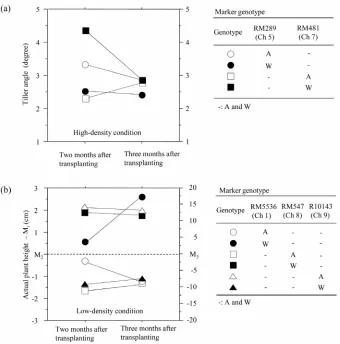
Figure 4. Comparisons of pattern of development change of tiller angle among the four-maker genotypes under high-density condition (a) and that of actual plant height among the six-marker genotypes under low-density one (b). Plots indicate mean. A and W in the marker-genotype tables indicates A58-derived and W107-derived allele, respectively, and AA (or WW) is abbreviated to A (or W). (a) Tiller angle is expressed by the degrees from on (elect-plant shape) to five (flat-plant shape). (b) Actual plant height indicates the height from the ground to the highest part of vegetative body of a plant in the natural shape. Mi (i = 2 or 3) indicates total mean of actual plant height at i months after transplanting in the thirty-five recombinant inbred
lines (M2 = 23.8 cm, M3 = 83.3 cm).
points, which were positioned under the line of Y = X – 1 (called out-point hereafter), indicate that the genotypes might significantly decrease FWW during the period. According to the distinction, W107 might significantly decrease FWW but A58 might not decrease it during the period under each of the two-density conditions (Figures 1(a), (b)). Most of the Hokkaido cultivars, including A58, showed in-point, regardless of density condition (Figures 1(c), (d)), indicating that CA of a cultivar at the late plant development was dependent of that at early one. It is consistent with the previous competition study of culti- vated rice [12]. The RILs showed a large variation of the change of WDS, mainly due to the distributions of out- point (see closed circles in Figures 1(a), (b)). All the RILs showing out-point expressed more than four in WDS at 2 MATs (Figures 1(a), (b)), suggesting that the RILs showing out-point might express weak CAs until 2
MATs but increase CAs during the period from 2 to 3 MATs.
3.2. Phenotypic Analyses of the Relationship between Developmental Change and Seasonal Change of Weed-Denseness Score
Under each of the four conditions, W107 showed larger TA and smaller APH than A58 (Figure 2(a)), indicating that W107 expressed shorter stature than A58 across the four conditions. Further, W107 clearly showed larger WDS than A58 under each of the four conditions (Table 1). The results suggest that W107 might show weak CA against weeds due to the short stature. It accords with the previous competition studies of O. sativa [12,16]. But the question why W107 plants decreased WDS during the
eriod from 2 to 3 MATs (Figures 1(a), (b)) cannot be p
(a)
(b)
SMC = 0.175
SMC = 0.349
Figure 5. Path analyses for the relationships among growth duration (GD), developmental change of actual plant height (DC- APH) and seasonal change of weed-denseness score (SC-WDS) under low density condition (N = 35). GD was defined as days to the third heading from germination. APH is the height from the ground to the highest part of vegetative body in the natu- ral shape. Weed-denseness score (WDS) is expressed by the degrees ranging from zero (no weed) to nine (the highest degree of denseness of weeds). The change of a trait (including WDS) was calculated by subtracting the genotypic mean of the trait at two months after transplanting from that at three one. The single headed arrow indicates liner dependency. To implement identification constraint, the coefficients of path from errori (i = 1 or 2) was fixed at the default, 1 [48]. Path coefficients were
standardized after each of the variables was estimated by maximum likelihood methods. P indicates probability level (t-test). SMC indicates squared multiple correlation of SC-WDS which is the proportion of its variance that is accounted by its pre- dictors, GD and DC-APH. (a) Path model based on Kawano hypothesis [16]; (b) Path model constructed by the results of present study.
resolved by the static viewpoint of competition, suggest- ing need of developmental analysis. There are two prob- lems, as to developmental performances of W107 plants in the paddy field of Sapporo. First, W107 plants could not head at 3 MATs, due to the strongly photoperiod sen- sitivity under the naturally long day conditions [22,42]. TA is affected by developmental phase changes [39,40]. Therefore, it was thought that W107 plants could not fully achieve the smallest degree of TA at 3 MATs, due to the relative delay of developmental schedule of W107 to the survey time. Second, the cool climates suppress growth rate of W107, due to the weak tolerance of W107 against low temperatures in the vegetative-plant devel- opments [22,51,52]. As a result, even in the late-plant development, W107 under the low-temperatures would not realize a tall stature as identified in the warm region [27,42]. The two points emphasize the usefulness of W107RILs for the analyses of developmental perform-
ances, which are controlled by the genetic factor(s) of AFW rice, in Hokkaido islands. It is because the RILs are, in a sense, regarded as a result that chromosomal segments of AFW rice were randomly inserted into the genome of a cultivar that has been fitted to the environ- ments of Hokkaido.
The three characters, TA, APH and WDS, were com- pared between the two classes of out- and in-point geno- types of RILs. Out-point (or in-point) genotype was de- fined as the genotype showing out-point (or in-point) in
Figures 1(a), (b). As expected, compared with in-point-
[image:11.595.138.457.102.386.2]showed no significance (Figure 2(b)). Since out-point- genotype class changed larger in the two traits, APH and TA, than in-point-genotype one during the period, Fig-
ure 2(b) suggests a possibility that the dynamics of
vegetative plant architecture might be associated with the changes of CA.
To know how DC-TA and DC-APH affect SC-WDS in the variation of RILs, we carried out multiple-regres- sion analyses (model: Y = a0 + a1X1 + a2X2, Y = SC-WDS, X1 = DC-TA, X2 = DC-APH; N = 35). The regression
equation under H and L condition was expressed by Y = –0.831 + 0.506X1 + 0.006X2 (a1, P < 0.01; a2, P = 0.566; R2
= 0.225) and Y = –0.506 + 0.166X1 + 0.028X2 (a1, P =
0.324; a2, P < 0.05; R2 = 0.200), respectively. The results
suggest the two points. First, the developmental changes might affect the dynamics of CA against weeds (i.e. SC- WDS) regardless of density condition. Second, the statis- tical significances of partial-regression coefficient (i.e.a1
and a2) suggest that a developmental change, affecting
SC-WDS, might depend on density conditions. It is a notable result that developmental change in height (i.e. DC-APH), conferring an ability of canopy domination, might not be associated with the changes in CA under H condition. In Figure 3, the closed circles indicate out- point genotypes. Under H condition, the closed circles were clearly concentrated on the lower left-hand of Fig- ure 3(a). This visually expresses that the out-point geno- types tended to change their vegetative plant architec- tures from flat to elect shape and decrease amount of weeds. Under L condition, the closed circles were con- centrated on the lower right-hand of Figure 3(b), indi- cating that the out-point genotypes tended to show high rates of change in APH and decrease the amount of
weeds.
3.3. QTL Analysis under High-Density Condition
Under H condition, RM481 on Ch 7 might be nearly linked to a QTL associated with SC-WDS (named qSC-
WDS(H)7) (Table 4). In addition, one of the two QTLs, associated with DC-TA, was also nearly linked to RM481 (named qDC-TA(H)7) (Table 4). It suggests a possibility that qSC-WDS(H)7 and qDC-TA(H)7 might be a same locus. Here, i-allele of qDC-TA(H)7 was A-allele (Table 4). If the two QTLs are identical, i-allele of qSC-WDS(H)7 should be A-allele. It is because DC-TA significantly affected SC-WDS with showing positive regression co- efficient (Figure 3(a)). As expected, i-allele of qSC-
WDS(H)7 was A-allele (Table 4). Therefore, the two QTLs might be regarded as a single Mendelian factor. This leads to a possibility that only W-allele on qDC-
TA(H)7 might contribute to decrease of WDS (or an in- creased level of CA against weeds) thorough controlling the most drastic change of TA toward narrow plant shape.
Another QTL associated with DC-TA (named qDC-
TA(H)5) might be linked to RM289 on Ch 5 but no QTL associated with SC-WDS was detected around RM289 under H condition (Table 4). In the four-marker-geno- type classes associated with DC-TA under H condition, only the genotype class with W-alleles on RM481, aver- agely showed the remarkable decrease of TA during the period from 2 to 3 MATs (Figure 4(a)). This indicates that only plants with the marker genotype tended to dras- tically change the vegetative plant architecture from flat to elect shape. In addition, the genotypes (see circles with
Table 4. The results of non-parametric quantitative trait locus (QTL) analysis of the three characters, seasonal change of weed denseness score (SC-WDS), developmental change of tiller angle (DC-TA) and developmental change of actual plant height (DC-APH), under high-density condition.
SC-WDSa DC-TAa DC-APHa
Marker (Ch) Position Kb P Allelec K P Allele K P Allele
RM5536 (1) 124.2 - - - - - - 13.451 <0.0005 W
RM289 (5) 52.9 - - - 8.531 <0.005 W - - -
RM481 (7) 10.2 9.249 <0.005 A 8.933 <0.005 A - - -
RM547 (8) 37.9 - - - - - - 8.805 <0.005 W
R10143 (9) 27.3 - - - - - - 8.281 <0.005 A
a
WDS indicates weed-denseness score ranging from zero (no weed) to nine (the highest degree of denseness of weeds). SC-WDS was defined as the subtraction of WDS at 2 months after transplanting (MATs) from WDS at 3 MATs. TA is an index of tiller angle, measured by degrees from one (elect type) to five (flat type). APH indicates actual plant height (cm), defined as the height from the ground to the highest part of vegetative body in the natural shape. DC-TA (or DC-APH) was defined as the subtraction of TA (or APH) at 2 MATs from TA (or APH) at 3 MATs. bK is the statistic of Kruskal-Wallis analysis, which can be
regarded as non-parametric equivalent of the one-way analysis of variance. In the table, only the peak value of K was shown, although significant K (P < 0.05) were usually detected in the marker loci around the marker locus showing the peak value. cW and A indicates the allele derived from W107 (an annual-form-
wild rice) and A58 (a Hokkaido cultivar), respectively. The marker genotype class with the represented allele at a focal marker locus significantly expresses larger average rank than that with another allele. It was supposed that a QTL and the linked marker locus might share chromosomal segment derived from same parent in each of recombinant-inbred lines. Hence, the allele contributing to larger average rank on the linked QTL was estimated from the represented allele in is table. The allele on the linked QTL is called i-allele (i is abbreviation of increasing) in the sense that the allele contributes to the increase of the trait value. th
W in Figure 3(a)) tended to decrease TA and WDS lar- ger than the genotypes that possessed A-alleles (see cir- cles without W in Figure 3(a)) on RM481. The explana- tion rate (ER) was defined as the equation, ER (a focal marker locus) = (number of out-point genotypes with W- allele on the marker locus/number of genotypes with W-allele on the marker locus) × 100(%). As shown in
Figure 3(a), ER (RM481) was the high value with show-
ing 84.6%, suggesting that the outpoint genotypes were mainly characterized by W-allele on qDC-TA(H)7.
As for DC-APH, the three QTLs were detected around RM5536 (on Ch 1), RM547 (on Ch 8) and RM10143 (on Ch 9) under H condition, but each of them did not shared any NMLs with the QTLs associated with DC-TA and SC-WDS (Table 4). It genetically supports the statistical independency of DC-APH with DC-TA and the result of multiple regression analysis under H condition.
3.4. QTL Analysis under Low-Density Condition
Under L condition, RM547 on Ch 8 might be the NML not only linked to a QTL associated with SC-WDS (named
qSC-WDS(L)8) but also linked to a QTL associated with DC-APH (named qDC-APH(L)8) (Table 5). It suggests a possibility that qSC-WDS(L)8 and qDC-APH(L)8 might be a same QTL. Here, i-allele of qDC-APH(L)8 was W- allele (Table 5). If the two QTLs are the same, i-allele of
qSC-WDS(L)8 should be A-allele. Because DC-APH sig- nificantly affected SC-WDS with showing a negative regression coefficient (Figure 3(b)). The result of QTL analysis for qSC-WDS(L)8 was fitted to the requirement
(Table 5). Therefore, the two QTLs might be regarded as
a single Mendelian factor. The other two QTLs associ- ated with DC-APH were detected around RM5536 (on Ch 1) and R10143 (on Ch 9) under L condition (Table 5). Like the result of comparative analysis of developmental behavior among the marker-genotype classes under H condition (Figure 4(a)), it was expected that only the marker-genotype class with W-alleles on RM547 might show the most drastic increase of APH among the six- marker-genotype classes under L condition. Against the
expectation, such developmental behavior was expressed by the class with W-alleles on RM5536 (Figure 4(b)). In addition, the pattern of the class with W-alleles on R10143 was similar to that of the class with W-alleles on RM547. But no QTL associated with SC-WDS was de- tected around both RM5536 and R10143. Therefore, with a viewpoint of marker-genotype analysis, it is negatively suggested that DC-APH might be the primal cause for SC-WDS (or CA change).
3.5. Reexamination of the Trait Conferring Competitive Ability under Low-Density Condition
As expected from the previous studies that treated the relationship between GD and plant height in rice [16,44], GD was significantly correlated with DC-APH under L condition (r = 0.624, P < 0.001, N = 35). GD was also significantly correlated with SC-WDS, and the correla- tion coefficient was higher than that between DC-APH and SC-WDS (Figures 3(b), (c)). Therefore, it seems that SC-WDS might be primarily affected by GD rather than DC-APH. Based on Kawano hypothesis [16] that did not suppose the direct effect of GD on SC-WDS, the result of path analysis showed that DC-APH significantly affect SC-WDS (Figure 5(a)). However, when it was supposed that GD might directly affect SC-WDS, DC-APH did not significantly affect SC-WDS but GD significantly af- fected SC-WDS (Figure 5(b)). In addition, squared mul- tiple correlation of SC-WDS in the path model con- structed by the present study showed higher value than that in Kawano model (Figure 5), indicating appropri- ateness of our model. Therefore, it is suggested that the direct effect of DC-APH on SC-WDS might be apparent and GD might be the primal factor for SC-WDS.
Of the three-chromosomal regions where the QTL as- sociated with DC-APH under L condition were detected
(Table 5), QTLs associated with GD were detected around
RM5536 (linked to qHD1) and RM547 (linked to qHD8) in the previous study using eighty-nine W107RILs in Sapporo [22]. But the QTL associated with SC-WDS
Table 5. The results of non-parametric quantitative trait locus (QTL) analysis of the three characters, seasonal change of weed denseness score (SC-WDS), developmental change of tiller angle (DC-TA) and developmental change of actual plant height (DC-APH), under low-density condition.
SC-WDSa DC-TAa DC-APHa
Marker (Ch) Position Kb P Allelec K P Allele K P Allele
RM5536 (1) 124.2 - - - 12.113 <0.001 W
RM481 (7) 10.2 - - - 8.043 <0.005 A - - -
RM547 (8) 37.9 8.829 <0.005 A - - - 8.400 <0.005 W
R10143 (9) 27.3 - - - 8.942 <0.005 A
a-c
under L condition was detected only around RM547
(Table 5). ANOVA for GD of the present study revealed
that qHD1 did not significantly affect GD but qHD8 sig- nificantly did it under L condition (qHD1, df = 1, MS = 47.413NS; qHD8, df =1, MS = 576.691, P < 0.01; qHD1 × qHD8, df = 1, MS = 47.310NS). In addition, qDC-
APH(L)8 and qHD8 showed same i-allele (i.e. W-allele) (Table 4; Figure 3(c)). That is, the effective QTL asso- ciated with GD was closely linked to a QTL associated with DC-APH only around RM547. Therefore, the cor- relation between DC-APH and GD might be mainly ex- plained by the close linkage between qDC-APH(L)8 and
qHD8, which caused correlation relationships between DC-APH and SC-WDS (Figure 3(b)). As mentioned, i- allele of qHD8 was W-allele. If qHD8 and qSC-WDS(L)8 are identical, i-allele of qSC-WDS(L)8 should be A-allele. Because GD significantly affected SC-WDS with show- ing a negative regression coefficient (Figure 3(c)). The expectation was fitted to the result of QTL analysis for SC-WDS under L condition (Table 5). As shown in Fig-
ure 3(c), ER (RM481) was the high value with showing
64.6%, indicating that at least more than half of out-point genotypes were explained by W-allele on qHD8.
4. Discussion
In the present study, we simultaneously introduced phe- notypic and genetic analyses into the understanding of competition occurring in an identical experimental field. Since this way is not common in plant competition study, we will, at first, mention the flame of demonstration pro- cedure. It involved the four-step analyses as follows. First, using regression analysis, cause-and-effect rela- tionship between a developmental change of a trait and change of CA (i.e. SC-WDS) was estimated (Figure 3). The step is for obtaining a suggestion that developmental change of the target trait might affect change of CA at phenotype level.
Second, using QTL analysis, we detected the chromo- somal region where a QTL associated with the develop- mental change shared an identical NML with a QTL as- sociated with the CA change (Tables 4 and 5).It directs our consciousness to the possibility that the two QTLs might be an identical Mendelian factor.
The consistency of i-allele between two QTLs which shared an identical NML has been regarded as one of evidences for enhancing the possibility that the two QTLs might be identical and show a cause-and-effect relationship in some cases [22,43,53-55]. For instance, when a QTL associated with a yield component such as grain weight is closely linked to another QTL associated with yield and they showed same i-allele, it is intuitively thought that QTL associated with the yield component
will be the cause and the detection of QTL associated with yield will be the effect (or by-product) [53,55]. Such thinking implicitly supposes positive regression rela- tionship between a yield component and yield. Therefore, in the present study, if (1) the sign of regression coeffi- cient (Figure 3) is plus (or minus) and (2) the two QTLs are the same, i-allele of QTL associated with the devel- opmental change should be identical (or different) to (or from) that associated with CA change. The establishment in the third-step analysis genetically suggests that the developmental change in a component trait of vegetative plant architecture might cause CA change. Regression analysis also suggests that the genotypes showing large developmental changes toward a direction might de- crease the amount of weeds at high rates during the late vegetative plant developments (Figures 3(a), (b)). There- fore, the genotype class with the allele functioning to- ward the direction on the QTL associated with a devel- opmental change, which is closely linked to the QTL associated with SC-WDS, should express the largest de- velopmental change among the genotype classes related to the developmental change. The examination is the forth step analysis (Figure 4). When all the four condi- tions were filled, it was thought to be plausible that the developmental change associated with the QTL might primarily account for the phenotypic variation of CA change (or SC-WDS).
The present study prepared the two-density conditions. Under H condition, DC-TA significantly affected SC- WDS (Figure 3(a)), but only one of the two QTLs asso- ciated with DC-TA mostly explained the variation of SC-WDS (Table 4; Figures 3(a) and 4(a)). Therefore, all the QTLs associated with a developmental change, which was estimated as the trait conferring CA against weeds at phenotype level, might not be associated with CA. It suggests that only genetic analysis for a target trait under the assumption that the trait axiomatically confers CA would be incomplete in competition study. A similar example is founded in the relationship between flat plant shape and tolerance against trampling pressure in AFW rice when QTL analyses were carried out [22], suggest- ing that it might not be a rare case that all the QTLs as- sociated with a plant morphology (or development) do not contribute to an ecological function. Until now, to determine an ecological significance of a detected gene (or QTL), it has been only effective way to demonstrate that the gene is associated with latitudinal cline [51,56]. However, the procedure demonstrated in the present study will provide us with another methodology for giv- ing an ecological significance of the detected QTL asso- ciated with morphology (or development).
Dense condition in addition to the initial low fertilizer application will result in low nutrient availability espe- cially during the late vegetative plant development. Such availability suppresses vigorous vegetative plant growth in rice [57,58]. Hence it cannot be expected that canopy domination through rapid increases of plant height con- tributes to CA. As the direct evidence in the present study, increase of APH could not contribute to decrease of WDS under H condition (Figure 3(a); Table 4). This accords with the previous ecological study that mortality of AFW rice during the late plant development was not significantly correlated with plant height under weedy semi-natural conditions in the tropical region although weeds grew taller [6]. Therefore, under a dense condition, it could be an adaptive strategy that the efficiency of capturing light is elevated by the developmental changes in tillers from wide to narrow angle in the environmental situation that rice plants are surrounded by monocot spe- cies that do not severely dominate the canopy in contrast to dicot one [59]. This inference is fitted to the ecological situation that AFW-rice plants could mainly coexist with various glass species in temporary swamps (indicating low-nutrient availability) in their habitats [3,4].
Although there is difference in species composition in plant community between natural habitats of AFW rice and the present experimental field [3], the present finding provides an important implication as to evolutionary process of the developmental change in vegetative plant architecture of AFW rice. With the ecological records in natural habitats of AFW rice [3-5], the previous QTL analysis suggested that flat-plant shape of AFW rice during the early plant development might have been evolved under trampling pressures [22]. While the pre- sent study suggests that the change in TA during the late plant development might be associated with competition under a dense condition (Figures 3(a) and 4(a); Table 4). Therefore, it is suggested that heterogeneous selective pressures in life time might have evolved the develop- mental change. Both qTA7 that W-allele contributed to flat-plant shape during the early plant development [22] and qDC-TA(H)7 that W-allele contributed to large changes in plant shape during the late one (Figure 4) were nearly linked to the molecular marker, RM481, on the short arm of Ch 7 (Table 4). In addition, PROG1 (Prostrate growth
1) gene identified from a wild rice strain controlled the developmental changes from prostrate to elect growth habit, and was also closely linked to RM481 [40]. These suggest a possibility that the three loci, qTA7, qDC-
TA(H)7 and PROG1, might be same locus. If it is true, the two-different selective pressures might have evolved a single gene controlling the developmental change.
Previous competition studies of rice showed that GD was correlated with the plant height that was also corre-
lated with CA against weeds under L conditions [16,44]. Based on the dominant concept that plant height plays the primal role in competition (or canopy domination) in rice [12-14], Kawano conceptually introduced the cause- and-effect relationships into the two correlations [16]. That is, a long GD indirectly increases the level of CA through the direct contribution to a large plant height (see
Figure 5(a)). The present study also showed that rapid
increases in APH might largely contribute to suppression of the growth of weeds (Figure 3(b)). This is well fitted to common nature of competition in herbaceous plants [20,21,59]. However, when genetic analysis was used for reexamination of the regression relationship, this was negatively suggested by the fourth-step analysis of the present demonstration procedure (Figure 4(b)). In addi- tion, the present path analysis revealed that GD directly affected change of CA (or SC-WDS) but the plant de- velopment toward vertical direction (i.e. DC-APH) did not significantly elevate CA during the late vegetative plant development (Figure 5(b)). Hence we checked QTLs associated with GD in the previous QTL mapping [22] and founded that qHD8 shared an identical NML (i.e. RM547) with qSC-WDS(L)8. The relationship of
i-allele of the two QTLs also filled with the requirement of regression analysis between GD and SC-WDS (Figure
3(c); Table 5). These results suggest that GD might di-
rectly affect CA change. It is noted that the positive cor- relation coefficient between GD and DC-APH might be merely due to close linkage between the two-major QTLs,
qHD8 and qDC-APH(L)8, in the present study (Figures 3(b), (c)). Therefore, there is a possibility that Kawano might misinterpret the associations among the three traits, due to the close linkage between genes associated with GD and plant height. The present result of L condition provided us with an example that genetic analysis will be effective for reexamining a classic hypothesis of compe- tition based on phenotypic analysis.
In competition studies of herbaceous plants, GD has been rarely regarded as a major factor for conferring CA [46]. Hence the physiological role of GD in competition has been still unclear. Bulm demonstrated that sorghum varieties (Sorghum bicolor L. Moench.) with showing long GD could not help severely scrambling for the poor water resource during the late plant development [46]. In common paddy field, the primal and secondary environ- mental factor associated with competition is light and nutrient, respectively [16]. As inferred from Bulm’s study, the rice strains maintaining long vegetative developments might be higher in the ability for depriving the poor nu- trient resource than the annual weeds that transited to reproductive developments at a similar timing of the rice cultivars [19,60].
QTL associated with CA might depend on density condi- tions even under an identical field, emphasizing need of consideration for conditionality in plant competition study as Sakai pointed out [11]. Under L condition which is not common environment for AFW rice [3,5], the drastic change of TA possessed by AFW rice was not associated with CA change (Table 5). This result cor-roborates that the changes of TA shown by AFW rice would be the product of natural selection since AFW rice grows under dense conditions especially in the late plant development. Natural selection favors integrating fit- ness-related genes into a chromosomal region [61,62].
Ssv (Short stature only in the vegetative phase) on short arm of Ch 7 (i.e. around RM481) was known as a major chromosomal region where fitness-related genes charac- terizing AFW rice were linked each other [22,23,27,43]. Phenotypic plasticity was associated with CA in natural habitat of wild rice [6], and at least two-major QTLs as- sociated with density response have recently been located on Ssv chromosomal region [43]. The present study also suggest that qDC-TA(H)7 associated with competition might be located on same region (Table 4). Therefore, it is implied that competition itself as one of selective forces might act on integrating CA-related genes into a chromosomal region in AFW rice.
5. Acknowledgements
The genetic materials preserved in Hokkaido University were received from emeritus professor, Yoshio Sano (Research Group of Breeding Science, Division of Ap- plied Bioscience, Research Faculty of Agriculture, Hok- kaido University) with his permission that the materials is limited to use for the studies associated with Y. Itoh. The technical supports were kindly provided by his stu- dents, Mr. Masamichi Maruoka, Naofumi Ichikawa and Dr. Kazumitsu Onishi (Obihiro University of Agriculture and Veterinary Medicine). We also thank Mr. Norihiro Nagano (Field Science Center for Northern Biosphere, Hokkaido University) and Dr. Naohiro Uwatoko (NARO, Kyushu Okinawa Research Center) for their assistance in making our manuscript. Y. Itoh thanks Miss Yoshie Sato (GUST, Fukuzumi), Miss Akane Tojima, Ms Maki Sai- toh, Mr. Satoshi Saitoh, Drs. Hiroshi Yorozuya, Yoshi- kazu Sato and Kazutoshi Mori (Brown Bear Research Group of Hokkaido University) for their encouragement and discussions about the present study. This work was supported from Northern Advancement Center for Sci- ence & Technology and Akiyama Life Science Founda- tion.
REFERENCES
[1] H.-I. Oka and H. Morishima, “Variations in the Breeding
Systems of a Wild Rice, Oryza perennis,” Evolution, Vol. 21, No. 2, 1967, pp. 249-258. doi:10.2307/2406673 [2] Y. Sano and H. Morishima, “Variation of Resource
Allo-cation and Adaptive Strategy of Wild Rice, Oryza peren-nis Moench,” Botanical Gazette, Vol. 143, No. 4, 1982, pp. 518-523. doi:10.1086/337330
[3] Y. Sano, H. Morishima and H.-I. Oka, “Intermediate Per-ennial-Annual Populations of Oryza perennis Found in Thailand and Their Evolutionary Significance,” Journal of Plant Research, Vol. 93, No. 4, 1980, pp. 291-305. doi:10.1007/BF02488735
[4] H.-I. Oka, “Origin of Cultivated Rice,” Elsevier, Tokyo, 1988.
[5] D. A. Vaughan, K. I. Kadowaki, A. Kaga and N. To-mooka, “On the Phylogeny and Biogeography of Genus Oryza,” Breeding Science, Vol. 55, No. 2, 2005, pp. 113- 122. doi:10.1270/jsbbs.55.113
[6] H.-I. Oka, “Mortality and Adaptive Mechanisms of Oryza perennis Strains,” Evolution, Vol. 30, No. 2, 1976, pp. 380-392. doi:10.2307/2407707
[7] H.-I. Oka, “Ecology of Seed Survival and Germination in the Common Wild Rice,” In: F. Jiarui and H. Khan, Eds., Advanced Seed Science and Technology, Science Press, New York, 1990, pp. 244-249.
[8] H.-I. Oka, “Ecology of Wild Rice Planted in Taiwan. I. Sequential Distribution of Species and Their Interactions in Weed Communities,” Botanical Bulletin of Academia Sinica, Vol. 32, 1991, pp. 287-293.
[9] H.-I. Oka, “Ecology of Wild Rice Planted in Taiwan. II. Comparison of Two Populations with Different Geno-types,” Botanical Bulletin of Academia Sinica, Vol. 33, 1992, pp. 75-84.
[10] H.-I. Oka, “Ecology of Wild Rice Planted in Taiwan. III. Differences in Regenerating Strategies among Genetic Stocks,” Botanical Bulletin of Academia Sinica, Vol. 33, 1992, pp. 133-140.
[11] K.-I. Sakai, “Competitive Ability in Plants: Its Inheri-tance and Some Related Problems,” Symposia of the So-ciety for Experimental Biology, Cambridge, Vol. 15, No. 15, 1961, pp. 245-263.
[12] P. R. Jennings and R. C. Aquino, “Studies on Competi-tion in Rice. III. The Mechanisms of CompetiCompeti-tion among Phenotypes,” Evolution, Vol. 22, No. 3, 1968, pp. 529- 542.
[13] P. R. Jennings and R. M. Herrera “Studies on Competi-tion in Rice. II. CompetiCompeti-tion in Segregating PopulaCompeti-tions,” Evolution, Vol. 22, No. 2, 1968, pp. 332-336.
[14] P. R. Jennings and J. de Jesus Jr., “Studies on Competi-tion in Rice. I. CompetiCompeti-tion in Mixtures of Varieties,” Evolution, Vol. 22, No. 1, 1968, pp. 119-124.
[15] M. Takahashi, “The History and Future of Rice Cultiva-tion in Hokkaido,” 1980.
http://d-arch.ide.go.jp/je_archive/pdf/workingpaper/je_un u22.pdf