TAXONOMY OF SOCIAL
1,*
Rosenda
1
Extension Coordinator, Jose
2
College of Arts and Sciences,
ARTICLE INFO ABSTRACT
This study descriptive the study Zamboanga 240 parent district. revealed acceptability curriculum of acceptance Program recommended students. them aware should
Copyright © 2018, Rosenda B. Borres and Daisy P. Ruiz
permits unrestricted use, distribution, and reproduction
INTRODUCTION
K-12 is a new curriculum that covers kindergarten years of senior high school (six years of primary four years of junior high school and two years school). This seeks to develop a progressive, society. Luistro (2011) said that the K to 12 students more time to master competencies highly doubtable that students will master anything lacks of the education sector. Kindergarten
integrated into the basic education system grade I pupils are ready for academic kindergarten to Grade III, the mother tongue medium of instruction. This includes the following: Kapampangan, Pangasinense, Ilokano, Cebuano, Waray, Tausug and Chabakano. It is believed plays a strategic role in shaping the formative So, when instruction is delivered in languages learners, the teacher-learning process is effective. complete standard-based kindergarten program
*Corresponding author: Rosenda B. Borres,
Extension Coordinator, Jose Rizal Memorial State Dipolog City, Philippines.
ISSN: 0975-833X
Article History:
Received 29th December, 2017
Received in revised form 29th January, 2018
Accepted 12th February, 2018
Published online 30th March, 2018
Citation: Rosenda B. Borres and Daisy P. Ruiz, 201
Journal of Current Research, 10, (03), 67278-67282. Key words:
Social Acceptability, K to R Basic Education Program Taxonomy, Indicators, Curriculum.
RESEARCH ARTICLE
SOCIAL ACCEPTABILITY INDICATORS FOR
BASIC EDUCATION PROGRAM
Rosenda B. Borres and
2Daisy P. Ruiz
Jose Rizal Memorial State University, Dipolog City,
Sciences, Jose Rizal Memorial State University, Dipolog
ABSTRACT
study aimed to find out the taxonomy of social acceptability descriptive survey design utilizing a questionnaire-checklist was used
study were teachers and parents of selected Public Elementary Zamboanga del Norte during the School Year 2015 – 2016. There
parent-respondents employed in the study. Out of 240 respondents, district. The statistical tools used in the study were the frequency revealed that the teachers and parents have different views
acceptability indicators of K to 12 Program with respect to pupil development, curriculum relevance and material resources. This implies that they
acceptance of the program. The most encountered problems Program were in sufficient facilities and equipment and lack
recommended that additional classrooms should be built for accommodation students. Parents should be well-informed on the implementation
aware of the quality of education being given to their children. should be provided in the implementation of K to 12 Curriculum for
Ruiz. This is an open access article distributed under the Creative in any medium, provided the original work is properly cited.
kindergarten and twelve primary education, years of senior high progressive, just and humane 12 promises to give and skills yet it is anything given the has now been to ensure that all academic learning. From tongue will be the following: Tagalog, Cebuano, Hiligaynon, believed that language formative years of learners. languages understood by effective. Children who program
State University,
will be better prepared for primary that in education lies the future then that the students be educated individuals’ as well societal additional two years (Grade school will allow students technical-vocational or sports and interest, the community needs, assessment. The senior high school competencies for lifelong learning higher education, middle-level entrepreneurship. Based on DepEd have not met the standards required an international level. Our country and Science in international test in International Mathematics achievement scores of the Filipino the poor quality of basic education especially because the current 12-year curriculum is delivered curriculum will provide sufficient and skills develop lifelong learners tertiary education, middle employment and entrepreneurship.
International Journal of Current Research Vol. 10, Issue, 03, pp.67278-67282, March, 2018
2018. “Taxonomy of social acceptability indicators for k to 12 basic education program
FOR K TO 12
City, Philippines
Dipolog City, Philippines
indicators for K to 12 Program. The used in the study. The respondents of Elementary Schools in the three districts of There were 240 teacher-respondents and respondents, 80 were taken in every frequency and percentage count. The study regarding the taxonomy of social development, teachers’ preparedness, they have different priorities and level in the implementation of K to 12 of awareness among parents. It is accommodation of incoming bulk of implementation for K to 12 Curriculum to make children. Adequate physical facilities for better teaching-learning process.
Creative Commons Attribution License, which
primary education. Gatmaitan said future of a society; it is appropriate educated properly, because their societal growth depends in it. The 11 and 12) or the senior high to choose among academic, and art tracks depending on their needs, and the results of skills school will allow mastery of core learning and preparedness for work, level skills development or DepEd findings, the Philippines required of students to compete on country ranks lowest in Mathematics test such as 2003 TIMSS (Trends and Science Study). The low Filipino students can be attributed to education in our schools, more current basic education designed as a delivered in just 10 years. The K-12 sufficient time for mastery of concepts learners and prepare graduates for middle-level skills development, entrepreneurship. Moreover, Del Mundo,
INTERNATIONAL JOURNAL OF CURRENT RESEARCH
(2006) said that teacher training and hiring current DedpEd teachers will be retained to meet the content and performances standards of the new K to 12 curriculum. The researchers’ motivation to conduct this study is conceived with the aim of finding out the taxonomy of social acceptability indicators of teachers and parents on the K to 12 program’s implementation since these two sectors are directly affected by it. Also knowing the extent of the K to 12 program’s implementation and how its implementers take part in the said implementation.
Conceptual/Theoretical Framework
This study is anchored on the Instructional Theory that offers explicit guidance on how to better help people learn and develop. Instructional theories focus on how to structure material for promoting the education of human beings, particularly youth. Originating in the United States in the late 1970s, this theory is typically influenced by three general influences in educational thought: the behaviorist, the cognitive, and the constructivist schools of thought. Instructional theory is heavily influenced by the 1956 work of Benjamin Bloom, a University of Chicago professor, and the results of his Taxonomy of Education Objectives — one of the first modern codifications of the learning process. One of the first instructional theorists was Robert M. Gagne, who in 1965 published Conditions of Learning for the Florida State University's Department of Educational Research. Instructional theory is the potential of learning objects to deliver content. A stand-alone educational animation is an example of learning object that can be re-used as the basis for different learning experience.
Research Design and Method
The study utilized the descriptive survey design utilizing a questionnaire-checklist. The questionnaire consisted items on the taxonomy of social acceptability indicators for K to 12 Program as perceived by teachers and parents with respect to pupil development, teacher’s preparedness, curriculum relevance and material resources.
The respondents of the study were teachers and parents of selected Public Elementary Schools in the three districts of Zamboanga del Norte during the School Year 2015 – 2016. There were 240 teacher-respondents and 240 parent-respondents employed in the study. Out of 240 parent-respondents, 80 were taken in every district. They were chosen through random sampling. The statistical tools used in the study were the frequency and percentage count.
RESULTS AND DISCUSSION
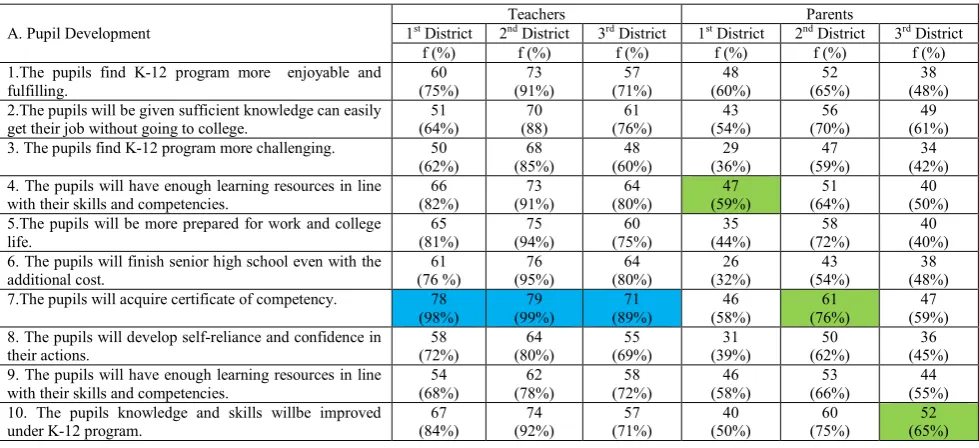
[image:2.595.52.542.545.769.2]Table 1 showed that the teachers in the three districts have the same views on the social acceptability indicators of K to 12 Program with respect to pupil development. This implies that their responses go along with TESDA’s Agenda that right after they have completed the needed competencies they will acquire certificate of competency. Meanwhile, parents and teachers do differ on social acceptability on K to 12 Program in terms of pupil development. This implies that parent-respondents are précised with developing the skills and competencies of their children while the teacher-respondents are particular in the pupils’ acquisition of certificate of competency. This finding corroborates the study of Forbes (2012) which stressed that with K to 12, students are given opportunity to acquire Certificates of Competency and National Certificates in accordance with TESDA training regulations thus allowing graduates to have middle level skills which will offer them better opportunities to be gainfully employed. Table 2 shows the social acceptability indicators for K to 12 Program with respect to teachers’ preparedness. The findings showed that teacher-respondents are concerned with developing their professional attributes while parent-respondents are concerned on the outputs of the teachers after attending the trainings/seminars. This implies that the perceptions of the teacher-respondents are positive that the program will be effective in achieving its goals. Since the teachers are the ones who will receive trainings on the additional two years of the curriculum.
Table 1. Taxonomy of Social Acceptability Indicators for K to 12 Program in Terms of Pupil Development
A. Pupil Development
Teachers Parents
1st District 2nd District 3rd District 1st District 2nd District 3rd District
f (%) f (%) f (%) f (%) f (%) f (%) 1.The pupils find K-12 program more enjoyable and
fulfilling.
60 (75%)
73 (91%)
57 (71%)
48 (60%)
52 (65%)
38 (48%) 2.The pupils will be given sufficient knowledge can easily
get their job without going to college.
51 (64%)
70 (88)
61 (76%)
43 (54%)
56 (70%)
49 (61%) 3. The pupils find K-12 program more challenging. 50
(62%)
68 (85%)
48 (60%)
29 (36%)
47 (59%)
34 (42%) 4. The pupils will have enough learning resources in line
with their skills and competencies.
66 (82%)
73 (91%)
64 (80%)
47 (59%)
51 (64%)
40 (50%) 5.The pupils will be more prepared for work and college
life.
65 (81%)
75 (94%)
60 (75%)
35 (44%)
58 (72%)
40 (40%) 6. The pupils will finish senior high school even with the
additional cost.
61 (76 %)
76 (95%)
64 (80%)
26 (32%)
43 (54%)
38 (48%) 7.The pupils will acquire certificate of competency. 78
(98%)
79 (99%)
71 (89%)
46 (58%)
61 (76%)
47 (59%) 8. The pupils will develop self-reliance and confidence in
their actions.
58 (72%)
64 (80%)
55 (69%)
31 (39%)
50 (62%)
36 (45%) 9. The pupils will have enough learning resources in line
with their skills and competencies.
54 (68%)
62 (78%)
58 (72%)
46 (58%)
53 (66%)
44 (55%) 10. The pupils knowledge and skills willbe improved
under K-12 program.
67 (84%)
74 (92%)
57 (71%)
40 (50%)
60 (75%)
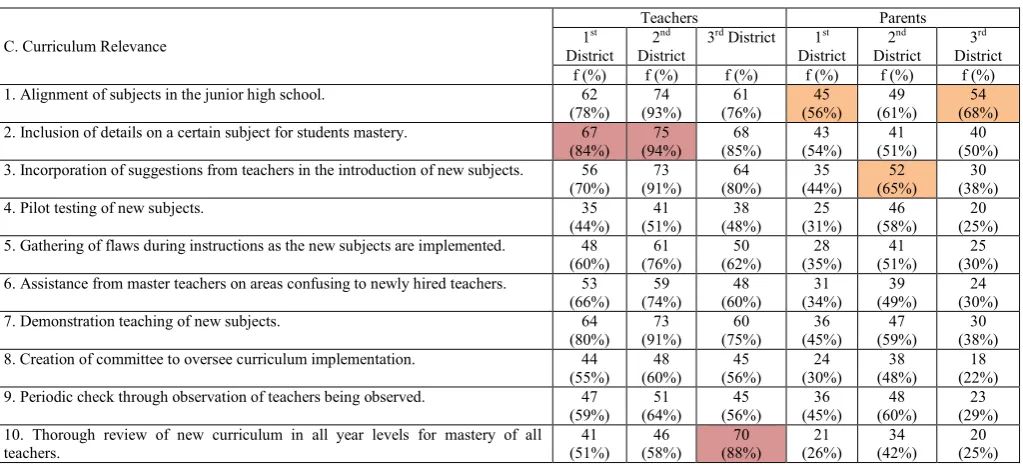
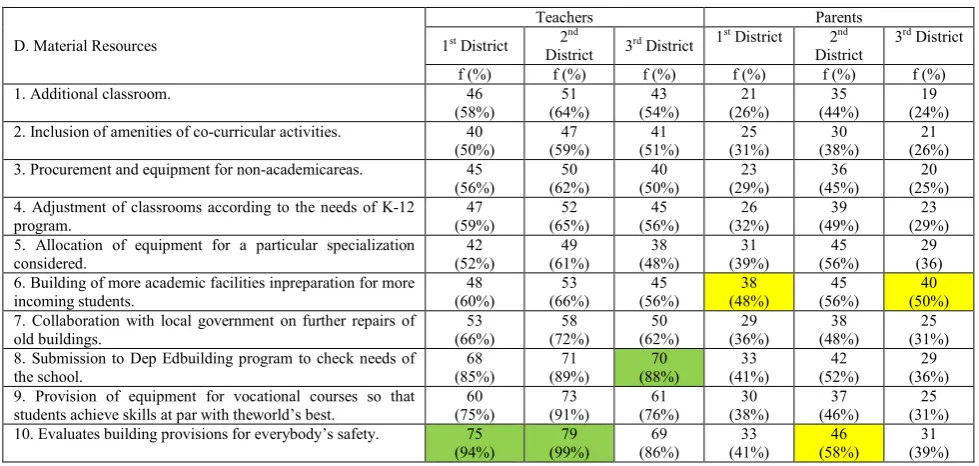
This result disputes the study of Crisol, et.al (2014) where he stated that teachers are not prepared because they think they are not equipped with trainings and facilities that will make effective for the program. Table 3 presents the responses of the two groups of respondents on the social acceptability indicators for K to 12 Program with respect to curriculum relevance. The findings show that teacher-respondents are very particular with the content of the curriculum compared to parent-respondents who are concerned only with the alignment of subjects in the K to 12 Curriculum. This means that the two groups have different levels of acceptability in terms of curriculum relevance. These imply that teachers consider the bits of details in the K to 12 Curriculum and focused on the content of the curriculum while parents are concerned on the orientation of the subjects. Table 4 presents the responses of the two groups of respondents on the social acceptability indicators for K to 12 Program with respect to material resources. 1st district, 2nd district teacher-respondents and 2nd district parent-respondents
[image:3.595.39.551.82.314.2]believed the importance on the evaluation of building provisions for everybody’s safety compared to 3rd district teacher-respondents who believed that submission of DepEdbuilding program to check needs of the school. The findings show that 2nd district parent-respondents considered the evaluation or the renovation of school building. On the other hand, 1st and 3rd district parent-respondents said that building of more academic facilities in preparation for more incoming students. Since 1st and 3rd districts are located in the far flung areas and don’t have adequate infrastructure facilities to accommodate students. These implies that majority of the parent-respondents are concerned with the construction of more academic facilities while teacher-respondents are concerned with the durability of the building being built for everybody’s safety. The result corroborates on the International Review of Education (Vol. 62,pp187-204) which stressed that without improvement in material and human resources, adult trainees will continue to experience difficulties integrating into the
Table 2. Taxonomy of Social Acceptability Indicators for K to 12 Program in Terms of Teachers Preparedness
B. Teachers Preparedness
Teachers Parents
1st District 2nd
District
3rd District 1st District 2nd
District
3rd District
f (%) f (%) f (%) f (%) f (%) f (%) 1. Preparedness of teachers’ attendance to national seminars on K-12. 61
(76%) 67 (84%) 60 (75%) 31 (39%) 44 (55%) 39 (49%) 2. Participation of teachers to regional trainings on K-12 program. 75
(94%) 75 (94%) 70 (88%) 39 (49%) 46 (58%) 43 (54%) 3. Attendance to local and in-house forum on K-12 for teachers. 67
(84%) 63 (79%) 68 (85%) 36 (45%) 40 (50%) 28 (35%) 4. Monitoring of teachers attendance to trainings done to check
participation. 64 (80%) 66 (82%) 60 (75%) 28 (35%) 33 (41%) 34 (42%) 5. Performance evaluation of teachers during thetraining on K-12. 66
(82%) 69 (86%) 68 (85%) 41 (51%) 58 (72%) 45 (56%) 6. Achievement of target goals at the end of the sessions is part of the
requirement. 73 (91%) 76 (95%) 71 (89%) 40 (50%) 61 (76%) 40 (50%) 7. Buddy system to monitor teachers’ performance during the training is
observed. 61 (76%) 63 (79%) 67 (84%) 45 (56%) 48 (60%) 43 (54%) 8. Newly-hired teachers are exposed to trainings and seminars on K-12. 73
(91%) 78 (98%) 70 (88%) 32 (40%) 60 (75%) 27 (34%) 9. Performance of teachers during the seminarsand trainings are evaluated
as part of their annual appraisal.
63 (79%) 69 (86%) 70 (88%) 43 (54%) 62 (78%) 47 (59%) 10. Begins and ends the seminars and trainings equipped with knowledge
on K-12 program.
70 (88%) 73 (91%) 68 (85%) 35 (44%) 44 (55%) 30 (38%)
Table 3. Taxonomy of Social Acceptability Indicators for K to 12 Program in Terms of Curriculum Relevance
C. Curriculum Relevance
Teachers Parents 1st
District 2nd
District
3rd District 1st
District 2nd
District 3rd
District f (%) f (%) f (%) f (%) f (%) f (%) 1. Alignment of subjects in the junior high school. 62
(78%) 74 (93%) 61 (76%) 45 (56%) 49 (61%) 54 (68%) 2. Inclusion of details on a certain subject for students mastery. 67
(84%) 75 (94%) 68 (85%) 43 (54%) 41 (51%) 40 (50%) 3. Incorporation of suggestions from teachers in the introduction of new subjects. 56
(70%) 73 (91%) 64 (80%) 35 (44%) 52 (65%) 30 (38%) 4. Pilot testing of new subjects. 35
(44%) 41 (51%) 38 (48%) 25 (31%) 46 (58%) 20 (25%) 5. Gathering of flaws during instructions as the new subjects are implemented. 48
(60%) 61 (76%) 50 (62%) 28 (35%) 41 (51%) 25 (30%) 6. Assistance from master teachers on areas confusing to newly hired teachers. 53
(66%) 59 (74%) 48 (60%) 31 (34%) 39 (49%) 24 (30%) 7. Demonstration teaching of new subjects. 64
(80%) 73 (91%) 60 (75%) 36 (45%) 47 (59%) 30 (38%) 8. Creation of committee to oversee curriculum implementation. 44
(55%) 48 (60%) 45 (56%) 24 (30%) 38 (48%) 18 (22%) 9. Periodic check through observation of teachers being observed. 47
(59%) 51 (64%) 45 (56%) 36 (45%) 48 (60%) 23 (29%) 10. Thorough review of new curriculum in all year levels for mastery of all
[image:3.595.41.553.353.588.2]labour market, and the cycle of poverty and social exclusion will remain unbroken. Table 5 shows the problems encountered on the implementation for K to 12 Program.
Teacher-respondents have common problem encountered such as insufficient facilities and equipment as well as 2nd district parent-respondents. Meanwhile 1st and 3rd district parent-respondents also have common problem encountered such as lack of awareness in the implementation of K to 12 Program. The findings showed that teacher and parent respondents differed on the problems encountered in the implementation of K to 12 Program. This implies that the burden is shouldered more on the teachers compare to parents whose concern is only on the awareness of the program. The finding corroborates the report of Legaspi (2014), GMA News where she stressed that
the unavailability of learning materials is just one of the problems still hounding the country’s new basic education program, K to 12, in the last three years of its implementation.
[image:4.595.54.544.120.353.2]Table 6 shows the summary on the taxonomy of social acceptability indicators for K to 12 Program in terms of pupil development, teachers’ preparedness, curriculum relevance and material resources. The findings show that the two groups of respondents have different views on the social acceptability indicators for K to 12 Program. This means that they have different priorities and level of acceptance of the program. This implies that the level of acceptance of the parent-respondents is very low as compared to the level of acceptance of the teacher-respondents with respect to the social acceptability indicators. Teachers are more focused on the teachers’ preparedness while
Table 4. Taxonomy of Social Acceptability Indicators for K to 12 Program in Terms of Material Resources
D. Material Resources
Teachers Parents
1st District 2nd
District 3
rd District 1st District 2nd
District
3rd District
f (%) f (%) f (%) f (%) f (%) f (%) 1. Additional classroom. 46
(58%)
51 (64%)
43 (54%)
21 (26%)
35 (44%)
19 (24%) 2. Inclusion of amenities of co-curricular activities. 40
(50%)
47 (59%)
41 (51%)
25 (31%)
30 (38%)
21 (26%) 3. Procurement and equipment for non-academicareas. 45
(56%)
50 (62%)
40 (50%)
23 (29%)
36 (45%)
20 (25%) 4. Adjustment of classrooms according to the needs of K-12
program.
47 (59%)
52 (65%)
45 (56%)
26 (32%)
39 (49%)
23 (29%) 5. Allocation of equipment for a particular specialization
considered.
42 (52%)
49 (61%)
38 (48%)
31 (39%)
45 (56%)
29 (36) 6. Building of more academic facilities inpreparation for more
incoming students.
48 (60%)
53 (66%)
45 (56%)
38 (48%)
45 (56%)
40 (50%) 7. Collaboration with local government on further repairs of
old buildings.
53 (66%)
58 (72%)
50 (62%)
29 (36%)
38 (48%)
25 (31%) 8. Submission to Dep Edbuilding program to check needs of
the school.
68 (85%)
71 (89%)
70 (88%)
33 (41%)
42 (52%)
29 (36%) 9. Provision of equipment for vocational courses so that
students achieve skills at par with theworld’s best.
60 (75%)
73 (91%)
61 (76%)
30 (38%)
37 (46%)
25 (31%) 10. Evaluates building provisions for everybody’s safety. 75
(94%)
79 (99%)
69 (86%)
33 (41%)
46 (58%)
[image:4.595.72.524.379.522.2]31 (39%)
Table 5. Problems Encountered on the Implementation of K to 12 Program
Problems
Teachers Parents
1st District 2nd
District 3
rd District 1st District 2nd
District
3rd District
f (%) f (%) f (%) f (%) f (%) f (%) 1. Inattentiveness of pupils 31 39 34 40 45 49 2. Pupils inappropriate behavior 20 32 38 38 40 48
3. Lack of classrooms 57 50 60 68 61 72
4. Lack of reference materials 69(3) 57(3) 72(3) 76(2.5) 67 80(1.5)
5. Lack of pupil’s participation in class Discussion 35 24 36 45 35 41 6. Absenteeism among pupils 39 29 43 40 41 45 7. Inadequate textbooks 71(2) 60(2) 74(2) 71 65(3) 74
8. Insufficient facilities and equipment 78(1) 70(1) 79(1) 76(2.5) 72(1) 78(3)
9. Poor study habits 41 35 46 51 41 51
10. Lack of awareness in the K to 12 Program 48 39 50 80(1) 71(2) 80(1.5)
Table 6. Summary Results on the Taxonomy of Social Acceptability Indicators for K to 12 Program
Social Acceptability Indicators
Teachers Parents
1st District 2nd istrict 3rd District 1st District 2nd
District
3rd District
f (%) f (%) f (%) f (%) f (%) f (%)
1. Pupil Development 61 (76%)
71 (89%)
59 (74%)
39 (49%)
53 (66%)
41 (51%) 2. Teachers Preparedness 67
(84%)
70 (88%)
67 (84%)
37 (46%)
50 (62%)
38 (48%) 3. Curriculum Relevance 52
(65%)
60 (75%)
55 (69%)
32 (40%)
44 (55%)
28 (35%) 4. Material Resources 52
(65%)
58 (72%)
50 (62%)
29 (36%)
39 (49%)
the parents give more priority on the development of their children.
Conclusions and Recommendations
Based on the findings, it was concluded that teachers and parents have different views regarding the social acceptability indicators for K to 12 Program. The level of acceptance of the parent-respondents is very low as compared to the level of acceptance of the teacher-respondents with respect to the social acceptability indicators. Parent-respondents are précised with developing the skills and competencies of their children while the teacher-respondents are particular in the pupils’ acquisition of certificate of competency. Moreover, their concerns differ in terms of teachers’ preparedness where teacher-respondents are concerned with developing their professional attributes while parent-respondents are concerned on the outputs of the teachers after attending the trainings/seminars. Teachers are focused on the content of the curriculum while parents are concerned on the orientation of the subjects. Majority of the parent-respondents are concerned with the construction of more academic facilities while teacher-respondents are concerned with the durability of the building built for everybody’s safety. Lastly, the burden in the implementation of K to 12 Program is shouldered more on the teachers compare to parents whose concern is only on the lack of awareness of the program. After thorough examination of the findings and conclusions, the following recommendations are given; Additional classrooms should be built for accommodation of incoming bulk of students.
Parents should be well-informed on the implementation of K to 12 Curriculum to make them aware of the quality of education being given to their children. Adequate physical facilities should be provided in the implementation of K to 12 Curriculum for better teaching-learning process.
REFERENCES
Bellin and Marissa, 2015. Social Acceptability of K-12 Program as Perceived by Selected by Parents and Teachers in Juan Sumolong, Elementary School, Antipolo
City
Forbes and Gilbert, 2012. Benefits of the K to 12 Program of the Department of education, DepEd-Quezon, Region IV-A International Review of Education (Vol. 62, pp187-204) Masing and Clara, 2012. InterAksyon.com, K to 12 Gains
Acceptance.
Quismundo and Tarra, 2012. People Changing Attitude toward K to 12- DepEd.
Uyquiengco, Mariel. Benefits of K to 12 Curriculum for Filipino Students.
Zellman, Gail L. et al., Education Reform, International Education, Persian Gulf Region, Qatar, Teachers and Teaching, West Asia
http://www.rand.org/pubs/monographs/MG880.html www.ched.gov.ph
www.gov.ph/k-1