IMAGE PROCESSING AND NEURAL NETWORK TECHNIQUES IN ASSISTING OF EARLY DETECTION
OF ORAL CANCER
*
Dr. Vivekanandan
School of Electrical Engineering (SELECT), VIT University, Vellore, Tamil Nadu, India
ARTICLE INFO ABSTRACT
Oral cancer is the sixth most common cancer globally and most reported cancer in India with fourteen deaths in an hour on a yearly basis. Oral cancers can be cured with early detection but the biggest hindrances are lack of
leading to delay and errors in the detection process. An effective, semi
this paper has made an attempt towards mitigating the above mentioned issues by techniques like Papanicolaou (Pap) smear, image processing and neural networks.
concern and objective of the system developers is to help cure the menace of oral cancer that is plaguing India and the world. This system is perhaps one
automating the process.
Copyright © 2016, Dr. Vivekanandan and Sehaj Sharma
permits unrestricted use, distribution, and reproduction in any medium, provided the original work is properly cited.
INTRODUCTION
Oral cancer is a class of cancers that occur in different parts of the oral cavity i.e., mouth, throat, tongue. It is the sixth most reported cancer globally out of which 62% of the reported cases are from developing countries. Oral cancers accounts for 30% of all cancers reported in India and annually 1.3 lakh of Indians succumb to oral cancer, which implies 14 deaths per hour. (Ken Russell Coelho, 2012) Most cases of oral cancer can
be cured with early detection. (Maraki et al., 2004;
al., 1998) Most deaths due to cancer are reported from rural
areas. The reason to this being; high illiteracy rate, lack of awareness, the lack of access to medical care and the high cost of treatment. Compounding to the higher rates of incidence of oral cancer is the widespread use of tobacco in smoke (beedi, hookah and cigarettes) and smokeless (gutka, paan, khainni etc.) mediums which is very popular in rural areas. Russell Coelho, 2012) Other major burden in India is regarding the scarce diagnostic infrastructure, crucial investigatory centres and services to the needy, is at paucity. Facilities are significantly higher in the urban areas when compared with the rural inhabitants.
*Corresponding author: Dr. Vivekanandan, S.
School of Electrical Engineering (SELECT), VIT University, Vellore, Tamil Nadu, India- 632014.
ISSN: 0975-833X
Article History:
Received 17th January, 2016
Received in revised form 08th February, 2016
Accepted 24th March, 2016
Published online 26th April,2016
Key words:
Oral cancer, Papanicolaou (Pap) smear, Image processing,
Neural Networks,
Linear Vector Quantisation (LVQ), Early detection.
Citation: Dr. Vivekanandan, S. and Sehaj Sharma
Cancer- A Novel Method”, International Journal of Current Research
RESEARCH ARTICLE
IMAGE PROCESSING AND NEURAL NETWORK TECHNIQUES IN ASSISTING OF EARLY DETECTION
OF ORAL CANCER- A NOVEL METHOD
Vivekanandan, S. and Sehaj Sharma
School of Electrical Engineering (SELECT), VIT University, Vellore, Tamil Nadu, India
ABSTRACT
Oral cancer is the sixth most common cancer globally and most reported cancer in India with fourteen deaths in an hour on a yearly basis. Oral cancers can be cured with early detection but the biggest hindrances are lack of awareness, cost of tests and the immense workload of the cyto
leading to delay and errors in the detection process. An effective, semi
this paper has made an attempt towards mitigating the above mentioned issues by techniques like Papanicolaou (Pap) smear, image processing and neural networks.
concern and objective of the system developers is to help cure the menace of oral cancer that is plaguing India and the world. This system is perhaps one of the first successful attempts at semi automating the process.
Dr. Vivekanandan and Sehaj Sharma. This is an open access article distributed under the Creative Commons Att use, distribution, and reproduction in any medium, provided the original work is properly cited.
Oral cancer is a class of cancers that occur in different parts of the oral cavity i.e., mouth, throat, tongue. It is the sixth most reported cancer globally out of which 62% of the reported cases are from developing countries. Oral cancers accounts for % of all cancers reported in India and annually 1.3 lakh of Indians succumb to oral cancer, which implies 14 deaths per Most cases of oral cancer can
., 2004; Kaugars et
Most deaths due to cancer are reported from rural areas. The reason to this being; high illiteracy rate, lack of awareness, the lack of access to medical care and the high cost of treatment. Compounding to the higher rates of incidence of the widespread use of tobacco in smoke (beedi, hookah and cigarettes) and smokeless (gutka, paan, khainni etc.) mediums which is very popular in rural areas. (Ken Other major burden in India is regarding ucture, crucial investigatory centres and services to the needy, is at paucity. Facilities are significantly higher in the urban areas when compared with the
g (SELECT), VIT University, Vellore, Tamil
Most of the patients even if diagnosed with cancer are unable to obtain better treatment, as there is dearth in the knowledge about the etiology and risk factors. There are no uniform protocols for management, minimal access to newer therapies and drug regimes. (Prasad, 2014
(Papanicolaou stain) though initially used for screening cervical cancer has now been proven to be effective in screening for oral cancer too.
2011)Sensitivity of PAP analysis in oral
detection of oral cancer is 91.176%, while specificity for the detection of non-neoplastic cells was 100%. The positive and negative predictive values were 100% and 76.92%,
respectively. (Rajput et al., 2010
been made to automate the process of Pap staining in order to analyse cancer smears, and during the nineties there was strong competition between the American companies developing screening technology as well as struggles to get the various solutions approved by the powerful Food and Drug Administration, FDA. (EwertBengtsson and PatrikMalm
Cowpe et al., 1993; Sciubba
scrutinized manually, it takes around 5
recommendations saying that, due to the hazards of fatigue, a pathologist should not work more than 7 hours a day and analyse no more than 70 samples. Even when following this recommendation, the pathologist has to inspect three image
Available online at http://www.journalcra.com
International Journal of Current Research Vol. 8, Issue, 04, pp.29494-29499, April, 2016
INTERNATIONAL
and Sehaj Sharma, 2016. “Image Processing and Neural Network techniques in assisting of Early Detection of Oral
International Journal of Current Research, 8, (04), 29494-29499.
z
IMAGE PROCESSING AND NEURAL NETWORK TECHNIQUES IN ASSISTING OF EARLY DETECTION
School of Electrical Engineering (SELECT), VIT University, Vellore, Tamil Nadu, India- 632014
Oral cancer is the sixth most common cancer globally and most reported cancer in India with fourteen deaths in an hour on a yearly basis. Oral cancers can be cured with early detection but the biggest awareness, cost of tests and the immense workload of the cyto-pathologist leading to delay and errors in the detection process. An effective, semi-automated system described in this paper has made an attempt towards mitigating the above mentioned issues by combining techniques like Papanicolaou (Pap) smear, image processing and neural networks. The primary concern and objective of the system developers is to help cure the menace of oral cancer that is of the first successful attempts at
semi-is an open access article dsemi-istributed under the Creative Commons Attribution License, which
Most of the patients even if diagnosed with cancer are unable to obtain better treatment, as there is dearth in the knowledge about the etiology and risk factors. There are no uniform protocols for management, minimal access to newer therapies , 2014) The Pap smear test stain) though initially used for screening cervical cancer has now been proven to be effective in
screening for oral cancer too. (Rickles, 1972; Mehrotra et al.,
Sensitivity of PAP analysis in oral smears for the detection of oral cancer is 91.176%, while specificity for the neoplastic cells was 100%. The positive and negative predictive values were 100% and 76.92%, ., 2010) Previously attempts have ade to automate the process of Pap staining in order to analyse cancer smears, and during the nineties there was strong competition between the American companies developing screening technology as well as struggles to get the various the powerful Food and Drug EwertBengtsson and PatrikMalm, 2014; Sciubba, 1999) When samples are scrutinized manually, it takes around 5-10 minutes. There are recommendations saying that, due to the hazards of fatigue, a pathologist should not work more than 7 hours a day and analyse no more than 70 samples. Even when following this ecommendation, the pathologist has to inspect three image
INTERNATIONAL JOURNAL OF CURRENT RESEARCH
fields per second on the average. Furthermore, since the visible changes may be quite local, the pathologist needs to maintain full concentration all the time in order not to risk missing some
diagnostic cells. (Elsheikh et al., 2013) Though no proof can be
stated here but very often the pathologists are overworked well beyond the stated guideline. All the above mentioned reasons accumulate and the pathologist may pass a positive sample as a negative sample. The cost of such an error could be paid by the patient’s life. There have been attempts at an automated system since 1970’s by several companies. Each of them have failed at it owing to technological restrictions of that era, namely; reliance on purely analog electronics, lack of computing power, memory restrictions that prohibited high resolutions images of samples and lack of microscopes providing such a resolution.
(EwertBengtsson and PatrikMalm, 2014; Tanaka et al., 1987)
The system described uses signal processing and image processing techniques to extract data from the Pap stained sample’s images. Neural networks techniques, namely Linear Vector Quantisation (LVQ) is used to classify the positive and negative samples. The system proposed in this study has made a successful attempt at screening and analysing pap smears from the oral cavity and be able to classify them as “potentially cancerous” or “positive” and “definitely healthy” or “negative”. The positive samples are then forwarded to the cyto-pathologist for another review where he can further spot abnormalities in the sample that the machine had missed or re-confirm what the machine had already spotted. This helps reduce the work load of a cyto-pathologist by an appreciable amount since he now needs to examine only a fraction of the total samples sent to him for analysis.
MATERIALS AND METHODS
There are three major phases to processing samples in the proposed system which will be described below. These steps have been performed for 10 healthy samples (negative) and 8 diseased samples (positive). The staining procedure is to be performed by the pathologist while the other two are performed by the system proposed.
A. Staining Procedure
Pap smear is categorized as exfoliative cytology. Though the Pap smear test doesn’t render useless the need for a biopsy, it is a useful tool in adjunction to biopsy because of its affordability. Pap smear is a painless, atraumatic and simple procedure for collecting a sample of superficial cells. The Pap smear test has also proven its merit in detecting malignant and pre-cancerous lesions. The above mentioned qualities of Pap make it a preferred method for initial and preventative
screening. (Rickles, 1972; Mehrotra et al., 2006; Mehrotra et
al., 2011)
i) The first step is gathering the sample from a patient’s oral
cavity, wherever the lesion is present. A tongue blade/swab is used to scrape the lesion. (Rickles, 1972)
ii) The lesion acquired on the tongue blade/swab is then
smeared on a glass slide. (Rickles, 1972)
iii) The preparation, while still wet, is fixed on the slide by
spraying a fixative solution. This is done to prevent the
slide from being altered by physical or environmental disturbance. (Rickles, 1972)
iv) Following the above three steps of slide preparation, the
staining steps follow to highlight the different features in a cell. In the first staining step the nuclei are stained by a haematoxylin solution. Nuclei are stained blue, dark violet to black.
v) The second staining step is cytoplasm staining by orange
staining solution, especially for demonstration of mature and keratinised cells. The target structures are stained orange in different intensities.
vi) In the third staining step the so-called polychromatic
solution is used, a mixture of eosin, light green SF and Bismarck brown. The polychromatic solution is used for demonstration of differentiation of squamous cells e.g. oral cancer and cycle diagnosis for examination under microscope.
vii) Hence the method employs series of steps with each step
comprising of particular solutions and each step being performed for designated period of time. Order of steps and quantities of chemicals used and time period can be vary in different protocols and it is up to the cytologist to decide upon which protocol to follow according to the requirements.
viii) The results obtained by Pap can further be classified as:
(Maraki et al., 2004; Remmerbach et al., 2003)
(1)Normal Results (absence of abnormality in cells).
(2)Abnormal Results (possible cancerous or pre-cancerous
cells): Abnormal results can be further classified as:
(a)ASCUS or AGUS:This result means there are atypical
cells, but it is uncertain or unclear what these changes mean. The changes may be due to HPV. They may also mean there are changes that may lead to cancer.
(b)LSIL (low-grade dysplasia) or HSIL (high-grade
dysplasia): This means changes that may lead to cancer are present. The risk of cervical cancer is greater with HSIL.
(c)Carcinoma in situ (CIS): This result most often means the
abnormal changes are likely to lead to oral cancer if not treated.
(d)Atypical squamous cells (ASC): Abnormal changes have
been found and may be HSIL.
B. Image Processing
The image is first acquired from a microscope of resolution 0.63 µmeter per pixel. The image will be classified on the following parameters:
Nuclear area
Cytoplasm area
Cytoplasmic-nucleic ratio
The following steps are performed on the image after it is acquired:
i) A copy of the acquired image is then converted to
grayscale for simplifying filtering, de-noising, sharpening and edge detection. (Rafael, 2002)
Figure 1. Grayscale image of the sample
ii) In such a sanitised and controlled environment, the
introduction of noise is generally minimal. The only aspects of the images we could consider as noise are blotted stains, dirt on the slide (lint, dust), etc.
iii)The real challenge is to be able to program the machine to
be able to differentiate the very obscure distinction in features. Often the cells are overlapping, cell is damaged, etc.
iv)To be able to differentiate all of these features the image is
put through various pre-processing stages like histogram equalisation, contrasting, filtering, sharpening etc. (Rafael, 2002)
Figure 1. The contrasted image to filter out the noise and enhance edge detection
v) The image is then converted into an edge image using the
‘canny filter’. Canny filter is used since it retains the intricate edges of an image by using two thresholds to identify edges.
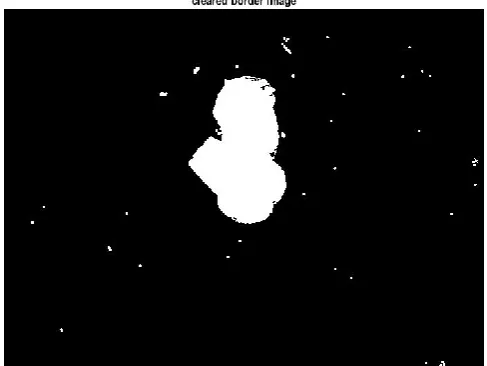
vi) The image is segmented into regions using thresholding
and M-connectivity criteria to be able demarcate the nucleus and cytoplasm based on pixel grey level intensities.
vii) The edge image is compared with the region segmented
image. On comparison the edge image is assigned the region codes from the previous image.
viii) Finding areas enclosed within edges is made fairly easy
[image:3.595.309.562.153.350.2]now. Fourier descriptors are used to find image area since they can be programmed and varied to give us different levels of detail. (Rafael, 2002); Bergmeir and Garc´ıaSilvente, 2010)
Figure 2. Edge image after applying canny filter and dilating the edges to form continuous edges
Figure 4. Image of only the cell body after various processing stages
ix)The nucleus size can be evaluated from the region
segmented image. A low threshold is set on the grayscale image and the nucleus regions are scanned on how many pixels on an average were falling below this threshold.
(Bergmeir and Garc´ıaSilvente, 2010; Haralick et al., 1973)
x) The Nuclear-Cytoplasmic ratio is evaluated by first finding
out the areas of the cytoplasm and nucleus respectively. Then the area of nucleus is divided by area of nucleus to give the required ratio.
This ratio is tabulated and evaluated by the next machine learning process.
[image:3.595.312.556.394.577.2] [image:3.595.74.286.419.593.2]C. Machine Learning
i) During training, nuclear-cytoplasmic ratios of 8 positive
(diseased) samples and 10 negative (healthy) samples were collected
ii) The training data were given three target values; two target
values for positive samples (for low-grade dysplasia and high-grade dysplasia) and one for negative samples.
iii)These samples are then trained using the Linear Vector
Quantisation (LVQ) algorithm.
iv)Learning Vector Quantization (LVQ), is a prototype
supervised classification algorithm. LVQ is the supervised counterpart of vector quantization systems.
v) LVQ maps each datum as an n-dimensional vector in a
vector space. Then it assigns random centres and calculates their Euclidean distance from the remaining data points. Upon several epochs of the LVQ using these Euclidean distances are used to formulate the weights for the target values.
vi)This algorithm classifies the samples into three groups
according to the three targets assigned.
Once the training is complete, new samples can be evaluated as cancer positive and cancer negative (healthy).
RESULTS
[image:4.595.313.554.172.375.2]The details extracted by the system like cytoplasm area, nucleus area and their ratios have been tabulated below. It should be noted that the areas have been calculated in te pixels and not in any SI units of sorts.
Table 1. Healthy Cells Data
Subject no.
Cytoplasmic Area
Nucleus Area Cytoplasm
Nucleic Ratio
1. 36999.875000 744.250000 49.714310
2. 32720.875000 434.000000 75.393721
3. 31038.750000 415.000000 74.792169
4. 21946.250000 522.875000 43.693521
5. 38536.250000 764.750000 50.390651
6. 23767.906250 584.218750 40.683231
7. 20605.187500 580.750000 35.480305
8. 21244.500000 697.875000 30.441698
9. 28249.375000 450.250000 62.741532
10. 23975.075000 571.500000 41.951137
We can infer from the above table that the cytoplasm size of a normal healthy cell lie in the range of 20000
approximately, nucleus size of a normal healthy size lie in the range of 440-780 pixels approximately and their
[image:4.595.316.555.423.672.2]range of 35-55 approximately.
Table 2. Diseased Cells
Subject no.
Cytoplasmic Area
Nucleus Area Cytoplasm
Nucleic Ratio 1. 35587.000000 1494.000000 23.819946 2. 52973.250000 0.000000 Inf 3. 38139.125000 318.500000 119.746075 4. 31466.875000 0.000000 Inf 5. 133226.125000 692.125000 192.488532
6. 34971.780000 1483.000000 23.581780
7. 35912.920000 1212.560000 29.617437
8. 21372.310000 968.965000 22.056844
29497 Dr. Vivekanandan and Sehaj Sharma, Image processing and neural network techniques in assisting of early detection of oral cancer
cytoplasmic ratios of 8 positive (diseased) samples and 10 negative (healthy) samples were
The training data were given three target values; two target grade dysplasia and grade dysplasia) and one for negative samples. These samples are then trained using the Linear Vector
Learning Vector Quantization (LVQ), is a prototype-based ification algorithm. LVQ is the supervised counterpart of vector quantization systems.
dimensional vector in a vector space. Then it assigns random centres and calculates their Euclidean distance from the remaining data points. Upon several epochs of the LVQ using these Euclidean distances are used to formulate the weights for the target
This algorithm classifies the samples into three groups
ples can be evaluated as cancer positive and cancer negative (healthy).
The details extracted by the system like cytoplasm area, nucleus area and their ratios have been tabulated below. It should be noted that the areas have been calculated in terms of
. Healthy Cells Data
Cytoplasm-Nucleic Ratio 49.714310 75.393721 74.792169 43.693521 50.390651 40.683231 35.480305 30.441698 62.741532 41.951137
We can infer from the above table that the cytoplasm size of a normal healthy cell lie in the range of 20000-40000 pixels approximately, nucleus size of a normal healthy size lie in the 780 pixels approximately and their ratio in the
Cytoplasm-Nucleic Ratio 23.819946 Inf 119.746075 Inf 192.488532 23.581780 29.617437 22.056844
From the above table we can infer that there are instances where the size of cytoplasm or nucleus of healthy or diseased maybe similar but the difference in their ratios make their difference evident. Some diseased samples display the lack of nuclear development and are traditionally classified as LSIL. Their ratios are much above what the healthy cells display. Some samples display over developm
traditionally called HSIL. These are much lower than the healthy cells range.
Figure 3. LSIL in red, healthy in blue and HSIL in yellow
Figure 6. A healthy sample
The above graph uses data from healthy and diseased samples to represent the differences in the characteristics. The samples displaying LSIL are in red, healthy in blue and HSIL in yellow. Being able to differentiate between LSIL and healthy is fairly straightforward by looking at the graph. However, being able to
Image processing and neural network techniques in assisting of early detection of oral cancer
From the above table we can infer that there are instances where the size of cytoplasm or nucleus of healthy or diseased difference in their ratios make their difference evident. Some diseased samples display the lack of nuclear development and are traditionally classified as LSIL. Their ratios are much above what the healthy cells display. Some samples display over development of nucleus and traditionally called HSIL. These are much lower than the
. LSIL in red, healthy in blue and HSIL in yellow
. A healthy sample
The above graph uses data from healthy and diseased samples to represent the differences in the characteristics. The samples displaying LSIL are in red, healthy in blue and HSIL in yellow. Being able to differentiate between LSIL and healthy is fairly aightforward by looking at the graph. However, being able to
[image:4.595.61.262.448.566.2] [image:4.595.62.264.659.757.2]differentiate between HSIL and healthy isn’t simple
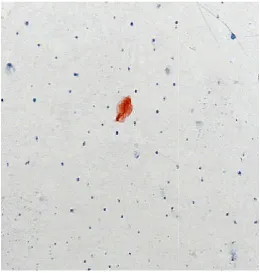
[image:5.595.36.297.143.417.2]observing the graph. At the end, the system prints a message stating whether the cyto-pathologist needs to examine that particular sample or not. The two images shown below show a healthy and diseased sample. The diseased sample shows the absence of nuclear development and irregularity in shape which are indicators of cancer.
Figure 7. A diseased sample
Future Scope
The system has been able to successfully differentiate malignant and healthy cells in the oral cavity. This research can be further enhanced with more samples. Nonetheless, this paper is a milestone in cancer detection and the preventative screening process. The system described i
enabled effort in reducing oral cancer associated mortality amongst our countrymen. In the near future this system can be integrated as an assistive tool in pathology labs.
Acknowledgements
First and foremost we would like to thank our cha
Viswanathan for providing the encouragement and support for conducting meaningful research. VIT University’s management has to be thanked for providing us with the infrastructure and amenities which made sure there weren’t hindrances in our work. We would also like to thank the School of Electrical Engineering for providing us the resources and expert opinion for our research. Last but not the least, we wish to thank our family and friends to have stood by us in every situation.
REFERENCES
Bergmeir, C., Garc´ıaSilvente, M., EsquiviasL´opez
and Ben´ıtez, J.M. 2010. “Segmentation of cervical cell
29498 International Journal of Current Research,
differentiate between HSIL and healthy isn’t simple by simply At the end, the system prints a message pathologist needs to examine that The two images shown below show a healthy and diseased sample. The diseased sample shows the absence of nuclear development and irregularity in shape which
. A diseased sample
to successfully differentiate malignant and healthy cells in the oral cavity. This research can be further enhanced with more samples. Nonetheless, this paper is a milestone in cancer detection and the preventative screening process. The system described is a technology enabled effort in reducing oral cancer associated mortality amongst our countrymen. In the near future this system can be integrated as an assistive tool in pathology labs.
First and foremost we would like to thank our chancellor, Dr. G Viswanathan for providing the encouragement and support for conducting meaningful research. VIT University’s management has to be thanked for providing us with the infrastructure and amenities which made sure there weren’t hindrances in our work. We would also like to thank the School of Electrical Engineering for providing us the resources and expert opinion for our research. Last but not the least, we wish to thank our family and friends to have stood by us in every situation.
EsquiviasL´opez-Cuervo, J. “Segmentation of cervical cell
images using meanshift filtering andmorphological operators,” in Medical Imaging 2010: Image Processing, San Diego, Calif, USA, February
Casiglia, J. and Woo, S.B. 2001. oral cancer. Genet Dent. 49:72 Cowpe, J. G., Ogden, G. R. and
Comparison of Planimetry and Image Analysis for the Discrimination Between Normal and Abnormal Cells I Cytological Smears of Suspicious Lesions of the Oral Cavity. Cytopathology, 4:
2303.1993.tb00070.x Elsheikh, T. M., Austin, R. M.
Moriarty, A. T. and Renshaw, A. A.
society of cytopathology workload recommendations for automated pap test screening:
productivity and quality assurance in the era of automated screening task force,” Diagnostic Cytopathology, vol. 41, no. 2, pp. 174–178.
Ewert Bengtsson and Patrik Malm,
Screening for Cervical Cancer Using Automated Analysis
of PAP-Smears”, Hindawi Publishing Corporation
Computational and Mathematical Methods in Medicine
Volume 2014, Article ID 842037, 12 pages
Haralick, R. M. Shanmugam,
“Textural features for image classification,” IEEE Transactions on Systems, Man and Cybernetics, vol. 3, no. 6, pp. 610–621.
Kaugars, G.E., Silverman, S., Ray
of exfoliative cytology for the early diagnosis of cancers: is there a role for it in education and private practice? J Cancer Educ. 13:85
Ken Russell Coelho, 2012. “Challenges of the Oral Cancer Burden in India,” Journal of Cancer Epidemiology, vol.
2012, Article ID 701932, 17 pages, 2012.
doi:10.1155/2012/701932
Maraki, D., Becker, J. and Boecking, A. 2004
DNA-cytometric very early diagnosis of oral cancer.
Journal of Oral Pathology & Medicine,
doi: 10.1111/j.1600-0714.2004.0235.x Mehrotra, R., Gupta, A., Singh
Application of cytology and molecular biology in
diagnosing premalignant or malignant oral
lesions.Molecular Cancer. 2006;5:11. doi:10.1186/1476
4598-5-11.
Mehrotra, R., Mishra, S., Singh
efficacy of oral brush biopsy with computer analysis in identifying precancerous and cancerous
Head & Neck Oncology, 3:39. doi:10.1186/1758
39.
Prandoni, P. and Vetterli, M.
Communications”, by EPFL Press © 2008.
Prasad, L.K. 2014. Burden of oral cancer: An Indian scenario.
J Orofac Sci., 6:77.
Rafael C. Gonzalez and Richard E. Woods,
Image Processing – 3rd Edition”, Pearson Education International.
Rajput, Dinesh V. and Jagdish V
Detection of Oral Cancer: PAP and AgNOR Staining in
Brush Biopsies.” Journal of Oral and Maxillofacial
Pathology : JOMFP 14.2 (2010): 52
Mar. 2016.
International Journal of Current Research, Vol. 08, Issue, 04, pp.29494-29499, April, 2016
images using meanshift filtering andmorphological operators,” in Medical Imaging 2010: Image Processing, San Diego, Calif, USA, February, 76234C.
2001. A comprehensive review of oral cancer. Genet Dent. 49:72–82.
Cowpe, J. G., Ogden, G. R. and Green, M. W. 1993. Comparison of Planimetry and Image Analysis for the Discrimination Between Normal and Abnormal Cells In Cytological Smears of Suspicious Lesions of the Oral Cavity. Cytopathology, 4: 27–35. doi:
10.1111/j.1365-Austin, R. M., Chhieng, D. F., Miller, F. S., Moriarty, A. T. and Renshaw, A. A. 2013. “American opathology workload recommendations for automated pap test screening: Developed by the productivity and quality assurance in the era of automated screening task force,” Diagnostic Cytopathology, vol. 41,
Malm, 2014. “Review Article -Screening for Cervical Cancer Using Automated Analysis
Hindawi Publishing Corporation Computational and Mathematical Methods in Medicine
, Article ID 842037, 12 pages
Haralick, R. M. Shanmugam, K. and Dinstein, I. 1973. “Textural features for image classification,” IEEE Transactions on Systems, Man and Cybernetics, vol. 3, no.
, Ray, A.K., et al. 1998. The use
of exfoliative cytology for the early diagnosis of oral cancers: is there a role for it in education and private practice? J Cancer Educ. 13:85–9.
“Challenges of the Oral Cancer Journal of Cancer Epidemiology, vol.
2012, Article ID 701932, 17 pages, 2012.
Maraki, D., Becker, J. and Boecking, A. 2004. Cytologic and cytometric very early diagnosis of oral cancer.
Journal of Oral Pathology & Medicine, 33: 398–404.
0714.2004.0235.x
, Singh, M. and Ibrahim, R. 2006. Application of cytology and molecular biology in
diagnosing premalignant or malignant oral
. 2006;5:11.
doi:10.1186/1476-, Singhdoi:10.1186/1476-, M. and Singhdoi:10.1186/1476-, M. 2011. The h biopsy with computer-assisted analysis in identifying precancerous and cancerous lesions. 3:39.
doi:10.1186/1758-3284-3-M. 2008. “Signal Processing for
by EPFL Press © 2008.
Burden of oral cancer: An Indian scenario.
Rafael C. Gonzalez and Richard E. Woods, 2002. “Digital 3rd Edition”, Pearson Education
and Jagdish V. Tupkari, 2016. “Early ion of Oral Cancer: PAP and AgNOR Staining in
Journal of Oral and Maxillofacial
14.2 (2010): 52–58. PMC. Web. 31
Remmerbach, T.W., Weidenbach, H., Hemprich, A. and Böcking, A. 2003. Earliest Detection of Oral Cancer Using Non-Invasive Brush Biopsy Including
DNA-Image-Cytometry: Report on Four Cases. Analytical Cellular
Pathology : the Journal of the European Society for
Analytical Cellular Pathology, 25(4):159-166.
doi:10.1155/2003/305151.
Rickles, N. H. 1972. Oral exfoliative cytology: An adjunct to biopsy. CA: A Cancer Journal for Clinicians, 22: 163–171. doi: 10.3322/canjclin.22.3.163
Sciubba, J.J. 1999. Improving detection of precancerous and cancerous oral lesions. Computer-assisted analysis of the
oral brush biopsy. JADA, 130:1445–57
Simon Haykin and Barry Van Ween, “Signals and Systems”,
published by John Wiley and Sons. Inc.
Tanaka, N. Ueno, T. Ikeda, H. et al., 1987. “CYBEST Model
4. Automated cytologic screening system for uterine cancer
utilizing image analysis processing,” Analytical and
Quantitative Cytology and Histology, vol. 9, no. 5, pp.
449–454.