Predicting Attack-prone Components with Internal Metrics
Michael Gegick
1, Laurie Williams
1, Jason Osborne
21
Department of Computer Science,
2Department of Statistics
North Carolina State University, Raleigh, NC 27695
{mcgegick, lawilli3}@ncsu.edu, [email protected]
ABSTRACT
Extensive research has shown that reliability models based upon software metrics can be used to predict which components are fault- and/or failure-prone early in the development process. In this research, we seek to parallel failure-prone component prediction with security models to predict which components are attack-prone. Security experts can use these models to make informed risk management decisions and to prioritize redesign, inspection, and testing efforts. We collected and analyzed data from a large commercial telecommunications software system containing over one million lines of code that had been deployed to the field for two years. Using recursive partitioning and logistic regression, we built attack-prone prediction models with the following metrics: static analysis tool output, code churn, source lines of code, failure reports from feature/system testing, and customer-reported failures. The models were validated against k-fold cross-validation and ROC curves. One model identified 100% of the attack-prone components with an 8% false positive rate.
Categories and Subject Descriptors
D.2.4 [Software Engineering]: Software/Program Verification – statistical methods. D.2.8 [Software Engineering]: Metrics –
Product metrics.
General Terms
Security, Measurement.Keywords
Vulnerability-prone, attack-prone, security, predict, prioritize, recursive partitioning, logistic regression.
1.
INTRODUCTION
Limited resources preclude software engineers from finding and fixing all problems in their software system. Some faults are subtle and can be overlooked while others may cause failures in a state that occurs outside of a testing environment [31]. The costs to find and fix software problems grows with time [7] and extending verification and validation (V&V) efforts late into the software life cycle (SLC) to find these elusive faults can be costly. Predictive modeling that points software engineers toward problem areas early in the SLC has been one approach for increasing the effectiveness of V&V efforts.
Extensive research (including [2, 4, 29, 31, 36]) has shown that software metrics can be used to identify fault- and failure-prone components1 and to predict the overall reliability of a system early in the SLC. These models indicate where in the software
1
A component is constituent part, element, or piece of a complex whole [25].
reliability problems most likely exist so that software engineers have an objective strategy of where V&V efforts should begin. Similarly, our research objective is to create and evaluate security prediction models that use internal metrics to predict which components are attack-prone.
In addition to quality assurance personnel who focus on overall product reliability, organizations often have security specialists. In this research, we seek to aid these security experts in their prioritization of security-based redesign, inspection, and testing efforts. Unlike the general reliability models, our security models will have to predict which components contain the subset of all faults that can be exploited to cause a security problem. These models will have to make accurate predictions based on few data since security faults may only account for as few as 0.12% of all faults in a software system [1]. While security vulnerabilities are fewer in count than general reliability problems, the exploitation of the vulnerabilities can severely impact businesses and end users.
We conducted a case study on a large commercial2 telecommunications software system comprised of over 1.2 million source lines of code (SLOC) to create and evaluate predictive models that identify attack-prone components. The candidate internal metrics to our predictive models are output from the static analysis tool FlexeLint3, code churn, and SLOC. These metrics are obtainable early in the SLC. We hypothesize that these metrics can be used to identify attack-prone components. We based our hypothesis on previous research results that demonstrate the predictive power of these metrics in the general reliability realm. Previous research [32, 42] has indicated that the output from static analysis tools can predict fault- and failure-prone components. Additionally, SLOC-normalized code churn has been used to point to problem areas in software [14, 33]. SLOC, although having disputed effects on fault density [10, 16], is a metric that is often available with a software system. Our models with static analysis tool output use different combinations of metrics and statistical techniques that were not used by either Nagappan et al. [32] or Zheng et al. [42]. We further describe the differences between general reliability models and our security models in Section 7.
The external metrics in our study included pre-release system testing failures and post-release failures reported by customers. We performed correlations, recursive partitioning, and logistic regression analyses in our models. The internal metrics we use can be obtained during development and may have predictive power on the external metrics, which were identified during late-cycle system testing. We will show security-based predictive models with each of the internal metrics alone and then all together in the same model.
2
The corporation chose not to be identified in this paper.
3
The remainder of the paper is organized as follows: Section 2 provides background information, Section 3 provides an overview of prior research on predicting problem areas, Section 4 details our industrial case study, Section 5 presents the threats to validity, Section 6 reports correlations with our results, Section 7 presents results from pre-release failure predictive modeling, Section 8 presents results from post-release failure predictive models, Section 9 provides a discussion of our results, and finally we summarize in Section 10.
2.
BACKGROUND
This section presents background material on the definitions and techniques related to our work. We align our definitions of vulnerability- and attack-prone with the well-established definitions of fault- and failure-prone components and ISO/IEC 24765 [25] definitions of faults and failures.
2.1
Definitions
Internal metrics - “Those metrics that measure internal attributes of the software related to design and code. These “early” measures are used as indicators to predict what can be expected once the system is in test and operation” [24].
External metrics - “Those metrics that represent the external perspective of software quality when the software is in use…These measures apply in both the testing and operation phases” [24].
Reliability - “The ability of a system or component to perform its required functions under stated conditions for a specified period of time” [25].
Security - “The protection of system items from accidental or malicious access, use, modification, destruction, or disclosure” [25].
2.1.1
Latent Fault Definitions
Fault - reliability concept: “An incorrect step, process, or data definition in a computer program. Note: A fault, if encountered, may cause a failure” [25].
Fault-prone component - reliability concept: “A component that will likely contain faults” [12].
Vulnerability - security concept: An instance of a [fault] in the specification, development, or configuration of software such that its execution can violate an [implicit or explicit] security policy [27].
Vulnerability-prone component - security concept: A component that is likely to contain one or more vulnerabilities that may or may not be exploitable [18].
2.1.2
Realized Fault Definitions
Failure - reliability concept: “The inability of a software system or component to perform its required functions within specified performance requirements” [25].
Failure-prone component - reliability concept: A component that will likely fail due to the execution of faults [40].
Attack - security concept: The inability of a system or component to perform functions without violating an implicit or explicit security policy. We borrow from the ISO/IEC 24765 [25] definition of failure to define attack, but remove the word
“required” because attacks can result from functionality that was not stated in the specification.
Attack-prone component - security concept: A component that will likely be exploited [18].
Fault-prone prediction models can estimate which components are fault-prone, but if the faulty code is never executed it will not be prone to failure. The inspection of all fault-prone components may cause the development team to expend valuable and limited verification resources on low risk areas of the code that may be of high quality and/or may rarely or never be used by a customer. Failure-prone prediction models, based on a customer’s operational profile, and historical failures from the field, can further guide fault-finding efforts toward low quality components that are likely to cause problems for the end user.
A vulnerability-prone component is analogous to a fault-prone component in that vulnerabilities may remain latent (similar to faults) until encountered by an attacker (or tester/customer) in an executing system. The vulnerabilities in a vulnerability-prone component can include a wide range of severity and likelihood of exploitation.
A similar relationship between vulnerability-prone and attack-prone components exists as with fault- and failure-attack-prone components. An attack-prone component is a vulnerability-prone component if an attacker will likely exploit one or more vulnerabilities in that component. Vulnerability-finding techniques can cause security experts to expend valuable and limited security resources on low risk areas of the code that may be adequately fortified, may be uninteresting to an attacker, or contain difficult-to-exploit vulnerabilities. Attack-prone prediction models based on test failure data and attacks in the field can make vulnerability-finding efforts more efficient and effective by identifying those components with the highest security risk. While failures in the reliability realm are dependent on the operational profile, attacks can occur anywhere in a software system regardless of the operational profile.
2.2
Automated Static Analysis (ASA)
We used static analysis tool output as one of our internal metrics. A static analysis tool analyzes the content of a software system to detect faults without executing the code [8]. We use the term automated static analysis (ASA) to refer to the use of static analysis tools. Examples of the types of problems identified by ASA tools include the detection of calls to potentially insecure library functions, bounds-checking errors and scalar type confusion. ASA tools perform analyses such as semantic, structural, configuration, control- and data-flow analyses. The output of an ASA tool is an alert. An alert is a notification to a software engineer, of a potential fault in the source code that has been identified via static analysis [20].
Static analysis tools provide an early, automated, objective, and repeatable analysis for detecting faults. The software organization we worked with uses the ASA tool, FlexeLint. Increasingly, ASA tools are used to identify security vulnerabilities [9].
FlexeLint output to separate out the true positive from false positive alerts. The outsourced organization returns a report listing the alerts they classified as true positives along with their severity levels. In this paper, we refer to “audited” alerts as those that have undergone this outsourced review while “un-audited” alerts are those that are output by the tool.
2.3
Recursive Partitioning
Our predictive models are comprised of a statistical technique and the following input variables: ASA alerts, code churn, and SLOC. Recursive partitioning, also known as classification and regression trees (CART), is a statistical technique that recursively partitions data according to X and Y values. The result of the partitioning is a tree of groups where the X values of each group best predicts a Y value. The leaves of the tree are determined by the largest likelihood-ratio chi-square statistic. The threshold or split between leaves is chosen by maximizing the difference in the responses between the two leaves [39]. For our study, the X values are values from the internal metrics and the Y value is a binary value describing a component as attack-prone or non attack-attack-prone.
2.4
The Common Weakness Enumeration
We use Common Weakness Enumeration (CWE) names to identify the vulnerabilities so our analysis can be repeated on other systems with the same vulnerability naming scheme. The CWE [30] is a publicly-available aggregation of security-based vulnerability taxonomies/sources. Examples of the taxonomies it includes are including Seven Pernicious Kingdoms [41], the Preliminary List of Vulnerability Examples for Researchers (PLOVER)4, ten from Open Web Application Security Project (OWASP)5, and the Web Security Threat Classification6. The CWE describes software vulnerabilities in a consistently named fashion. For this paper, we use the term “vulnerability” instead of the CWE term “weakness.” Each classification of vulnerability contains the classification name and classification ID. For example, with Null Pointer Dereference (476), Null Pointer Dereference is the classification name and (476) is the unique ID given to the classification. The appropriate method of citing a CWE vulnerability is to include both the name and ID.3.
RELATED WORK
We now present prior research that has shown how internal metrics can predict fault-, failure-, and vulnerability- prone components.
3.1
ASA Alerts as Static Metrics for Fault-
and Failure-Prone Prediction
Discriminant analyses have been used in many instances to distinguish fault-prone and not fault-prone components [21, 22, 26, 32, 42]. Recently, modules have been classified as being fault-prone and not fault-prone using ASA alerts as input variables for discriminant analysis [32]. Nagappan et al. [32] demonstrated that they could distinguish 82.91% of their
4
http://cve.mitre.org/docs/plover
5
http://www.owasp.org/index.php/Main_Page
6
http://www.webappsec.org/projects/threat/v1/WASC-TC-v1_0.pdf
components. Due to the proprietary nature of their work, Type I and Type II misclassifications are not reported. The classification results indicate that a strong enough difference can be made between faulty and non faulty components to confidently prioritize the allocation of testing resources and inspections. Zheng et al. [42] correctly classified 87.5% of the modules in their study when the number of ASA faults and number of test failures are considered. Our research will further these findings to determine if ASA can be used to classify attack-prone components based on recursive partitioning and logistic regression.
3.2
Prediction with Code Churn
In our setting, churn is the count of SLOC that has been added or changed a component since the previous revision of the software. Nagappan et al. [33] experimented with churn to determine if there was a positive association between churn and defect density. In an analysis with Windows Server 2003, they discovered that there is a correlation and that churn can discriminate between fault-prone and non fault-prone binaries with an accuracy of 89%. They also show that relative churn – churn normalized against lines of code, file count, and file churn – is a better predictor than the raw value of churn. Elbaum et al. [14] reported that code churn was a more effective indicator of faults than other measures such as the number of people working on the code and the number of change requests to that code.
3.3
Prediction with SLOC
Fenton et al. [16] analyzed a large software system and compared their analysis on SLOC, fault count, and fault density to that of Basili et al. [5] who performed an analysis on another system. Basili et al. [5] found that fault density decreased as module size increased. However, Fenton et al. [16] could not find any association between fault count and SLOC nor could they with fault density and SLOC. Fenton suggests that other factors such as design, inspection, and testing effort per module factor on how many faults are found in a component. Our analysis will include SLOC to give support (or opposition) to these claims based on a different software system.
3.4
Vulnerability-prone Component
Predictions
Our work in this paper follows a case study we performed on Sendmail7 [17]. We found a high positive association between un-audited ASA alerts from Fortify Software Source Code Analyzer (SCA) 4.0, and vulnerabilities documented in Sendmail. The association indicates that vulnerability-prone components in Sendmail were also likely to have high alert counts. Specifically, we modeled Sendmail vulnerability counts using Poisson regression in which the counts follow a Poisson distribution with a mean that is linear in alert count, after applying a log transformation. Fitting this generalized linear model led to an estimated slope of 247.8 alerts/reported vulnerability (SE=61, p<.0001), which indicates that the mean change in vulnerability count, on the log-scale, is 247.8 per unit increase in alert count. The analysis had grouped ASA alerts based on severity assigned by SCA. The most severe alerts were alerts used in the calculated association. The case study in
7
this paper extends the Sendmail analysis by adding churn and SLOC as input variables.
Neuhaus et al. [34] have also investigated predictive models that identify vulnerability-prone components. They created a software tool, Vulture, that mines a bug database for data that predict which components will likely be vulnerable. The predictors for their models are code patterns that are associated with vulnerabilities. They performed an analysis with Vulture on Bugzilla, the bug database for the Mozilla browser, using imports and function calls as predictors. They were able to identify 50% of all of the vulnerable components in Mozilla. Their work is similar to ours in that the metrics are internal, but the metrics we use are different.
4.
CASE STUDY
We analyzed data from a large commercial telecommunications software system that had been deployed to the field for two years. The system contained 38 well-defined components whereby each component consisted of multiple source files. A full set of information necessary for our analysis was only available for 25 (66%) of the components of the system, and thus the study focuses on those components. The 25 components we analyzed summed to approximately 1.2 million lines of code. All faults in the failure reports have since been fixed.
The metrics used in our analysis include failure reports, ASA alerts, and the count of churn and SLOC per component. The failure reports included and post-release failures. A pre-release failure for our study is a failure discovered by an internal tester during feature and/or system robustness testing. A post-release failure indicates that a failure occurred in the field and was reported by a customer. Both the pre- and post-release reports explicitly identified the component where the solution was applied. Information in the failure reports gave details on log output, how to reproduce the failure, stack traces when applicable, severity, impact to end users, test output, and brief general strategies on how to remedy the problem.
An ASA analysis was performed on the system by FlexeLint. Although FlexeLint is a reliability-based ASA tool, we sought to determine if the full set of defect types identified by the tool could be warnings of security vulnerabilities on a per-component basis. Additionally, we classified some of the defect types as security-related (see Section 4.1) and used those alerts with these defect types along with the reliability-related alerts for predictors in our models. For our analysis we were provided with both audited and un-audited output from FlexeLint. The audited output, compiled by the software organization’s outsourced manual auditing service, contained an enumeration of true positive alerts. For each alert, the report would contain a brief general description about the alert, a mapping to the component containing the fault, and the impact/severity as defined by the auditors, and a code fragment. The un-audited report included all true and false positive alerts and the file in which the alert was found. A file path was given in the un-audited report that was used to map to the component. The pre- and post-release failure reports and the un-audited/audited FlexeLint output provided the numbers of failures and alerts for each component which was sufficient for our analyses. There were 55,024 alerts produced by FlexeLint. The outsourced
auditing service classified 302 (0.55%) alerts as true positives. We did not have enough information to determine which of the alerts had identified the failures found by the pre- and post-release failures. Churn and SLOC were reported by the software organization for each of the components we analyzed.
4.1
Failure Report Classification
The first author and additional research student, doctoral students in software security, independently reviewed each of the 1255 pre- and post-release failure report to determine which failure reports were security problems. Based on the failure reports we developed criteria that identified which failures were non-security problems and which were indicative of security problems. Some failure reports were explicitly labeled as security problems (approximately 0.5%) by either internal testers or security engineers. We analyzed all other failure reports that were not explicitly labeled a security problem. We found that many reports contained the following keywords that are often seen in security literature: crash, denial-of-service, access level, sizing issues, resource consumption, and data loss. These keywords increased our suspicion of whether or not the failure could be a security problem, but did not necessarily indicate a security problem.
We compiled a list of these keywords and used it to match against all failure reports that were not explicitly labeled as a security problem. We excluded from our analysis any failure report that indicated that the problem was not reproducible (6.4%) or did not contain enough information about the failure to adequately understand the fault or declare it as a security problem (0.6%). The criteria for a failure report to be classified as a security problem are now listed:
• Remote attacks. The failure reports explicitly indicated when the failure was due to a remote user or machine. Pre- and post-release failure reports that contained the security keywords and could be remotely initiated had the highest confidence of an exploitable vulnerability.
• Insider attacks. If the failure report did not indicate that the failure was due to an external user or machine, then we looked for attacks that did not require remote access to the system. For example, one report indicated that an insider attack was possible if a disgruntled employee was to abuse a privilege in the system.
• Audit capability. Weak or absent logging for important components was considered a security vulnerability. An example of an important log that was not working properly involved loss of a financial transaction that may result in an attacker obtaining a service for free. The absence of logs has been demonstrated as a security problem when audits are required to identify an attack [37].
could apply, or if any documented attack patterns [23] could match to the software.
After filtering for security vulnerabilities, the first and fourth authors compared their findings, settled differences, and then reported the final results to the software organization’s security engineer. The security engineer audited our report and eliminated false positives (6.8%) from our report. False positives were reliability faults that we claimed to be security vulnerabilities. The number of vulnerabilities in our analysis 46 (3.7%) of the total failure reports were classified as security failures. Any of the failure reports that we misclassified as non-security problems are false negatives in the study. We used the failure reports that were verified as security problems in our statistical analyses. A security-based failure represents the presence of a security vulnerability. We did not include the failure reports that did not have a security impact on the software system in our study. For this paper, failure and alert densities are calculated by dividing the number of failures and alerts by the number of KLOC (thousands lines of source code) of that component.
4.2
Classification of Vulnerabilities
According to the CWE
We mapped each vulnerability identified by the failure report to one of 550 weakness classifications of the CWE. The classification provides evidence that the vulnerabilities we have identified in the pre- and post-release failure reports have been known to be vulnerabilities. Additionally, the CWE provides common names to the vulnerabilities that we report which affords the models to be adopted without nomenclature differences between different software engineers.
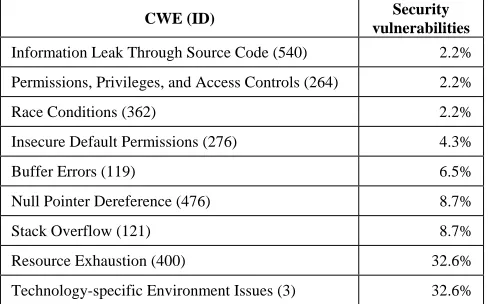
The CWE contains high- and low-level descriptions of vulnerabilities. For example, the CWE classification (ID) Buffer Errors (119) can include stack overflows and heap overflows. A more specific CWE classification is Stack Overflow (121), which is specific to overflows on the stack and Heap Overflow (122) is specific to overflows on the heap. We mapped the vulnerabilities found in the failure reports to the most specific classification. If not enough information was given in the failure report to distinguish between a high-level and specific CWE classification, then the high-level classification name was assigned to the vulnerability. We assigned the CWE classification identifier Technology-specific Environment Issues (3) to vulnerabilities in our system that were not listed in the CWE. Vulnerabilities in the Technology-specific Environment Issues (3) included network security vulnerabilities, vulnerabilities specific to the software’s design and operation, and absent or weak logging for security audits. Table 1 shows our mapping of vulnerabilities to nine of the ~550 CWE classifications.
For our analysis, we identified components as attack-prone if they were associated with a security failure. Since our work was performed in the context of failures (i.e. execution of the software), we label the components as attack-prone instead of vulnerability-prone. An example of a vulnerability-prone component is a component that contains vulnerabilities discovered by static inspections (e.g. ASA), but we do not address these components in this paper. We manually classified a component as pre-release attack-prone if it had at least one
pre-release security failure. A component with no pre-release failures was classified as a non attack-prone component. Likewise, a post-release attack-prone component contained at least one post-release failure while a non attack-prone component contained no post-release failures. We use the threshold of one failure because there is little variability in the failure count per component and only one attack is needed to cause substantial business loss. The post-release failures were not necessarily due to attacks. However, according to the failure report and the security engineer, the vulnerability could have been exploited maliciously and thus we consider the failure an “attack” for the purposes of this paper. No malicious attacks were reported for the software system.
Table 1. Vulnerabilities present in the software system used in our analysis. The ratio of the type of vulnerability to the total number of vulnerabilities is given in the right column.
CWE (ID) Security
vulnerabilities Information Leak Through Source Code (540) 2.2%
Permissions, Privileges, and Access Controls (264) 2.2%
Race Conditions (362) 2.2%
Insecure Default Permissions (276) 4.3%
Buffer Errors (119) 6.5%
Null Pointer Dereference (476) 8.7%
Stack Overflow (121) 8.7%
Resource Exhaustion (400) 32.6%
Technology-specific Environment Issues (3) 32.6%
4.3
Adherence to the Pareto Law
According to Pareto’s law, 80% of the outcomes will be derived from 20% of the activities [15]. Although, this observation was originally described in the context of economics, it has also been used to describe the distribution of faults in a software system. The application of the law is that software problems will not be evenly distributed across the software system. For example, in a survey of multiple software systems it was shown that between 60% and 90% of software faults are due to 20% of the modules [6]. The result of the manual analysis of the components in our system showed that ten (40%) of the components were pre-release attack-prone while four (16%) of the components were post-release attack-prone. The distribution of attacks among the components in our data set obeys Pareto’s law because the vulnerabilities are not evenly distributed across all components.
4.4
Classification of Alerts According to the
CWE
at the FlexeLint website8 and the descriptions given in the audited FlexeLint report provided enough information on which alert type belonged to the alert group and CWE classification. The three subsets together represent 16 of the 2000 FlexeLint alert types.
Approximately 72.4% of the audited alerts were categorized into the three security-based alert groups. Only 23.5% of the total un-audited FlexeLint output was used to create the three groups. When referring to the combination of three security groups of security alerts in our analyses, we will use the term “total security alerts.” Percentages of the security-based alerts as compared to the overall number of alerts are given in Table 3. Buffer overflow alerts constitute approximately half of all audited alerts. We will use the term “total alerts” for the remainder of the paper to denote all alerts (security-based and non security-based) from the FlexeLint output.
Table 2. Alert groups with CWE name and alert codes.
Alert group CWE classification (ID)
FlexeLint alert codes
buffer overrun Buffer Errors (119) Stack Overflow (121)
415, 416, 419, 420, 661, 662, 669, 670
memory leak Resource Exhaustion (400)
423, 429, 672, 1540
null pointer Null Pointer Dereference (476)
412, 418, 613, 668
FlexeLint was not able to detect all of the vulnerabilities in the system identified by pre- and post-release system test failures. The classes of faults detectable by FlexeLint are listed on the publicly available web page and could be compared against our list of vulnerabilities. The types of vulnerabilities not detected were: Information Leak Through Source Code (540), Technology-specific Environment Issues (3), Insecure Default Permissions (276), and Permissions, Privileges, and Access Controls (264). Therefore, 41.3% of the security vulnerabilities identified in the failure reports were not detectable by FlexeLint.
Table 3. Audited and un-audited ASA alerts from FlexeLint and the percentage of the total number of alerts.
Audited Un-audited
ASA security-based alerts
% Total alerts
buffer overrun 50.1%
memory leak 14.1%
Audited (72.4%)
null pointer 8.2%
buffer overrun 1.7%
memory leak 2.4%
un-audited (23.5%)
null pointer 19.4%
4.5
Hypotheses
Our hypotheses are centered on whether or not alerts associate with security-based failures. The null and alternative hypotheses are now listed:
H0: Internal metrics cannot distinguish between attack-prone and non attack-prone components.
8
http://www.gimpel-online.com/MsgRef.html
HA:Internal metrics can be used to distinguish between attack-prone and non attack-attack-prone components.
5.
LIMITATIONS
Our security data are sparse. Our analysis included only 3.7% of the organization’s faults making statistical analyses difficult and reducing the confidence in our models. Additionally, we had a small sample size of 25 components to partition, making analyses difficult; an analysis at the file-level was not possible. The models that fit our system may not fit all software systems due to differences such as architecture, programming language, and developers. Also, after testing is complete, we can only know detected faults; we do not know which faults still remain [13]. Thus, our analysis is based on incomplete vulnerability discovery. Additionally, system and feature-level testing may not be adequate for detecting all vulnerabilities while using other techniques (e.g. architectural risk analyses) may be suitable for finding different types of security vulnerabilities. The analysis of pre-release failures is based upon the testers’ abilities to find robustness problems that enable an attack. Furthermore, our ASA analysis is based upon only one ASA tool, FlexeLint, and may not be representative of the predictive power of other ASA tools.
There was some subjective interpretation in the analysis of pre- and post-release failure reports though the cross examination between two doctoral students and one industrial security expert strengthens our results. Also, we could not determine if testing effort was equal for all components; it may have been driven by factors such as churn or code size. Lastly, once the model is applied, the model is not guaranteed to be effective for the next revision of the software.
6.
CORRELATION RESULTS
In this section, we show correlations between our external and internal metrics and correlations between the internal metrics.
6.1
Correlations Between Internal Metrics
and Security Failure Counts
We calculated Spearman rank correlations9 between the internal metrics and security failure counts of the system components as shown in Table 4. The strongest but yet modest correlation (0.43) was found between SLOC and post-release security failure count. This correlation indicates there is a positive association between SLOC and security failures and that an increase in SLOC is accompanied with some general post-release security failure count. The correlation coefficient between total security alerts and pre- and post-release failures was similar to that of SLOC.
The correlations listed in Table 4 that are smaller than 0.4 represent low correlations between the internal metrics and failure counts. The correlations represent that there is little positive association between alert counts and a security failure counts. For our system, the correlations less than 0.4 indicate there is only a marginal increase in security failure count as the internal metrics increase.
9
Table 4. Spearman rank correlations between ASA alert counts and security failure counts. Alert metric is the count of alerts.
FlexeLint
output Metric
Security failure count
Spearman rank (p-value) total security
alerts
pre- and post-release
0.42 (0.04) total security
alerts pre-release
0.42 (0.04) total security
alerts post-release
0.37 (0.06) audited
total alerts pre- and post-release
0.39 (0.05)
un-audited memory leak post-release 0.38 (0.05)
SLOC post-release 0.43 (0.03)
churn pre-,
post-release, or both Not sig.
We were unable to fit our data into a generalized linear regression model where alert density was the input variable with and failure density the response variable. We tried Poisson, zero-inflated Poisson, negative binomial, and zero-inflated negative-binomial to determine if associations were present, but the results contained a large amount of deviance making the results inconclusive. However, we were able to use logistic regression (see Section 7.3).
6.2
Correlations Between Internal Metrics
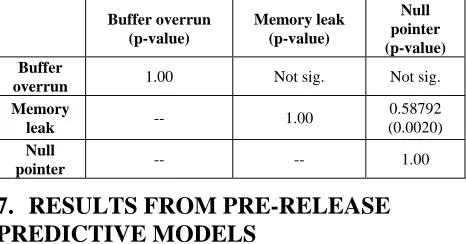
We show correlations between the internal metrics in Table 5. These security alerts are composed of buffer overruns, memory leak alerts, and null pointer alerts (see Section 4.4). The Spearman correlation coefficients indicate that the density of memory leak alerts and null pointer alerts are moderately correlated. Therefore, where there are memory leaks, there are null pointers in our system.We also found the Spearman rank correlation coefficient (not shown in Table 5) between churn and SLOC to be 0.78 (p<.0001) suggesting that churn and SLOC strongly correlated.
Table 5. Spearman rank correlation coefficients between the densities (audited) of ASA alerts.
Buffer overrun (p-value)
Memory leak (p-value)
Null pointer (p-value) Buffer
overrun 1.00 Not sig. Not sig.
Memory
leak -- 1.00
0.58792 (0.0020) Null
pointer -- -- 1.00
7.
RESULTS FROM PRE-RELEASE
PREDICTIVE MODELS
The models we build may identify the internal metrics that best predict which components are prone and non attack-prone. Our nine predictive models included the recursive partitioning and logistic regression statistical techniques10 with
10
Performed on SAS JMP 6.0.3.
the following three internal predictors: ASA alerts, churn, and SLOC. We approached model building in a stepwise fashion where we analyze how each metric performs individually and then combine the metrics into one model. If the predictions generated by our models are consistent with the post hoc manual classifications based upon testing results and customer reports, then the models may be a viable approach to prioritizing security-based verification efforts for our software system. We used a dichotomized scheme (attack-prone or non attack-prone) for component classification in our models as described in Section 4.2. In our setting, Type I and Type II errors are as follows:
Type I error (false positive) - a non attack-prone component that was predicted to be attack-prone.
Type II error (false negative) - an attack-prone component that was predicted to be non attack-prone.
To validate the efficacy of each model, we evaluate the models with two techniques: k-fold cross-validation and receiver operating characteristic (ROC) curves. We cross-validated the R2 to determine how much variation was accounted for by the model rather than by random error. In our setting we used five-fold cross-validation where there were five groups of components, each consisting of an equal number of randomly chosen components. Five has been shown to be a good value for performing cross-validation [19]. One group was used as the test set and the training set contained the other four groups. The R2 of the training set was compared to the test set during five trials where each group was allowed to be in the test set once.
The second test was with the ROC curve. With ROC, a curve is drawn on a graph where the true positive rate of attack-prone component identification is on the y-axis and the false positive rate on the x-axis. The true positive rate is the probability that the attack-prone prediction is correct. The false positive rate is the probability that the attack-prone prediction is incorrect when a component is not attack-prone. The area under the curve measures how well the predictors estimate the probability a component is attack-prone.
Our predictive models are comprised of a statistical technique, the predictors (metrics), the response variables (pre-release and post-release failures), and the data set under analysis. Our models can be differentiated from those in Section 3.1, 3.2, and 3.3 because we use ASA alerts, churn, and SLOC as predictors in the same model. Furthermore, the work performed by Nagappan et al. [32] and Zheng et al. [42] was performed with discriminant analysis while we used recursive partitioning. Recursive partitioning is similar to discriminant analysis in that both lead to classifiers of component vulnerability based on functions of metrics. The difference is the choice of functions; recursive partitioning uses successive dichotomizations of the metrics, discriminant analysis uses linear combinations of metrics, so that the former is considered a parametric procedure, and the latter a non-parametric procedure.
7.1
Predictive Model 1: ASA Alerts
density of alerts) and the upper partition (the higher count or density of alerts). Model 1 uses recursive partitioning with the following ASA alerts as predictors in our models: count and density of audited and un-audited null pointer, memory leak, buffer overrun alerts, the combination of the previous three security-related alerts, and all of the reported FlexeLint alerts. According to the alternative hypothesis, we expect that the more alerts in the component, the more likely the component is attack-prone. Therefore, the upper partition resulting from the split will be interpreted as having true positives when containing attack-prone components, and if attack-prone components exist in the lower partition, then they are Type II errors.
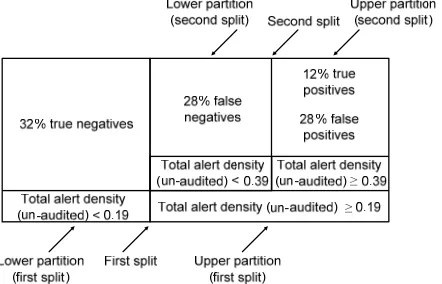
The first split with recursive partitioning was based on total alert density. Of all the ASA alert metrics, the total alert density served as the best metric for separation based on the functions of the metric that maximize the difference between attack-prone components and non attack-prone components. The upper partition correctly identified 40% (100% of the attack-prone components) of the components as attack-prone, but had a 28% Type I error rate where components were misclassified as attack-prone. The lower partition contained 32% true negatives. The value of total alert density at the split is 0.19 alerts/KLOC. That is, a component with a total alert density below 0.19 alerts/KLOC is in the lower partition and a component with an alert density greater than or equal to 0.19 alerts/KLOC is in the upper partition. The p-value of the split is 0.012 and the root mean square, R2, is 31.5%.
The value of R2 is low which indicates that the proportion of the response that can be attributed to the alerts is small compared to that of standard error. Therefore, we made a second split to increase the ability of the model to account for more variability. The second split again used total alert density of all of the possible metrics and produced the split in the upper partition of the first split. The value for the total alert density at the split is 0.39 alerts/KLOC. The p-value for the second split is .007 and the R2 is 32.2%. The combined R2 of the model is therefore 63.7%. Twelve percent of the attack-prone components are in the upper partition of the second split and 28% in the lower partition. The 28% misclassification (shown in lower partition of the second split in Figure 1) was originally correctly classified as attack-prone by the first split, but the second split misclassified them as non attack-prone. The second split indicates that the higher alert density, then the less chance that a component is attack-prone, contradicting the first split. No further splitting with a p-value at or less than .05 was possible. We do not include the second split in our model because it is not intuitive for software engineers to use a model that indicates more alerts means that a component is less likely to be attack-prone. See Figure 1 for a summary of the recursive partitioning results.
The average R2 in the cross-validation was taken from the five
trials and was calculated as 60.7% suggesting that the R2 is correct within the overall model. The area under the ROC curve
for Model 1 is 93.0%. The large area under the curve indicates that the predictors for each model are accurate at specifying attack-prone components.
Figure 1: Model 1 after two splits with recursive partitioning to separate attack-prone from non attack-prone components.
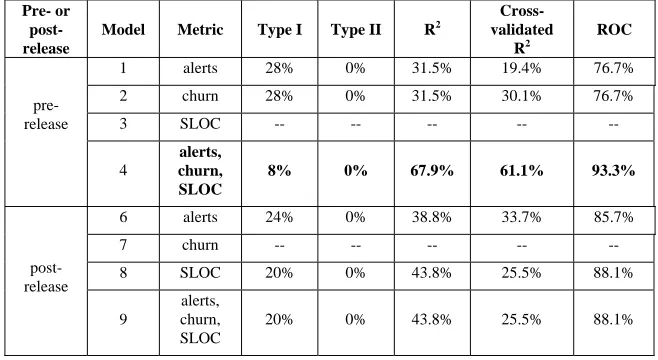
A summary of the results from Model 1 and the following models are presented in Table 6. The Type I and II error rates, R2, validated R2, and ROC curve values are reported in Table 6 for the remainder of the paper unless explicitly stated for emphasis.
There are several possible reasons why the second split showed that a higher alert density means there is less of a chance that a component is attack-prone. First, we found that there was no correlation between total alert density and pre-release security failure count. Therefore, an increase in alert density does not follow an increase in security failure count. Secondly, the metric, total alert density includes all alerts, both security-related and not security-security-related, which inflated the alert density value. Lastly, system testers may be finding vulnerabilities that ASA cannot find and ASA may be finding faults in components that the testers do not find.
Observation 1: ASA alerts by themselves cannot accurately
predict pre-release attack-prone components.
7.2
Predictive Models 2 and 3: Churn and
SLOC
We attempted to build predictive models with churn and SLOC by themselves, but we were unsuccessful. In Model 2, we used churn as the single predictor and only one split (p=.01) was possible. The value of the churn at the split is 3,861 SLOC. No further splits at or below the .05 level could be made.
Observation 2: Code churn by itself cannot accurately predict
Table 6: Summary of recursive partitioning models results after all statistically significant splits have been made.
Pre- or post-release
Model Metric Type I Type II R2
Cross-validated
R2
ROC
1 alerts 28% 0% 31.5% 19.4% 76.7%
2 churn 28% 0% 31.5% 30.1% 76.7%
3 SLOC -- -- -- -- --
pre-release
4
alerts, churn, SLOC
8% 0% 67.9% 61.1% 93.3%
6 alerts 24% 0% 38.8% 33.7% 85.7%
7 churn -- -- -- -- --
8 SLOC 20% 0% 43.8% 25.5% 88.1%
post-release
9
alerts, churn, SLOC
20% 0% 43.8% 25.5% 88.1%
We also tried modeling with churn normalized against SLOC according to Nagappan et al. [33]. We found that only one split could be made with 36% Type I errors and no Type II errors. The R2 was only 21.9%. The R2 values aretoo low to accept as potential models.
We also tried to predict attack-prone components with SLOC as the only metric in Model 3, but no splits were possible at or below the .05 level. We did not build a model with SLOC and churn together because these metrics are strongly correlated (see Section 6.2) and thus likely have the same predictive power.
Observation 3: SLOC by itself cannot accurately predict
pre-release attack-prone components.
7.3
Predictive Models 4 and 5: Alerts,
Churn, and SLOC
We created a model, Model 4, with the following predictors: alerts, churn and SLOC. The first split was determined by churn and had 100% of the attack-prone components in the upper partition with a Type I error rate of 28%. The value of churn at the split is 3,861 SLOC with an R2 of 31.5%. The p-value is .012. We performed another split and the metric chosen was total alert density.
The total alert density further separated the attack-prone and non attack-prone components in the upper partition from the first split. The results showed that the higher the alert density, the more likely the component was attack-prone. The value of the alert density at the split was 0.19 alerts/KLOC and the p-value for the second split was less than .0001.
Since Model 4 indicated that two different metrics, churn and alerts, could be combined we tried using discriminant analysis to distinguish attack-prone from non attack-prone components. There was no correlation between churn and total alert density and thus multi-collinearity is not a concern. The model did not exhibit a goodness-of-fit to the data to discriminate between attack-prone and non attack-prone components.
For Model 5, we utilized logistic regression, a linear regression technique used in generalized linear models, to identify attack-prone and non attack-attack-prone components. The tests from the whole-model fit, which compares the model to a model with just the intercept (i.e. without the three predictors) is shown in Table 7. The probability that the model fits better than with just the intercept parameter is given by the Prob>ChiSq, 0.0009, which indicates the model fits better than with just the intercept parameter.
Table 7: Logistic regression whole model test for Model 5.
Model -LogLikelihood ChiSquare Prob>ChiSq
Difference 8.24 16.5 0.0009
Full 8.06
Reduced 16.30
Table 8: Significance of predictors in Model 5. Note: For logistic regression, total alert density was measured in 100KLOC.
Predictor Prob>ChiSq Unit Odds
Ratio
churn .0573 1.0
total alert density .0527 1.77 (churn-17650.7)*
(totalAlertDensity-41.7)
.0720 1.0
Observation 4: ASA alerts and code churn can predict pre-release attack-prone components.
7.4
Interpretation of Results
The results from Model 1 are inconclusive for determining if the ASA alerts can distinguish between attack-prone and non attack-prone. The total alert density in the second split represents that more alerts means less security failures, and there was no correlation between the alerts and failures. However, Models 4 and 5 represent that components with high churn and high total alert density are more likely to be attack-prone. The total output of FlexeLint in total alert density was a better predictor than our security-based alerts. Models 1, 4, and 5 have similar R2 values and ROC curves, but Model 1 had more Type II errors (28%) than Models 4 or 5. Therefore, we do not accept the null hypothesis. The R2 values for the models are modest, but they do provide some guidance on how security efforts can be prioritized.
8.
RESULTS FROM POST-RELEASE
PREDICTIVE MODELS
We now present models that attempt to predict which components are post-release attack-prone. There were only four components that had post-release security failures. Each component also contained pre-release security failures. With such a small sample size, we have to be skeptical about the statistical results and how the models may apply to our software system.
8.1
Predictive Model 6: Alerts
In Model 6, we performed recursive partitioning with the same predictors as Model 1. The first split was achieved with the count (383) of un-audited null pointer alerts. The p-value for the split was 0.038 the R2 was 38.8%. We performed another split and the density of un-audited null pointer alerts (value=12.65alerts/KLOC) was chosen as the best metric. The p-value for the split was .025 and the R2 was 38.4%. The
second split for Model 6 indicated that the higher the un-audited alert density was, the less likely a component was attack-prone. No further splitting was possible at or below the .05. The false positive rate in the un-audited alerts may have inflated the alert count and thus may have influenced Model 6 to suggest that more alerts means less security failures. As with Model 1, the results are inconclusive as to whether or not alerts can accurately predict attack-prone components. As with Model 1, we disregard the values of the second split.
8.2
Predictive Model 7 and 8: Churn and
SLOC
We attempted to build a model, Model 7, with churn by itself, but no splits were possible at or below the .05 level. Model 8
consisted of SLOC alone. One split was possible where the p-value was 0.021. The p-value of the split was 34,052 SLOC. No further splits were possible at or below the .05 level. The R2 value is too small to accept as an accurate predictive model.
8.3
Predictive Model 9: Alerts, Churn, and
SLOC
We created a model, Model 9, with alerts, churn and SLOC as predictors to predict attack-prone components. The first split in the recursive partitioning was achieved with SLOC. The result is the same as Model 8. We tried to perform discriminant analysis and logistic regression with alerts, churn, and SLOC metrics, but the models suffered from lack of fit.
Observation 5: No combination of ASA alerts, churn, and
SLOC can accurately predict post-release attack-prone components.
9.
DISCUSSION
While no single fault detection technique can detect all problems, static analysis tools have been shown to predict reliability problems that are not explicitly detected by ASA based on alert counts and density [32, 42]. ASA tools analyze code and are thus more apt at coding problems then the more complex, high-level design or operational problems identified by testing. In our research, Models 4 and 5 indicate that ASA alerts can, in part, identify components that contained vulnerabilities identified by late-cycle robustness testing. As mentioned in Section 4.2, 41.3% of the vulnerabilities could not have been detected by FlexeLint suggesting that the 58.6% of the code-related vulnerabilities could predict more complex problems in the software. However, the correlations in Table 4 and the modest R2 values indicate that the relationship between alerts and vulnerabilities identified by testing is not strong.
The association of simple faults to complex faults is known as the coupling effect [11]. The coupling effect has also been observed in the context of mutation testing [28, 35]. Evidence of the coupling effect shows that ASA can be used while code is written to identify coding faults as well as predict that more complex design and operational vulnerabilities exist.
10.
SUMMARY AND FUTURE WORK
11.
ACKNOWLEDGEMENTS
This work is supported by the National Science Foundation under CAREER Grant No. 0346903. Any opinions, findings, and conclusions or recommendations expressed in this material are those of the authors and do not necessarily reflect the views of the National Science Foundation. Thanks to Yonghee Shin for her help with data collection. Also, thanks to the NCSU RealSearch group for their helpful review.
12.
REFERENCES
[1] O. H. Alhazmi, Y. K. Malaiya, and I. Ray, "Measuring, analyzing and predicting vulnerabilities in software systems," Computers & Security, vol. 26, no. 3, pp. 219-228, May 2006.
[2] E. Arisholm and L. Briand, "Predicting Fault-prone Components in a Java Legacy System," Proc of the 5th ACM-IEEE International Symposium on Empirical Software Engineering, Rio de Janeiro, Brazil, pp. 8-17, 21-22 September 2006.
[3] S. Barnum and M. Gegick, "Design Principles,"
https://buildsecurityin.us-cert.gov/portal/article/knowledge/Principles, 2005. [4] V. Basili, L. Briand, and W. Melo, "A Validation of Object
Oriented Design Metrics as Quality Indicators," IEEE Transactions on Software Engineering, vol. 22, no. 10, pp. 751-761, 1996.
[5] V. Basili and B. T. Perricone, "Software Errors and Complexity: An Empirical Investigation," Communications ACM, vol. 27, no. 1, pp. 42-52, 1984.
[6] B. Boehm and V. Basili, "Software Defect Reduction Top 10 List," IEEE Computer, vol. 34, no. 1, pp. 135-137, 2001.
[7] B. W. Boehm, Software Engineering Economics, Englewood Cliffs, NJ, Prentice-Hall, Inc., 1981.
[8] P. Chandra, B. Chess, and J. Steven, "Putting the Tools to Work: How to Succeed with Source Code Analysis," IEEE Security & Privacy, vol. 4, no. 3, pp. 80-83, 2006.
[9] B. Chess and J. West, Secure Programming with Static Analysis, Boston, MA, Addison Wesley, 2007.
[10] S. G. Crawford, A. A. McIntosh, and D. Pregibon, "An analysis of static metrics and faults in C software," Journal of Systems and Software, vol. 5, no. 1, pp. 37-48, February 1985.
[11] R. A. DeMillo, R. J. Lipton, and F. G. Sayward, "Hints on test data selection: Help for the practicing programmer," IEEE Computer, vol. 11, no. 4, pp. 34-41, 1978.
[12] G. Denaro, "Estimating software fault-proneness for tuning testing activities," Proc of theInternational Conference on Software Engineering, St. Malo, France, pp. 269-280, 2000.
[13] E. Dijkstra, Structured Programming, Brussels, Belgium, 1970.
[14] S. Elbaum and J. Munson, "Code Churn: A Measure for Estimating the Impact of Code Change," Proc of the International Conference Software Maintenance, 24-31 November 1998.
[15] A. Endres and R. D. Rombach, A Handbook of Software and Systems Engineering, Harlow, England, Pearson Education, Limited, 2003.
[16] N. E. Fenton and N. Ohlsson, "Quantitative Analysis of Faults and Failures in a Complex Software System," IEEE Transactions on Software Engineering, vol. 26, no. 8, pp. 797-814, August 2000.
[17] M. Gegick and L. Williams, "Correlating Automated Static Analysis Alert Density to Reported Vulnerabilities in Sendmail," Proc of the MetriCon 2.0 at 16th USENIX Security Symposium (Security '07), Boston, MA, August 2007.
[18] M. Gegick and L. Williams, "Toward the Use of Static Analysis Alerts for Early Identification of Vulnerability- and Attack-prone Components," Proc of the First International Workshop on Systems Vulnerabilities (SYVUL ’07) at the First International Conference on Global Defense and Business Continuity, Santa Clara, CA, July 1-6 2007.
[19] T. Hastie, R. Tibshirani, and J. H. Friedman, The Elements of Statistical Learning, New York, Springer, 2001. [20] S. Heckman and L. Williams, "Automated adaptive ranking
and filtering of static analysis alerts," Proc of the Fast abstract at the International Symposium on Software Reliability Engineering (ISSRE), Raleigh, NC, November 2006.
[21] R. Hochman, T. Khoshgoftaar, E. B. Allen, and J. Hudepohl, "Evolutionary Neural Networks: A Robust Approach to Software Reliability Problems," Proc of the Eighth International Symposium on Software Reliability Engineering, Albuquerque, New Mexico, pp. 13-26, September 1997.
[22] R. Hochman, T. M. Khoshgoftaar, E. B. Allen, and J. Hudepohl, "Using the Genetic Algorithm to Build Optimal Neural Networks for Fault-Prone Model Detection," Proc of the Seventh International Symposium on Software Reliability Engineering, pp. 152-162, 1996.
[23] G. Hoglund and G. McGraw, Exploiting Software, Boston, Addison-Wesley, 2004.
[24] ISO, "ISO/IEC DIS 14598-1 Information Technology - Software Product Evaluation - Part 1: General Overview," October 28 1996.
[25] ISO/IEC 24765, "Software and Systems Engineering Vocabulary,"
http://pascal.computer.org/sev_display/index.action, 2006. [26] T. M. Khoshgoftaar, E. B. Allen, J. P. Hudepohl, and W.
Jones, "Classification Tree Models of Software Quality over Multiple Releases," Proc of the 10th International Symposium on Software Reliability Engineering, pp. 116-125, 1999.
[27] I. Krsul, "Software Vulnerability Analysis," PhD Thesis in Computer Science at Purdue University, West Lafayette, 1998.
[28] R. J. Lipton and F. G. Sayward, "The Status of Research on Program Mutation," Proc of theIn Digest for the Workshop on Software Testing and Test Documentation, pp. 355-373, December 1978.
[29] T. Menzies, J. Greenwald, and A. Frank, "Data Mining Static Code Attributes to Learn Defect Predictors," IEEE Transactions on Software Engineering, vol. 33, no. 1, pp. 2-13, January 2007.
[30] MITRE, "Common Weakness Enumeration,"
[31] J. Munson and T. Khoshgoftaar, "The Detection of Fault-Prone Programs," IEEE Transactions on Software Engineering, vol. 18, no. 5, pp. 423-433, 1992.
[32] N. Nagappan and T. Ball, "Static Analysis Tools as Early Indicators of Pre-release Defect Density," Proc of the International Conference on Software Engineering, St. Louis, MO, pp. 580-586, 2005.
[33] N. Nagappan and T. Ball, "Use of Relative Code Churn Measures to Predict Defect Density," Proc of the International Conference on Software Engineering, St. Louis, MO, pp. 284-292, 15-21 May 2005.
[34] S. Neuhaus, T. Zimmermann, C. Holler, and A. Zeller, "Predicting Vulnerable Software Components," Proc of the Computer and Communications Security, Alexandria, Va, pp. 529-540, 29 October-2 November 2007.
[35] A. J. Offutt, "The Coupling Effect: Fact or Fiction?," Proc of the International Symposium on Software Testing and Analysis, Key West, Florida, pp. 131-140, 1989.
[36] T. J. Ostrand, E. J. Weyuker, and R. M. Bell, "Where the bugs are," Proc of the International Symposium on Software Testing and Analysis, Boston, Massachusetts, pp. 86-96, 2004.
[37] V. Prevelakis and D. Spinellis, "The Athens Affair," IEEE Spectrum, vol. 44, no. 7, pp. 26-33, 2007.
[38] Reasoning Inc., "Automated Software Inspection: A new Approach to Increase Software Quality and Productivity,"
http://www.reasoning.com/pdf/ASI.pdf, 2003.
[39] SAS Institute Inc., "The Partition Platform," SAS Institute, Inc., Cary, NC, 2003.
[40] A. Schroter, T. Zimmermann, and A. Zeller, "Predicting Component Failures at Design Time," Proc of the International Symposium on Empirical Software Engineering, Rio de Janeiro, Brazil, pp. 18-27, September 21-22 2006.
[41] K. Tsipenyui, B. Chess, and G. McGraw, "Seven Pernicious Kingdoms: A Taxonomy of Software Security Errors," Proc of the Automated Software Engineering, Long Beach, CA, November 7-8 2005.