Int J Clin Exp Pathol (2009) 2, 275-285
www.ijcep.com
/IJCEP810002
Original Article
Gene Expression Profiling Reveals a Diverse Array of
Pathways Inhibited by Nuclear Receptor SHP during
Adipogenesis
Guisheng Song1, Kyungtae Park2 and Li Wang1
1Departments of Medicine and Oncological Sciences, Huntsman Cancer Institute, University of Utah School of Medicine, Salt Lake City, UT, USA and 2Department of Microbiology, Molecular Genetics & Immunology, University of Kansas Medical Center, Kansas City, KS, USA
Received 3 October 2008; Accepted 10 October 2008; Available online 03 November 2008
Abstract: Orphan receptor small heterodimer partner (SHP, NROB2) has been shown to be a metabolic regulator in pathways associated with several major aspects of the metabolic syndrome. However, the significance and transcriptional regulatory role of SHP in adipocyte differentiation remain unclear. Transcriptional profiles of 3T3-L1 preadipocytes and early differentiating preadipocytes in response to SHP were systemically surveyed using Affymetrix Genome Array representing well-characterized 14,000 genes. Analysis revealed about 963 genes that were up- or down-regulated by more than 2-fold during differentiation and/or by the overexpression of SHP. These genes were organized into 4 clusters that demonstrated concerted changes in expression of genes controlling various aspects of the cellular events and metabolism. Quantitative PCR was employed to further characterize gene expression and led to the identification of several key regulators and stimulators of the adipogenic program as potential new SHP targets. Overexpression of SHP inhibited the differentiation process as well as the accumulation of neutral lipids within the cells. Our data suggests that SHP may function as a molecular switch that governs adipogenesis and a potent adipogenic suppressor that maintains preadipocytes in an undifferentiated state through inhibition of the adipogenic transcription factors and stimulators. Developing SHP agonist may promise a future treatment for obesity.
Key Words: nuclear receptor, gene expression profiling, microarray, SHP, adipocyte differentiation
Introduction
Obesity is a prevalent health problem in USA and is a major risk factor for a number of metabolic diseases ranging from insulin resistance and type 2 diabetes mellitus to atherosclerosis and nonalcoholic fatty liver disease [1]. Obesity is mainly resulted from an excess of white adipose tissue (WAT), the major energy reserve in higher eukaryotes [2]. The past decade has seen tremendous advances in our understanding the process of adipocyte differentiation, in delineating the cellular and molecular basis of key transcription factors in adipogenesis, as well as extracellular effectors and intracellular
__________
These authors contribute equally to this work.
signaling pathways that regulate fat cell formation [3].
differentiation in preadipocytes [8]. More recently, new transcription factors or transcriptional pathways are also implicated in the control of adipogenesis. Extracellular inhibitors, including cytokines, lipid molecules, genistein, protease inhibitors, and intracellular signaling molecules, including preadipocyte factor 1 (Pref-1), forkhead box o1 (Foxo1), forkhead box a2 (Foxa2), SMAD family member 3 (SMAD-3), wingless-type MMTV integration site family member 10b (WNT-10b), transcription factor GATA sequence binding protein GATA-2 and GATA-3, have been identified to negatively regulate adipogenesis [9]. For instance, GATA (-2 and -3) family of transcription factors are inhibitors of preadipocyte-adipocyte transition as their constitutive expression suppressed adipocyte differentiation and trapped cells at the preadipocyte stage [10]. A most recent observation suggests that early B cell factors (Ebfs) can induce earliest stage adipogenic program in multipotent fibroblasts [11]. Understanding the balance between positive and negative regulators of adipogenesis has important clinical implications for anti-obesity therapy and lipodystrophy.
Orphan nuclear receptor small heterodimer partner (SHP) has been established as an important transcriptional repressor and metabolic regulator [12]. Loss of SHP function resulted in a marked morphological change in brown adipose tissue (BAT) of the neonatal mice [13] and a strong activation of PPARγ2 expression in WAT [14]. However, these analyses have relied on a sampling of gene expression rather than the examination of genome-wide expression patterns. To determine the role of SHP in adipogenesis, we overexpressed SHP in 3T3-L1 preadipocyte cells and examined differential gene expression profiling during early adipocyte differentiation using an Affymetrix oligonucleotide microarray. Our data revealed a diverse array of genes and pathways that were regulated by SHP, especially genes involved in adipocyte differentiation, suggesting an important function of SHP in controlling the overall adipogenic program. The transcriptional patterns revealed in this study may further the understanding of the adipogenesis process and the function of SHP repression.
Materials and Methods
Cell Culture and Induction of Differentiation
3T3-L1 preadipocytes were maintained and propagated in DMEM containing 10% (vol/vol) calf serum. Two-day postconfluent (designated day 0) cells were induced to differentiate with DMEM containing 10% (vol/vol) fetal bovine serum, 1 µg of insulin per ml, 1 µM dexamethasone, and 0.5 mM 3-isobutyl-1-methyl-xanthine until day 2. Cells were then fed DMEM supplemented with 10% fetal bovine serum and 1 µg insulin per ml for 2 days, after which they were fed every other day with DMEM containing 10% fetal bovine serum. Expression of adipocyte genes and acquisition of the adipocyte phenotype begins on day 3 and is maximal by day 8. Oil-red O staining was performed as previously described [15].
Adenoviral Transduction
Recombinant adenoviruses for expression of SHP and the GFP control were described [14]. Cells were plated at 2 X 10⁶per 10 cm dish,
cultured to 70-80% confluence and infected the next day with viral supernatant at multiplicity of infection (MOI) of 50 for 2 hr. Virus containing media were removed and cells were continuously cultured for 2 days. Total RNA was isolated and Northern blot was performed following standard procedures [13].
Microarray Hybridization, Staining and Data Analysis
RNA quality was assessed by using the Agilent Model 2100 Bioanalyzer (Agilent Technologies). The KUMC Microarray Facility utilized the Affymetrix (Santa Clara) GeneChip®
45°C/60 rpm in a GeneChip hybridization oven 640. Hybridized GeneChips underwent low and high stringency washing and R-Phycoerythrin- Streptavidin staining procedures using the GeneChip fluidics station 450. GeneChips were scanned using a Genechip scanner 3000 7G with autoloader. Fluidics and scan functions were controlled by GCOS software version 1.4. Expression values were generated by using Microarray Suite (MAS) v5.0 software (Affymetrix). The further analysis of data was finished using the software GeneSpring 7.2.
Real-time qPCR Analysis
Total RNA extraction from 3T3-L1 cells was performed using RNAeasy Mini Kit (Qiagen). Genomic DNA contaminants were removed from RNA samples by incubating the RNA solution with DNase I (RNase free) at 37°C for 20 min. RT was carried out with the SuperScript II First-Strand Synthesis System for RT-PCR (Invitrogen) according to the manufacturer’s protocol. First, the following RNA/primer mixture was prepared in separate tubes: 5 μg RNA, 1 μl oligo(dT)18 (50 μm/μl) and 1 μl 10 mM dNTP mix. Volumes are adjusted with DEPC-treated H2O to a final
volume of 10 μl. Next, reactions were incubated at 65°C for 5 min and placed on ice for at least one minute. To each reaction, 5x RT Buffer (4 μl), 0.1 M DTT (2 μl) and RNaseOUT (1 μl) were added and then incubated at room temperature for 2 min. Finally, 200 units of SuperScript II RT was added to each tube, incubated at 42°C for 50 min and heat inactivated at 70°C for 10 min. Products were stored at -20°C until use in real-time PCR experiments.
Q-PCR primers were designed using Primer Express (Applied Biosystems) with a melting temperature of 60°C and an average length of 18-24 bp. The average amplicon length is 80-120 bp. Primer specificity was verified by Blast searches of the NCBI database. Real-time PCR was performed with Applied Biosystems 7500 Real-Time PCR System in 96-well reaction plates using parameters recommended by the manufacturer (95°C for 10 min, 40 cycles of 95°C for 30 s, 60°C for 30 s). Each PCR reaction was performed in triplicate and “no template” control was included. Specificity of the amplification was verified at the end of the PCR run using the Opticon monitorTM analysis software. Statistical
analyses were performed by the 2–∆∆CT method
[16]. The CT values obtained by the real-time PCR equipment were imported into a spreadsheet program. Data was then analyzed using the equation 2–∆∆CT, where ΔΔCT=(CT,
Target - CT, Actin)Target sample - (CT, Target - CT,
Actin)Calculator. Real-time quantitative PCR
experiments were performed in triplicate. The oligonucleotides used in real-time quantitative PCR analysis were listed in Supplemental Table 1.
Statistical Analysis
Data are expressed as mean ± SD. Statistical analyses were carried out using Student’s unpaired t test; p < 0.01 was considered statistically significant.
Results and Discussion
Microarray Analysis of Modulated Genes during 3T3-L1 Early Adipogenic Differentiation
To gain insight into the molecular mechanisms of SHP involved in adipogenesis and to identify potential early responsive genes targeted by SHP, we used Affymetrix microarrays to analyze the differences in mRNA levels of genes in 3T3-L1 preadipocytes infected either with an empty GFP control adenovirus (Ad) or with GFP viruses carrying SHP cDNAs. Since our goal is to identify SHP regulated target genes in the early phases of differentiation, the time points corresponding to day 0 and day 2 of differentiation were chosen for microarray experiments. 3T3-L1 cells were infected with equivalent MOI of GFP or SHP adenoviruses one day before confluence. Cells of both groups were harvested two days after virus transduction, and adenovirus-infected (GFP-positive) and adenovirus-uninfected (GFP-negative) cells were sorted by FACS-Vantage to obtain only GFP-infected population, which were then reseeded until confluence (designated day -2). RNA was isolated two days after cell confluence (designated day 0) and two days (designated day 2) after the addition of hormonal stimulators of adipogenesis (MDI: 3-isobutyl-1-methylxanthine, dexamethasone, and insulin). Using the Affymetrix GeneChip®
Figure 1 Affymetrix microarray analysis of SHP-regulated genes during early adipogenesis. A-D: Hierarchical clustering analysis highlighting modulated genes during adipogenesis. 3T3-L1 cells were transduced with GFP (G) control or SHP (S) adenovirus for three days, treated with differentiation cocktail for two days, and gene expression was analyzed using Affymetrix GeneChip® Mouse Genome 430A 2.0 Array platform. Day 0 (G0 and S0),
unstimulated cells; day 2 (G2 and S2), cells differentiated for 2 days. Fold changes of expression levels for genes in each cluster: A, G2/G0>2, S0/S2=1, S2/G2<-2; B, G2/G0<2, S0/S2=1, S2/G2>2; C, G2/G0>2, S0/G0>2, S2/G2<2; D, G2/G0<2, S0/G0<2, S2/G2>2.
To analyze the global cellular genetic responses after SHP transduction, microarray data was subjected to hierarchical clustering analysis. Comparing transdifferentiated adipocytes with preadipocytes by using significance analysis of microarrays revealed a total of ~963 genes (6.9% of the expressed genes) that were significantly altered, and some of those genes fell into four unique clusters of differential gene expression profiling based on the criteria that we selected (Figure 1). In cluster I, we identified ~201 genes demonstrating at least 2-fold increased
by SHP as compared to G2, but an increased expressions were observed at S0 (Figure 1C). In contrast, the cluster IV genes were inhibited at day 2 in control cells (G2) and up-regulated at day 2 by SHP (S2), however, their expressions were down-regulated at day 0 (S0) (Figure 1D). The data suggests that the induction of G2 genes is associated with promoting adipogenesis, whereas the down-regulated G2 genes may function as inhibitors of adipogenesis. SHP appears to keep the balance between these positive and negative regulators of adipogenesis by repressing G2 stimulators and activating G2 inhibitors.
Signaling Pathways Modulated by SHP during 3T3-L1 Early Adipogenic Differentiation
[image:5.612.120.510.279.621.2]Based on the hierarchical clustering results in Figure 1, we focused on two clusters of the regulated transcripts to identify genes transcriptionally repressed or induced by SHP during adipogenesis. Genes that showed an increment or decrement of more than 2-fold expression were selected as up- and down-regulated genes to ensure that the change was substantial. To allow a global view of molecular changes during cellular differentiation, gene ontology analysis [17-18] was used to annotate genes with respect to
biological process, cellular component and molecular function. We screened for ~360 modulated genes that were up-regulated in G2 and repressed in S2 (G2/G0>2, S2/G2<2) and ~603 modulated genes that were down-regulated in G2 and activated in S2 (G2/G0<2, S2/G2>2). Modified genes involved in more than 50 biological processes have been identified, including signal transduction, metabolism and transcription (Supplemental Tables 2-9 and not shown). Up-regulated genes encode for adipocyte-specific transcription factors, enzymes involved in lipid and carbohydrate metabolism, steroid biosynthesis and metabolism (Figure 2A), whereas down-regulated genes encode for proteins of the electron transport and immune response (Figure 2B). The transformation of fibroblastic cells to spherical adipocytes involves drastic change in cell shape. This change may be in response to changes in the expression of cytoskeleton and extracellular matrix (ECM) genes. In fact, the expression of 7 cytoskeleton, 28 cell adhesion, and 40
[image:6.612.153.455.385.652.2]extracellular space genes were altered during adipogenesis with changes in cellular shape (Figure 2). It is interesting to note that within the group of up-regulated genes (Figure 2A), those cell adhesion genes (total 22) were one of the most predominant group. In contrast, when the genes were categorized into those that were down-regulated, a different distribution was observed, with extracellular space genes (total 30) being the most prevalent group of genes (Figure 2B). When the distribution of the biological processes of all genes was assessed, genes with transcription regulation exhibited the highest proportion within both up- and down-regulated genes (Figures 2A and 2B), indicating that transcriptional control plays a major role during adipogenesis. In addition, the number of genes regulating cell cycle and cell growth that were up-regulated at G2 and repressed by SHP (Figure 2A, 21 genes) appeared to be similar to those that were down-regulated during differentiation and activated by SHP overexpression (Figure 2B, 22 genes).
Validation of Microarray Results using Real-time PCR
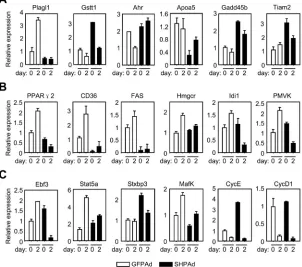
To confirm the microarray data, 20 genes that were found to be differentially modulated by SHP in the microarray experiment were randomly selected for validation using quantitative real-time PCR. The relative quantification method was used for this experiment. As expected, the consistent regulation pattern and change in direction of differential expression between the microarray and real-time PCR results for 18 out of 20 genes, including pleiomorphic adenoma-like protein 1 (Plagl1), glutathione S-transferase theta-1 (Gstt1), Ahr (aryl hydrocarbon receptor), Apoa5 (apolipoprotein A5), growth arrest and DNA-damage-inducible protein GADD45 beta (Gadd45β), and T-cell lymphoma invasion and metastasis 2 (Tiam2), confirmed the accuracy of the microarray results (Figure 3A). It is noted that the Apoa5 mRNA expression was repressed by SHP at both day 0 and day 2 of preadipocytes. Interestingly, the expression of Apoa5 was markedly increased in livers of the SHP knockout mice [19]. The data suggests a similar negative regulatory function of SHP on Apoa5 expression in both the liver and fat.
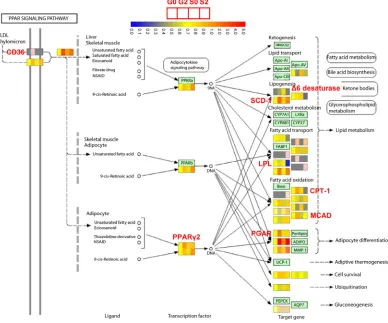
The development of multipotent 3T3-L1 cells into differentiated fat-laden adipocytes is critically dependent on ectopic expression of several transcription factors. This conversion process occurs in two discrete steps, an early mitotic clonal expansion phase, in which growth-arrested preadipocytes reenter the cell cycle and express C/EBP family transcription factors C/EBPβ/δ, and a subsequent mitotic growth arrest phase, in which the expression of a number of other adipocyte-specific genes such as C/EBPα and PPARγ2 is induced, and cells acquire the morphology of fully differentiated adipocytes [20]. We compared gene expression pattern of preadipocytic 3T3-L1 cells at day 0 (G0) to that obtained in early differentiation at day 2 (G2) to assess the response genes in PPAR signaling pathway in the clonal expansion phase. Of the 18 genes significantly upregulated at G2, 10 were down-regulated by SHP overexpression in microarray analysis, including collagen type I receptor (CD36), Δ6-desaturase, stearoyl-CoA desaturase-1 (SCD-1), lipoprotein lipase (LPL), carnitine palmitoyltransferase I (CPT-1), medium chain acyl-CoA dehydrogenase (MCAD), and PPARγ2 (Figure 4). In contrast, the expression of both PPARα and PPARβ was
not detected to be markedly modulated by SHP during differentiation. In general, changes in expression pattern of these genes were consistent with the results of real-time PCR analysis (Figure 3B). The inhibitory effect of SHP on expressions of PPARγ2, SCD-1, and LPL in preadipocytes is observed to be in agreement with the upregulation of these genes in white fat of the SHP knockout mice [14]. Although it has been reported that SHP augments PPARγ transactivation by using artificial luciferase reporter containing three copies of PPAR response element [21], there is no direct evidence for the transcriptional regulation of SHP on PPARγ2 promoter and endogenous PPARγ2 gene expression. The increased PPARγ2 mRNA in SHP-deficient WAT [14] and the decreased PPARγ2 in SHP-overexpressed 3T3-L1 cells suggest SHP as a transcriptional repressor of PPARγ2 expression. Since PPARγ2 and other adipogenic marker genes are key activators of adipocyte differentiation [22-24], repression of these genes by SHP is indicative the function of SHP as an adipogenic suppressor. Importantly, the expression of the SHP gene was found decreased to almost basal level (~3.66 fold) during adipocyte differentiation at day 2 (G2/G0) (Supplemental Table 7B, yellow highlight). The decreased SHP expression correlates well with the progression of the adipogenic program, suggesting that down-regulation of SHP is required for the initiation of adipogenesis process and adipose conversion. It is predicted that certain factors activated during early differentiation may be negative regulators of SHP gene expression, which would be explored in future studies.
In addition to the role in inhibiting PPARγ
Figure 4 Genes regulated by SHP in PPAR signaling pathway. PPAR signaling pathway from KEGG (Kyoto Encyclopedia of Genes and Genomes) was analyzed. Genes with differential expression pattern from day 0 (G0 and S0) to day 2 (G2 and S2) during 3T3-L1 cell differentiation were indicated by colors. Different color represents different expression level for each gene. Red, upregulated; blue, down-regulated. Genes that were markedly down-regulated by SHP at day 2 (S2) as compared to G2 were highlighted by red. These include CD36,
Δ6 desaturase, SCD-1, LPL, CPT-1, MCAD, PGAR, and PPARγ2. G, GFP; S, SHP.
been elucidated using both in vitro and in vivo
approaches [25, 26]. Some of those steroidogenic genes were highly induced at G2, implying that they may have regulatory function during the differentiation of adipocytes (Figure 3B). Consistently, Gsps1 mRNA expression was found to be induced during adipocyte differentiation and in the fat of ob/ob mice [27]. However, limited information is available regarding the functions of steroidogenic enzymes in adipogenesis. It has been reported that salt-inducible kinase-2 (sik2) was expressed in 3T3-L1 cells at a very early stage of adipogenesis and that the sik2 activity in adipose tissues of the db/db mice was significantly higher than that in the wild-type mice [28, 29]. These results suggest that
steroidogenic enzymes may play important roles in modulating the differentiation of adipocytes and that they may function as adipogenic stimulators.
The data further supports our hypothesis that SHP may function as an adipogenic inhibitor. Some discrepant results also exist. For instance, the protein level of the syntaxin binding protein 3 (Stxbp3) was reported to be upregulated during adipogenic differentiation [32], whereas its mRNA level was not increased by Q-PCR analysis (Figure 3C), but instead somewhat decreased in the microarray assay (not shown). There is no report indicating a role for v-maf musculoaponeurotic fibrosarcoma oncogene family protein K (Mafk) in adipogenesis. It is interesting that the expression of Mafk was increased at G2, and that it was negatively regulated by SHP at both G0 and G2 time points (Figure 3C). This suggests that Mafk may be involved in adipocyte differentiation and that SHP may be
[image:9.612.173.448.310.460.2]a potential inhibitor of Mafk gene transcription. Another interesting observation was for two important cell cycle regulators cyclin E (CycE) and cyclin D1 (CycD1). The mRNA expressions for both genes were markedly down-regulated at G2 during the early cell differentiation, consistent with the non-proliferative state of the cells. However, differential expressions at S0 time point for these two genes were detected, with CycE, but not CycD1, being highly activated by SHP. Since both CycE and CycD1 were down-regulated at G2, it remains unclear for their significance in adipogenesis. Overall, the data suggest that SHP may repress the process of adipogenic differentiation by inhibiting multiple target genes in different signaling pathways.
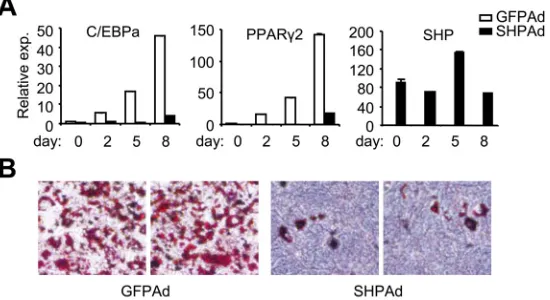
Figure 5 Effect of SHP on adipocyte differentiation in 3T3-L1 cells. A. 3T3-L1 cells were induced to differentiation without or with SHP adenovirus transduction (MOI: 50), as described in the M&M section. Total RNAs were collected at the indicated time (day 0, 2, 5 and 8) and used for Real-time PCR analysis. B. Oil-red O staining of neutral lipids at day 8 post-cell differentiation. Neutral lipid accumulation was largely detected in GFP-infected cells, but dramatically diminished in SHP-overexpressed cells. Ad, adenovirus.
SHP as a Transcriptional Inhibitor of Adipogenesis
To further analyze the obtained gene expression patterns, we investigated the effect of SHP on the expression of five adipocyte-selective genes during the differentiation, including C/EBPβ, C/EBPα, SREBP-1, AP2 and PPARγ2. At 8 days post-differentiation, all of the genes in GFP virus infected cells were found to be up-regulated as determined by Northern blot (data not shown), consistent with their established roles. In this experiment, all the five genes had an overall decrease in gene
In summary, our current study examined the gene expression profiles during 3T3-L1 adipocyte differentiation and the effect of SHP inhibition during the differentiation process. In recent years there have been a number of microarray studies describing gene expression in the 3T3-L1 cell system [33, 34] and in human adipocytes [35]. However, the regulatory role of SHP in adipogenesis has not been investigated. In this study, several lines of evidence support the hypothesis that SHP signaling maintains preadipocytes in an undifferentiated state through inhibition of the adipogenic transcription factors including C/EBPα and PPARγ2, and other adipogenic stimulators, such as Ebf3 and Stat5a, implicating an important role of SHP in the development of adipose tissue. It seems likely that SHP may directly inhibit genes that promote both the early and late stages of adipogenic program. Since multiple genes included transcription regulators and genes involved in signal transduction were found to be repressed upon adipocyte differentiation by SHP, it would be of critical importance to identify and characterize each individual primary SHP target that governs the differentiation process in future studies. It is noted that a subset of genes were also upregulated in SHP-overexpressed cells during the early phase of cell differentiation. Because SHP is generally considered as a transcriptional repressor, it is predicated that the upregulated genes may not be due to direct SHP activation, but instead a result of secondary effect. The important role of SHP in adipogenesis would be further evaluated by generating adipose tissue specific SHP overexpressed transgenic mouse models. If SHP is found to inhibit adipose tissue development in vivo, it would allow us to develop SHP as a potential drug target for treatment of obesity.
Acknowledgements
We thank Phillipus Van Eeden for writing the software to assist with the microarray data analysis. This work was supported by grants from American Diabetes Association (7-06-JF-67), NIH DK DK080440 to L.W. Gene expression array data sets were generated from KUMC-Microarray Facility, which is supported by HD02528 and RR016475.
Please address all correspondences to Li Wang, PH.D., Department of Medicine and Oncological
Sciences, Huntsman Cancer Institute, University of Utah School of Medicine, Salt Lake City, UT, USA. Tel: 801-587-4616; Fax: 801-587-9415; Email: [email protected]
References
[1] Shoelson SE, Herrero L and Naaz A. Obesity, inflammation, and insulin resistance.
Gastroenterology 2007;132:2169-2180. [2] Badman MK and Flier JS The adipocyte as an
active participant in energy balance and metabolism. Gastroenterology 2007;132: 2103-2115.
[3] Feve B. Adipogenesis: cellular and molecular aspects. Best Pract Res Clin Endocrinol Metab
2005;19:483-499.
[4] Holst D and Grimaldi PA. New factors in the regulation of adipose differentiation and metabolism. Curr Opin Lipidol 2002;13: 241-245.
[5] Tontonoz P, Hu E and Spiegelman BM. Stimulation of adipogenesis in fibroblasts by PPAR gamma 2, a lipid-activated transcription factor. Cell 1994;79:1147-1156.
[6] Wu Z, Bucher NL and Farmer SR. Induction of peroxisome proliferator-activated receptor gamma during the conversion of 3T3 fibroblasts into adipocytes is mediated by C/EBPbeta, C/EBPdelta, and glucocorticoids.
Mol Cell Biol 1996;16:4128-4136.
[7] Kim JB and Spiegelman BM. ADD1/SREBP1 promotes adipocyte differentiation and gene expression linked to fatty acid metabolism.
Genes Dev 1996;10:1096-1107.
[8] Rosen ED, Walkey CJ, Puigserver P and Spiegelman BM. Transcriptional regulation of adipogenesis. Genes Dev 2000;14:1293- 1307.
[9] Harp JB. New insights into inhibitors of adipogenesis. Curr Opin Lipidol 2004;15:303-307.
[10] Jimenez MA, Akerblad P, Sigvardsson M and Rosen ED. Critical role for Ebf1 and Ebf2 in the adipogenic transcriptional cascade. Mol Cell Biol 2007;27:743-757.
[11] Tong Q, Dalgin G, Xu H, Ting CN, Leiden JM and Hotamisligil GS. Function of GATA transcription factors in preadipocyte-adipocyte transition.
Science 2000;290:134-138.
[12] Bavner A, Sanyal S, Gustafsson JA and Treuter E. Transcriptional corepression by SHP: molecular mechanisms and physiological consequences. Trends Endocrinol Metab 2005; 16:478-488.
[13] Wang L, Liu J, Saha P, Huang JS, Chan L, Spiegelman B and Moore DD. The orphan nuclear receptor SHP regulates PGC-1α
expression and energy production in brown adipocytes. Cell Metab 2005;2:227-238. [14] Wang L, Huang J, Saha P, Kulkarni RN, Hu M,
partner is an important mediator of glucose homeostasis. Mol Endocrinol 2006;20:2671- 2681.
[15] Ashburner M, Ball CA, Blake JA, Botstein D, Butler H, Cherry JM, Davis AP, Dolinski K, Dwight SS, Eppig JT, Ringwald M, Rubin GM and Sherlock G. Gene ontology: tool for the unification of biology. The Gene Ontology Consortium. Nat Genet 2000;25:25-29.
[16] Livak KJ and Schmittgen TD. Analysis of relative gene expression data using real-time quantitative PCR and the 2-∆∆CT method.
Methods 2001;25:402-408.
[17] Hosack DA, Dennis G Jr, Sherman BT, Lane HC and Lempicki RA. Identifying biological themes within lists of genes with EASE. Genome Biol
2003;4:R70.
[18] Masseroli M, Martucci D and Pinciroli F. GFINDer: Genome function integrated discoverer through dynamic annotation, statistical analysis, and mining. Nucleic Acids Res 2004;32:W293-W300.
[19] Huang J, Iqbal J, Saha PK, Liu J, Chan L, Hussain MM, Moore DD and Wang L. Molecular characterization of the role of orphan receptor small heterodimer partner in development of fatty liver. Hepatology 2007;46:147-157. [20] Rangwala SM and Lazar MA. Transcriptional
control of adipogenesis. Annu Rev Nutr 2000; 20:535-559.
[21] Nishizawa H, Yamagata K, Shimomura I, Takahashi M, Kuriyama H, Kishida K, Hotta K, Nagaretani H, Maeda N, Matsuda M, Kihara S, Nakamura T, Nishigori H, Tomura H, Moore DD, Takeda J, Funahashi T and Matsuzawa Y. Small heterodimer partner, an orphan nuclear receptor, augments peroxisome proliferator- activated receptor gamma transactivation. J Biol Chem 2002;277:1586-1592.
[22] Weiner FR, Smith PJ, Wertheimer S and Rubin CS. Regulation of gene expression by insulin and tumor necrosis factor alpha in 3T3-L1 cells. Modulation of the transcription of genes encoding acyl-CoA synthetase and stearoyl-CoA desaturase-1. J Biol Chem 1991;266:23525- 23528.
[23] Enerback S, Ohlsson BG, Samuelsson L and Bjursell G. Characterization of the human lipoprotein lipase (LPL) promoter: evidence of two cis-regulatory regions, LP-alpha and LP-beta, of importance for the differentiation-linked induction of the LPL gene during adipogenesis. Mol Cell Biol 1992;12: 4622-4633.
[24] Masella R, Vari R, D'Archivio M, Santangelo C, Scazzocchio B, Maggiorella MT, Sernicola L, Titti F, Sanchez M, Di Mario U, Leto G and Giovannini C. Oxidised LDL modulate adipogenesis in 3T3-L1 preadipocytes by affecting the balance between cell proliferation and differentiation. FEBS Lett 2006;580:2421- 2429.
[25] Datta S, Wang L, Moore DD and Osborne TF. Regulation of 3-hydroxy-3-methylglutaryl coenzyme A reductase promoter by nuclear receptors liver receptor homologue-1 and small heterodimer partner: a mechanism for differential regulation of cholesterol synthesis and uptake. J Biol Chem 2006;281:807-812. [26] Matsukuma KE, Wang L, Bennett MK and
Osborne TF. A key role for orphan nuclear receptor LRH-1 in activation of fatty acid synthase promoter by LXR. J Biol Chem 2007; 282:20164-20171.
[27] Vicent D, Maratos-Flier E and Kahn CR. The branch point enzyme of the mevalonate pathway for protein prenylation is overexpressed in the ob/ob mouse and induced by adipogenesis. Mol Cell Biol 2000; 20:2158-2166.
[28] Okamoto M, Takemori H and Katoh Y. Salt-inducible kinase in steroidogenesis and adipogenesis. Trends Endocrinol Metab 2004; 15:21-26.
[29] Katoh Y, Takemori H, Horike N, Doi J, Muraoka M, Min L and Okamoto M. Salt-inducible kinase (SIK) isoforms: their involvement in steroidogenesis and adipogenesis. Mol Cell Endocrinol 2004;217:109-112.
[30] Nanbu-Wakao R, Morikawa Y, Matsumura I, Masuho Y, Muramatsu MA, Senba E and Wakao H. Stimulation of 3T3-L1 adipogenesis by signal transducer and activator of transcription 5. Mol Endocrinol 2002;16:1565- 1576.
[31] Kawai M, Namba N, Mushiake S, Etani Y, Nishimura R, Makishima M and Ozono K. Growth hormone stimulates adipogenesis of 3T3-L1 cells through activation of the Stat5A/5B-PPARgamma pathway. J Mol Endocrinol 2007;38:19-34.
[32] Lee HK, Lee BH, Park SA and Kim CW. The proteomic analysis of an adipocyte differentiated from human mesenchymal stem cells using two-dimensional gel electrophoresis.
Proteomics 2006;6:1223-1229.
[33] Soukas A, Socci ND, Saatkamp BD, Novelli S and Friedman JM. Distinct transcriptional profiles of adipogenesis in vivo and in vitro. J Biol Chem 2001;276:34167-34174.
[34] Gerhold DL, Liu F, Jiang G, Li Z, Xu J, Lu M, Sachs JR, Bagchi A, Fridman A, Holder DJ, Doebber TW, Berger J, Elbrecht A, Moller DE and Zhang BB. Gene expression profile of adipocyte differentiation and its regulation by peroxisome proliferator-activated receptor- gamma agonists. Endocrinology 2002;143: 2106-2118.