Effect of Periodic Variation of Sol-air Temperature on the
Performance of Integrated Solar Collector Storage System
Nawaf H. Saeid, Tan Jun Wong
Department of Mechanical, Manufacturing and Materials Engineering, The University
of Nottingham Malaysia Campus, Semenyih, Selangor, Malaysia
E-mail: [email protected]
Received June 8, 2010; revised September 6, 2010; accepted September 29, 2010
Abstract
Parametric study is carried out in the present article to investigate the unsteady performance of solar energy gain and heat retention of two different integrated-collector-storage systems. The systems are the conven-tional rectangular-shaped storage tank and the modified tank shaped as rectangular cuboid with one semi -circular top. The two systems have the same absorber surface area and volume for water. The heat and fluid flow is assumed to be unsteady, two-dimensional, laminar and incompressible. The performances of the two systems are evaluated based on the maximum temperature in the system during daytime heating period and nighttime cooling period. For comprehensive study, 24 hours simulations for 3 cases with different wall boundary condition impose on the absorber plate are investigated. The simulation results show that the modified system has better heat retain than the conventional system. Periodic variations of both systems are investigated, and it is found that both systems show consistent results on different days. The modified system is able to store most of the thermal energy in the semi-circular top region with higher temperature than that of the conventional system.
Keywords: Heat Transfer, Integrated Solar Collector Storage, Buoyancy Driven Flow, Numerical Study
1. Introduction
Over the last two decades, interest has been growing for more effective utilize of renewable sources of energy. Many researchers have strongly promoted the use of so-lar energy as a viable source of energy. This is due to solar energy a sustainable and environmentally friendly source of energy. Water heating accounts for approxi-mately 25% of the total energy used in a typical sin-gle-family home. An electric water heater is the single biggest energy user of all appliances in the home. Home solar heating can lead to savings of 85% on utility bills over the costs of electric water heating [1].
A simple solar water heater is usually consisting of a water tank, a dark absorber to capture the sun’s radiation effectively, and a sheet of glass to create a greenhouse effect. Water enters at the bottom and is heated by the absorber. As it warms, hot water travels to the top of the tank due to its lower density. When the water is ready for use, cool water is supplied to the inlet and hot water flows out the top. The main disadvantage of the solar collector systems is the high thermal loss to the surroundings. In particular, the heat losses are greatest during the night and overcast days with low ambient temperature.
Kalogirou [2] presented a survey of the various types of solar thermal collectors and their applications. In this survey study, various types of collectors including flat -plate, compound parabolic, evacuated tube, parabolic trough, Fresnel lens, parabolic dish and heliostat field collectors were described. The storage of solar energy is necessary for an effective usage of this energy due to the fact that the solar energy has an unsteady characteristic during the day. The storage tank can be separated or in-tegrated with the solar collector. The solar inin-tegrated- collector-storage (ICS) water heating system is combin-ing the solar absorber panel and the storage tank in a single unit. This makes the system more cost effective and has less maintenance problems.
There are many different designs in the literature for ICS. Garnier et al. [3] considered a rectangular-shaped
833 system, i.e. with the receiver of the collector being also
the storage vessel, it is not possible to insulate it properly and there are significant heat losses during the night. Sridhar and Reddy [5] investigated a modified cuboid solar integrated-collector-storage (ICS) water heating system with transparent insulation material. The system consists of a tank shaped as rectangular cuboid with one semi-circular top. After numerical investigation to evolve optimum configuration, the system is designed, devel-oped and tested for Indian weather conditions. Sridhar and Reddy [5] found that the modified ICS system is structurally supportive in storing of hot fluid in the stor-age region, after heating by the energy collected at the absorber plate. The design of any ICS system should consider the natural convection process in enclosures in general due to its effect on thermal performance of the ICS systems. Examples of such studies can be found in references [6-10].
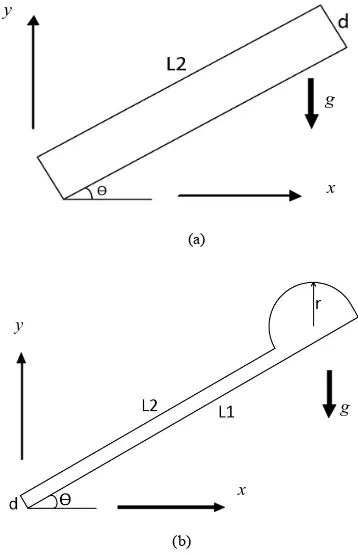
The main objective of the present study is to investi-gate numerically the unsteady performance of solar en-ergy gain and heat retention of two different integrated -collector-storage systems. The two ICS systems are shown in Figure 1, which are the conventional rectangular -shaped storage tank (Figure 1(a)) and the modified tank shaped as rectangular cuboid with one semi-circular top (Figure 1(b)).
y g x (a) y g x (b)
Figure 1. The physical model (a) Conventional rectangular- shaped storage tank; (b) Modified rectangular cuboid with one semi-circular top.
[image:2.595.308.537.329.559.2]In order to compare the performance of the two ICS systems, the absorber plate area L2 and the total volume of both are considered the same. The values of the ge-ometry parameters of the two ICS systems are given in Table 1.
2. Mathematical Model
Schematic diagrams of integrated-collector-storage sys-tems are shown in Figure 1. The absorber surface L2 for both ICS systems is exposed to the solar heat flux. The mathematical formulation of the present problem is based on the following assumptions:
1)The flow is unsteady, two-dimensional, laminar and incompressible;
2)The water properties are constant except for the den-sity change with temperature, which gives rise to the buoyancy force; and
3)The viscous heating is neglected in the energy con-servation.
Based on the above assumptions, the governing equa-tions for the unsteady heat and fluid flow are as follows:
Mass conservation equation:
0 y v x u (1)
Momentum conservation equations:
cos 1 2 2 2 2 o T T g y u x u x p y u v x u u tu
(2)
sin 1 2 2 2 2 o T T g y v x v y p y v v x v u tv
(3) Energy conservation equation:
2 2 2 2 y T x T y T v x T u t
T (4)
where u and v are velocity components in x and y
-directions respectively, T is temperature, p is pressure, t
is time, g is the acceleration due to gravity, , and
[image:2.595.81.260.399.677.2] are density, kinematic viscosity and thermal diffusiv-ity of the fluid respectively. The subscript o for reference
Table 1. Geometry parameters of ICS systems.
geometry parameters Conventional ICS Modified ICS
d (cm) 14.415 5
r (cm) - 20.26
L1 (cm) - 130.52
L2 (cm) 90 90
[image:2.595.309.537.656.721.2]point and the Boussinesq approximation for the den-sity-temperature relationship is defined as:
o
o TT
1 (5) where is the volumetric expansion coefficient, which appears in the body force term in Equations (2) and (3). All the surfaces of the two ICS systems are thermal insu-lated (zero heat flux boundary condition) except the ab-sorber surface (L2) shown in Figure 1. The absorber sur-face (L2) is subjected to different conditions during heat-ing and coolheat-ing periods as discussed in the next section.
2.1. Initial and Boundary Conditions
The initial and boundary conditions for the two ICS sys-tems are:
At time = 0, the temperature of the stagnant water is 298 K everywhere.
For time > 0, three different boundary conditions on the absorber surface (L2) are used in the present study. They are:
Case 1: Constant heat flux of value 950 W/m for 2 hours of heating period followed by cooling period for 2 hours, where, a constant surface temperature is assumed on the absorber surface. The absorber surface tempera-ture during the cooling period is assumed to be in the range 278 K to 298 K to reflect different weather condi-tions.
Case 2: Daily variation Sol-air temperature (Tsol-air) is used as a boundary condition on the surface of the ab-sorber. The Tsol-air is taken into account the outdoor am-bient temperature and the solar heat flux. It is defined as:
o o air sol
h Q I T
T (6)
where To = outdoor surroundings’ temperature [˚C], α =
solar radiation absortivity of a surface, I = global solar
irradiance [W/m2], Δ
Q = extra infrared radiation due to
difference between the external air temperature and the apparent sky temperature and ho = heat transfer
coeffi-cient for radiation and convection [W/m2K].
Case 3: Periodic variation of sol-air temperature for duration of 4 continues days.
3. Numerical Solution Procedure
The solution domain for both ICS, shown in Figure 1, were created and meshed by divided it into non-uniform spacing quadrilateral cells. The mesh size refining or grid independence test study was carried out. The accuracy of the results is always a compromise between the number of cells and the computational cost. Therefore, after many simulation tests using different number of cells, it is found that 28,221 cells for the conventional ICS and
34,963 cells for the modified ICS are sufficient for the grid-ineffective mesh. The cells were clusters near the walls where steep variations in velocity and temperature are expected. FLUENT6.3 [11] is used as a tool for nu-merical solution of the governing Equations (1) to (4) based on finite-volume method. The segregated solver is used in the present study which solves conservation gov-erning equations independently, and is applicable for the present incompressible flow problem. First Order Up-wind discretization scheme [12,13] is selected for con-vection-diffusion formulation for momentum and energy equations. The central differencing scheme is used for the diffusion terms. The discretized equations were solved based on pressure correction method and uses PISO (pressure-implicit with splitting of operators) algo-rithm [14]. Relaxation factors are used to avoid diver-gence in the iteration. The typical relaxation factors were used as 0.7 for momentum equations, 0.3 for the pressure and 1.0 for the energy equation. For time integral the first order implicit scheme is used, which is uncondi-tional stable. The time step is selected to be 600 seconds for both the heating and the cooling periods. The effect of the time step value on the accuracy of the results is tested. It is found that smaller time steps produce almost identical results. Therefore the time step and the mesh size defined above are fixed throughout the present study. The convergence criterion is based on the residual in the governing equations. The maximum residual in the en-ergy equation was 10-7 and the residual of other vari-ables were lower than 10-5 in the converged solution. In all the computational cases the global heat and mass balance are satisfied in the converged solution within ± 10-3%. Water is used as working fluid with constant physical properties. The values of the properties are: den-sity = 997 kg/m3, specific heat cp = 4182 J/kgK, thermal conductivity k = 0.6 W/mK and viscosity = 0.00089 kg/ms.
4. Results and Discussion
The governing equations are solved under same initial conditions and different boundary conditions for the two ICS systems shown in Figure 1. The results under dif-ferent boundary conditions are presented and discussed separately as follows.
4.1. Case 1: Constant Heat Flux and Constant Night Time Temperature
835 inside the ICS systems during the heating period are
shown in Figure 2. The results of Sridhar and Reddy [5] are presented also in Figure 2 for comparison. It can be observed form Figure 2 that the discrepancy between the present results and those of Sridhar and Reddy [5] for the same modified ICS is negligible.
The results for the heating phase presented in Figure 2 indicate better performance of the conventional ICS sys-tem against the modified ICS syssys-tem. This is because the heated water in the conventional ICS system is confined in the rectangular shape and the maximum temperature occurs near the absorber surface. While in the modified ICS system the heated water is moving upwards to the semi-circular top region due to buoyancy forces and keeps the region near the absorber surface with lower temperature than that in the conventional ICS.
The contour plot of streamlines after one hour of heat-ing of both the conventional and the modified ICS sys-tems are presented in Figure 3. The streamline is a con-stant stream function line or it is the tangent line to the velocity vector of the flowing fluid. The stream function is defined as usual as:
y u
;
x v
(7)
where is the stream function in kg/s. It can be seen in Figure 3(a) that the water is circulating and mixing in the whole system in the convectional ICS system. Figure 3(b) shows that the circulation of the water is mostly in the semi-circular top side of the modified ICS system. Com-paring the range of the steam function of the streamlines presented in Figure 3 indicate that the circulation in the modified ICS system is stronger than that of the conven-tional ICS system. The maximum value of the steam function in the conventional ICS is about 8.44 × 10⁻² kg/s while that of the modified ICS is about 3.86 × 10⁻¹ kg/s.
It is worth mentioning that the results presented in Figure 3(b) for the flow pattern of the present study and
Figure 2. Temporal variation of maximum temperature of water inside the ICS systems during heating period with constant heat flux of 950 W/m2.
(a)
(b)
Figure 3. Streamlines in the systems after 1 hour of heating period with constant heat flux of 950 W/m2. (a) convectional ICS; (b) modified ICS.
those of Sridhar and Reddy [5], (not shown here for briefty) are almost the same. This reflects the accuracy of the results in the present solution method.
275 280 285 290 295 300 305 310 315 320 325
7200 7800 8400 9000 9600 10200 10800 11400 12000 12600 13200 13800 14400
Tma
x
(K
)
Time (sec)
Conventional ICS Modified ICS
[image:5.595.103.495.76.323.2]T
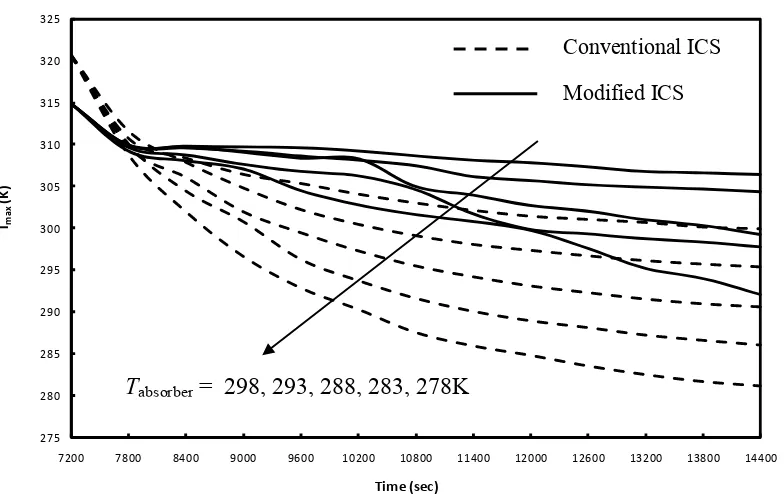
absorber = 298, 293, 288, 283, 278KFigure 4. Temporal variation of maximum temperature of water inside the ICS systems during cooling period.
circulated in the whole system during the cooling period and continue losing heat to the outside environment.
The streamlines after two hours of cooling with con-stant absorber temperature of 288 K of both the conven-tional and the modified ICS systems are presented in Fig-ure 5. Figure 5(a) shows that there are multi-cells circu-lations of water in the conventional system near the sur-face of the absorber. The circulation of water near the absorber surface indicating high heat lost during cooling period and therefore low maximum temperature in the system.
In the cooling period and after two hours of cooling with constant absorber temperature of 288 K of the modi-fied ICS system the circulation of the water is again in the semi-circular top side and it is irregular. Note that the systems are thermally insulated except the absorber sur-face. Therefore the modified ICS keeping the water at the insulated semi-circular top region at high temperature and low density. Figure 5(b) shows that the water near the surface of the absorber is approximately stationary. It can be expected that the streamlines in the systems after the cooling period with other temperatures will be similar to those presented in Figure 5.
Comparing the results presented in Figure 2 and Fig-ure 4 of the performance of the two systems after the successive two periods indicating better overall thermal performance of the modified ICS system. It is observed also that the difference in the maximum temperature in the systems after successive two periods is increased with the absorber temperature reduction. The maximum water
7.82e-02 7.43e-02 7.04e-02 6.65e-02 6.26e-02 5.87e-02 5.48e-02 5.09e-02 4.69e-02 4.30e-02 3.91e-02 3.52e-02 3.13e-02 2.74e-02 2.35e-02 1.96e-02 1.56e-02 1.17e-02 7.82e-03 3.91e-03 0.00e+00
(a)
1.56e-01 1.48e-01 1.40e-01 1.32e-01 1.25e-01 1.17e-01 1.09e-01 1.01e-01 9.35e-02 8.57e-02 7.79e-02 7.01e-02 6.23e-02 5.45e-02 4.67e-02 3.90e-02 3.12e-02 2.34e-02 1.56e-02 7.79e-03 0.00e+00
[image:5.595.314.528.355.686.2](b)
837
(a)
(b)
(c)
[image:6.595.132.477.59.695.2]temperature in the modified ICS system after the two periods is about 7 K to 11 K higher than that of the con-ventional ICS system.
4.2. Case 2: Daily Variation of Sol-air Temperature
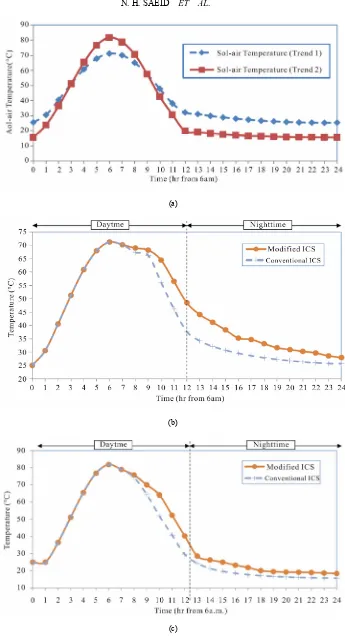
In this case, the 24 hours variation of the sol-air tem-perature defined in Equation (6) is used as boundary con-dition on absorber surface. It is well-known that the daily variation of the sol-air temperature depends on the sea-son and many metrological parameters. Therefore, two different models are used for the daily variation of the sol-air temperature to evaluate the performance of the ISC systems.
The daily variations of the sol-air temperature for the two models are shown in Figure 6(a). The condi-tion for trend 2 is assumed to be harsher (higher am-plitude) than trend 1. For trend 1, the minimum Tsol-air
shows the value of 25.3˚C, while that of trend 2 is 15.5˚C. As for the maximum Tsol-air, trend 1 has the
value of 71.2˚C, while trend 2 shows the value of 81.8˚C. It has the lower minimum Tsol-air and higher
maximum Tsol-air as compared to trend 1. Thus, during
daytime, this boundary condition may represent the hot weather. While during nighttime, it represents the cool weather.
The results are presented in Figure 6(b) show the ef-fect of using trend 1 as boundary condition on the maximum temperature variation inside the two ICS sys-tems. For the first 6 hours, the maximum temperatures of both systems are the same as the sol-air temperatures. This is due to the maximum temperature occurs near the absorber plate, which is the sol-air temperature during heating.
After 6 hours, the sol-air temperature is decreasing. This is when the cooling phase occurs. During the cool-ing phase, the maximum temperature will have a con-tinuous reduction due to the cooling effect (heat loss). It can be observed from Figure 6(b) that the modified ICS has better heat retain since the maximum temperature has less reduction than that of the conventional ICS. The results show that there is a difference in the maximum temperature of 2˚C-10˚C between modified ICS and conventional ICS.
For the conventional ICS, the maximum temperature in the end of the simulations (say from 18-24 hours), is close to the sol-air temperature. This suggests that the inside of the conventional ICS is only left with cooled water, which is the same temperature as the outdoor tem-perature.
These results are justified by using a different trend of sol-air temperature as boundary condition. Different from trend 1 (which is the sol-air temperature previously used as boundary condition), the new trend has a
varia-tion of 15% of trend 1. The two trends are shown in Fig-ure 6(a) for comparison. By using trend 2 sol-air tem-perature as boundary condition, the simulation procedure is repeated and the results of maximum temperature are obtained.
By using this condition (trend 2), the maximum tem-perature comparison in Figure 6(c) show that there would be 2˚C-14˚C difference in maximum temperature higher in modified ICS than that of the conventional ICS. Modi-fied ICS shows a good heat retaining ability during night-time. The results presented in Figures 6(b) and (c) show that the modified ICS system has much better perform-ance than the conventional system when the sol-air tem-perature variation has higher amplitude.
4.3. Case 3: Periodic Variation of Sol-air Temperature
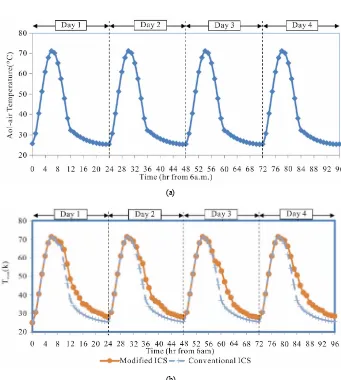
Although the results for 1 day show the great perform-ance of the modified ICS system, the performperform-ance may be affected on the next day. Moreover it is important to eliminate the effect of the assumed initial condition. Therefore it is important to carry out the simulation of the performance of the ICS systems for more periods of sol-air temperature variation. To verify this, the periodic variation of the sol-air temperature boundary condition (trend 1 in Figure 6(a)) is assumed to be periodic and repeated for 4 successive days. This periodic variation of the sol-air temperature for 4 successive days is shown in Figure 7(a) and used as a boundary condition for the two ICS systems. The maximum temperature inside the ICS systems is used also to represent the performance of the systems. The results of the maximum temperature inside the ICS systems for the two systems are shown in Figure 7(b) during the 4 successive days.The results presented in Figure 7(b) show that the variation of the maximum temperature in the systems for the following days are almost the same as the first day. Thus, for the two sys-tems, periodic variation does not have much effect on the maximum temperature. In general, the modified ICS system still shows a great result on the heat retaining.
5. Conclusions
839
(a)
(b)
Figure 7. (a) Periodic variation of the Sol-air Temperature on the absorber surface; (b)the response of Tmax of the two ICS sys-tems based on the boundary conditions in 7(a).
ferent boundary conditions on the absorber plate. The re-sults show that the shape of the integrated-collector-storage systems has a great importance on the natural convection heat and fluid flow inside the system. The numerical results recording during the daytime heating period and during nighttime cooling period shows that the overall performance (after the successive heating and cooling periods) of the modified system is better. The modified system is able to store the water with higher temperature in the semi-circular top region than that of the conventional system. This hits our main objectives on reducing nighttime thermal losses. Future work should be made on the effect of the unsteady hot water consumption, which is exit from the upper part of the system and the cold water inlet from the lower part of the system on the overall thermal performance.
6. References
[1] Solarthermal.com (http://solarthermal.com).
[2] S. A. Kalogirou, “Solar Thermal Collectors and Applica-tions,” Progress in Energy and Combustion Science,Vol.
30, No. 3, 2004, pp. 231-295.
[3] C. Garnier, J. Currie and T. Muneer, “Integrated Collector Storage Solar Water Heater: Temperature Stratification,”
Applied Energy,Vol. 86, No. 9, 2009, pp. 1465-1469.
[4] S. A. Kalogirou, “Design, Construction, Performance Evalua-tion and Economic Analysis of an Integrated Collector Storage System,” Renew Energy,Vol. 12, No. 2, 1997, pp. 179-192.
[5] A. Sridhar and K. S. Reddy, “Transient Analysis of Modified Cuboid Solar Integrated Collector-Storage System,” Applied Thermal Engineering, Vol. 27, No.
2-3, 2007, pp. 330-346.
[6] S. Ostrach, “Natural Convection in Enclosures,” ASME Journal of Heat Transfer, Vol. 110, No. 4b, 1988, pp.
1175-1190.
[image:8.595.127.468.67.447.2]Cold Regions,” ASME Journal of Heat Transfer,Vol. 107,
No. 4, 1985, pp. 867-876.
[8] N. H. Saeid, “Computational Aspects for Natural Convec-tion in a Cavity Using Vorticity-Stream FuncConvec-tion Method,” In: G. R. Liu et al., Ed., Computational Methods, Springer, 2006, pp. 255-261.
[9] N. H. Saeid and Y. Yaacob, “Natural Convection in a Square Cavity with Spatial Sidewall Temperature Varia-tion,” Numerical Heat Transfer, Part A, Vol. 49, No. 7,
2006, pp. 683-697.
[10] N. H. Saeid, “Conjugate Natural Convection in a Porous Enclosure: Effect of Conduction in One of the Vertical
Walls,” International Journal of Thermal Sciences,Vol. 46,
No. 6, 2007, pp. 531-539.
[11] Fluent 6.3 User’s Guide, Fluent Inc. http://www.fluen-tusers.com
[12] H. K. Versteeg and W. Malalasekera, “An introduction to Computational Fluid Dynamics,” Longman, New York, 1995. [13] S. V. Patankar, “Numerical Heat Transfer and Fluid Flow,”
McGraw-Hill, New York, 1980.