Preferential Votes and Minority
Representation
Preferential Votes and Minority
Representation
∗
Margherita Negri
†May 13, 2017
Abstract
Under open list proportional representation, voters vote both for a party and for some candidates within its list (preferential vote). Seats are assigned to parties in proportion to their votes and, within parties, to the candidates obtaining the largest number of preferential votes. The paper examines how the number of candidates voters can vote for affects the representation of minorities in parliaments. I highlight a clear negative relationship between the two. Minorities are propor-tionally represented in parliament only if voters can cast a limited number of preferential votes. When the number of preferential votes increases, a multiplier effect arises, which disproportionately increases the power of the majority in determining the elected candidates.
JEL: D02, D72;
Keywords: proportional representation, open list, preferential vote, minority representation.
∗I am extremely grateful to Fran¸cois Maniquet, Massimo Morelli, Benoit Crutzen,
Salvatore Nunnari and Pietro Ortoleva for their precious help on this project. I would also like to thank the participants to the SAET Conference 2013, the Political Economy Breakfast at Columbia University, the Graduate Political Economy seminar at Princeton University and the LSE Workshop on Positive Theory and Comparative Politics. I am grateful to FNRS for their financial support. Finally, I thank the editor Maggie Penn and two anonymous referees for their useful comments.
1
Introduction
The label proportional representation (PR) refers to any multi-member
dis-trict system where seats are assigned to parties in proportion to the share of
votes they receive. An important distinction within this class of electoral
sys-tems relates to the rules governing seat allocation within parties. Suppose a party running with a list of ten candidates wins four seats in a district: which
of the candidates on its list will be elected? In some countries (among many
others, Argentina, Israel, Spain and South Africa), seat allocation follows a
ranking of candidates that is determined by party leaders before election. In
the example, the first four candidates on the party list would be assigned
the seat under this system. Voters cannot modify the ranking and can only
cast a vote for a party list as a whole. In other countries (e.g. Belgium, The
Netherlands or Sweden), voters can affect the ranking decided by parties by
casting a specific vote (a preferential orpreference vote) for some candidates within the list. Candidates obtaining enough preferential votes are elected
independently of their position on the original ranking. In the example, if,
say, the 10th candidate on the list received enough preferential votes, she
would be elected in place of one of the first four candidates. Finally, there
are countries (e.g. Finland and Norway) where rankings are solely
deter-mined by preferential votes. Under this system, the four seats won by the
party in the example would be assigned to the four candidates obtaining the
highest number of individual votes. The three systems are known as closed,
flexible (or semi-open) and open list PR, respectively.
Preferential votes under open list PR (and, to some extent, under flexible
list PR) are equivalent to approval voting within party lists: voters decide to
approve (and not rank) some of the politicians appearing on the ballot. Only
one approval vote can be cast for each candidate (no cumulative voting).
The total number of approval votes that can be expressed can vary a lot
from country to country. For example, it is equal to one in Sweden, Finland,
district - in Greece and it coincides with the total number of candidates on
the list in Belgium.
This paper investigates the extent to which the interests of minority
groups can be protected under open list PR systems. As a measure of
representation of minorities, I consider the number of elected candidates
representing the group. If minorities were able to organize themselves into
parties, the question would boil down to the analysis of seat allocation across parties. The extent of minority representation would then only depend on
the mapping of votes into seats and on the presence (and level) of minimum
thresholds for representation. This is the focus of the literature on
thresh-old for representation and threshold for exclusion (among others, Rae et al.
(1971), Lijphart and Gibberd (1977), Taagepera (1998)).1 However, party
structures in countries using PR systems might not necessarily represent the
minority/majority divide. For example, Huber (2012) shows that the
“eth-nicization” of voting behavior (i.e. the correlation between voting decisions
and individuals’ ethnicity) is actually lower under PR than it is under first-past-the-post systems. In other words, ethnic groups often split their votes
across different parties and there might not be parties primarily receiving
votes from one specific ethnic group. This happens because, “although PR
makes it possible for ethnically oriented parties to form, it also makes it easy
for nonethnic parties to compete for ethnic votes”.2 In such a scenario, then,
minority candidates might appear on party lists that represent different
in-terests. The rules governing seat allocation within party lists become of key
importance to determine the level of minority representation in this context.
The paper considers a society divided in two groups of unequal size, that I call minority and majority. Voters vote under open list PR: they must
cast a vote for one out of two parties and assign some preferential votes to
1The two thresholds represent the minimum amount of votes a party should obtain to
win a seat and the maximum amount of votes that would not guarantee the seat to the party, respectively.
candidates within its list. Voters can only approve candidates belonging to
the list of the party they voted for and can cast at most one preferential
vote per candidate. The seats won by the party are assigned to the
can-didates in the list who received the largest number of preferential votes. I
assume list composition is dictated by the law: lists must contain a share of
candidates representing each group equal to the relative size of the group in
the population. Furthermore, I make a number of conservative assumptions on voters’ characteristics. First, I assume that members of each group are
perfectly able to coordinate. This allows to consider a game between two
players, the minority and the majority.3 A similar degree of coordination is
assumed in ethical voters models (Coate and Conlin (2004), Feddersen and
Sandroni (2006)). Groups preferences are defined on the minority/majority
dimension: each group aims at maximizing the number of elected candidates
representing its interests. Voters are perfectly able to distinguish minority
and majority candidates. Finally, all candidates representing the same group
are identical and cannot campaign to attract votes from different groups.4 All these assumptions are intrinsically connected. Introducing other cleavages in
society, limiting the ability of voters to identify candidates’ types or
allow-ing candidates to campaign (on issues different from the minority/majority
3The pure strategy Nash equilibria of this two-player game are equivalent to Strong
Nash equilibria (Aumann (1959)) of a game where each voter acts as a different player, when these equilibria exist.
4A consistent literature has analyzed the difference between candidates’ behavior under
divide) would be equivalent to reducing groups’ coordination ability. When
the presence of minority candidates on party lists is imposed by law, a
cohe-sive minority group has the highest chances to elect its favorite candidates.5
What I am considering is therefore a best-case type of scenario.
Even under this scenario, my results show that minority representation
can be very limited under open list PR. In particular, the analysis highlights
a clear negative relationship between the number of preferential votes and the number of elected candidates representing the interests of the group.
Perfectly proportional representation (a situation where the share of elected
minority candidates is equal to the relative size of the group in the
popu-lation) is guaranteed only if voters can cast a small number of preferential
votes.
The intuition behind the negative correlation between number of
prefer-ential votes and minority representation is as follows. An important
char-acteristic of open list PR is that candidates are guaranteed to be elected if
the number of preferential votes they receive is above a specific threshold.
Guaranteed here means that their election is independent of the total number
of seats won by their party and the number of preferential votes obtained by
other candidates. The threshold turns out to be proportional to the number
of preferential votes that can be expressed. When voters can cast few
prefer-ential votes, the threshold is low. Then, the votes of the minority are enough
to guarantee that (the votes received by) some minority candidates pass the
threshold. The larger the number of preferential votes, the lower the ability
of the minority to cast enough votes on specific candidates and guarantee
their election. Furthermore, an increase in the number of preferential votes produces a “multiplier” effect on the power of the majority. Assume the
mi-nority contains 2 individuals, while the majority contains 6. The difference
between the total number of preferential votes that can be expressed by the
5I discuss the role played by a highly coordinated and non-ideological majority later in
two groups is 4 if each individual can cast one preferential vote, 8 if they
can cast two, 12 if three, etc. If the majority equally splits its votes across
the two parties, it will be able to give more and more preferential votes to
more and more majority candidates, eventually preventing the election of
any minority candidate.
Even though ethnic politics versus class politics is a dilemma mostly in
developing countries,6 a similar dilemma exists in democratizing countries.7 Consider a society divided along a class (i.e. income-related) dimension and
an ethnic dimension. Suppose that the two parties in my model are the party
of the rich and the party of the poor. When the poor of both ethnic groups
prefer to channel their frustration through ethnic politics, the relevant
coali-tion is between the rich majority group and the poor majority group, against
the rich and poor minority groups. In this case, the scenario is similar to the
one I consider in my model.8 If the system is open list PR and many prefer-ential votes can be cast, the majority ethnic group will divide up optimally
the votes across parties, because its main goal is coordinating to defeat the minority group. Taking a step back and considering the constitutional stage
in a democratizing country, these conclusions imply that an ethnic majority
group might prefer to choose an open list PR system with a large number of
preferential votes. Whenever the ethnic politics cleavage dominates the class
cleavage, this system will allow to reduce the representation of the minority
group.
In the baseline model, parties are passive players. Given the quota system
specified by the law and the assumptions about candidates’ characteristics,
6Take for example the comparison between India and Indonesia suggested by Huber
(2017): the two countries have a similar level of ethnic diversity, but ethnic politics is much stronger in India than it is in Indonesia. The interaction between economic and ethnic diversity play a crucial role in explaining this difference.
7For example, ethnic politics played a much more central role in Ukraine than it did
in Georgia, despite a similar level of ethnic diversity in the two countries (Huber (2017)).
8Thus, the presence of two different parties in my model implicitly represents a second
they essentially can play no role in deciding list composition. This very
sim-plified and stylized scenario constitutes a first step in the analysis of minority
representation under open list PR and allows to obtain clear and precise
con-clusions about the effect of the number of preferential votes. In Section 4.2,
I briefly discuss the possiblity of endogenizing list composition. I assume
parties want to maximize the number of seats won and can decide how many
minority and majority candidates to include in their lists. Two interesting insights emerge from this extension. First, contrary to what one would
ex-pect, the incentives to include minority candidates in the list are weaker when
few preferential votes are allowed. Under reasonable assumptions on voting
behavior in the subgames, no equilibrium exists where both parties include
minority candidates in their lists. In addition, there can be an equilibrium
where both parties only contain majority candidates. When voters can cast
a large number of preferential votes, these type of equilibria are harder to
sustain. Interestingly enough, the primary reason for including minority
can-didates in the list is not to attract the votes of the minority. Indeed, when the minority votes for a party and many preferential votes can be cast, the
majority always best responds by voting for that party too. The number of
votes assigned to the party by the group is strictly greater than the number
of voters in the minority. In this way, some majority candidates in the party
receive an amount of preferential votes that is strictly larger than the one
received by any minority candidate, gaining priority in the allocation of seats
(the larger the amount of preferential votes that can be expressed, the larger
the number of such candidates and the lower the number of elected minority
ones). By including minority candidates in their lists, then, parties are able to attract a consistent amount of votes by the majority.
A second important insight of Section 4.2 is that, if parties care about
maximizing the number of seats won, a situation in which only one party
contains minority candidates (or, in other words, the existence of a “minority
candidates in its list, two possible incentives can arise. First, the party
might be tempted to replace the minority candidates with majority ones
to attract more votes by the majority. Second, the other party might be
induced to include minority candidates in its list too. When few preferential
votes can be expressed, both incentives can arise, depending on the specific
assumptions one makes about equilibria in the voting subgames. Equilibria
with “minority parties” exist only under very specific assumptions. When the number of preferential votes is large, only the second effect arises.
As noted above, by assuming a cohesive minority behavior I am stacking
the deck against the results I obtain in the model. My results show that,even
if the minority is perfectly able to coordinate, open list PR can be associated
with very limited minority representation. Clearly, reducing the coordination
power of the minority would only strenghten this conclusion. On the other
hand, reducing the coordination power of the majority would probably result
in higher minority representation. However, for a fixed degree of coordination
ability, the comparative statics on the effect of the number of preferential votes would persist. The chances of electing a minority candidate in a party
decrease when i) enough majority voters vote for that party and ii) they
give enough preferential votes to their favorite candidates. Limiting the
coordination ability of the majority would affect both components. However,
for a given probability that enough majority voters vote for a party, an
increase in the number of preferential votes definitely increases the number
of majority candidates obtaining a consistent amount of votes. This reduces
overall minority representation. Section 4.3 further discusses this intuition
and provides an illustrative example.
The negative correlation between minority representation and the number
of preferential votes had already been established for limited vote systems
(Lijphart et al. (1986)). In these systems, all candidates appear on the same
ballot, voters do not cast a vote for parties and can only express preferential
largest number of votes. Open list PR therefore differs from limited vote
because of the possibility to cast a vote for a party list. The importance of
my contribution with respect to the literature on limited vote stems from two
observations. The first is more practical. Open list PR is a much more widely
used electoral system than limited vote.9 Establishing how well minority interests are protected under this system is therefore of great relevance. The
second observation is more technical: the presence of a party-vote in open list PR is a relevant difference with respect to limited vote. Two effects
come into play. First, while under limited vote a candidate competes with
all the other candidates, under open list PR she primarily competes with the
subset of politicians on the same party list. Most importantly, the election
of a minority candidate in a party is independent of the number of votes
received by candidates in the other party. This limits the power of the
majority to reduce minority representation: while under limited vote it is
enough to assign enough votes to many majority candidates, under open list
PR the group must assign enough votes to many candidates in both parties. The second effect arises from party behavior. Under open list PR, parties
have stronger incentives to include minority candidates in their lists. The
intuition is explained in Section 5 with the help of an example. The two
effects combined imply a (relatively) better performance of open list PR in
protecting minority interests.
The remainder of the paper is organized as follows. Section 2 introduces
the model. Section 3 contains the results. Section 4 discusses the main
assumptions and possible extensions. It also contains a more detail discussion
of the example about class- versus ethnic-identity. A short comment on the difference between open list PR and limited vote is contained in Section 5.
Section 6 concludes. All proofs can be found in the Appendix.
9The system is used to elect the Spanish Senate, Gibraltar’s House of Assembly and in
2
The Model
Consider a country whose total voting population is V. Voters are divided in
two groups: a minority, m, and a majority,M. Let Vj denote the number of
voters in each groupj ∈ {m, M}, withVm < V /2 and Vm+VM =V. During
an election, voters must choose S representatives in a unique electoral dis-trict. There are 2S candidates, equally divided in two party lists, A and B.
I assume the law requires each list to contain candidates representing both
groups, in proportion to the size of the group in the population. For
simplic-ity, I set V =S, so that each list must contain Vm minority candidates and
VM majority candidates (I discuss this assumption more in detail in footnote
11, once I have introduced the electoral system). Parties and candidates do
not make any strategic decision and the only players in the game are the two
groups of voters.10
Under open list PR, each voter must i) vote for a party and ii) express up to π ∈ {1, . . . , S} preferential votes for candidates within its list. Voters
cannot cast more than one preferential vote per candidate and cannot vote
for candidates outside the party list they voted for. I assume groups act as
unique and cohesive players. More precisely, each group j ∈ {m, M} must
decide i) an assignment of votes vP
j to each party P ∈ {A, B}, such that
vA
j +vjB = Vj and ii) for each of the vPj voters of group j voting for party
P, an allocation of (up to)π preferential votes across the S candidates inP,
satisfying the property that no voter casts more than one vote for the same
candidate.
The final composition of the parliament is then determined in two steps.
10When parties are not active players in the model, list length is an exogenous parameter.
Here, I am fixing it toS, to allow both parties to contain “enough” candidates of each type in their lists. I believe any other choice would be as arbitrary as this one, but probably harder to justify. One option could be to assume that one party contains exactly and only
Vm candidates. As I already argued in the introduction, however, this is not the right
First, seats are assigned to parties in proportion to the votes received. Given
the amount of votesvP
m andvMP assigned by each group to partyP, the party wins SP =vP
m+vMP seats11. In the second step, the SP seats won by party
P are assigned to the candidates (in P’s list) that have obtained the largest
number of preferential votes. Ties are broken by assigning the seat to each
entitled candidate with equal probability.
The groups care about the final composition of the parliament and want to maximize the number of candidates representing their interests. Let Cm
denote the set of all minority candidates running for election (with |Cm| =
2Vm) and by W the set of elected candidates (with |W| = S). The set of
elected minority candidates is therefore Wm = Cm ∩W. I define minority
representation (M R) as the cardinality of this set: M R = |Wm|. I say
that minority representation is (perfectly) proportional, or that the minority
is perfectly represented, whenever M R = Vm. Groups’ preferences can be
expressed as
Um =M R
UM =S−M R
3
Results
As a preliminary observation, notice that it is a weakly dominated strategy
for a group to vote for candidates representing the other group. For any
strategy played by the majority, voting for a majority candidate either has no
effect on the number of minority candidates elected, or it strictly decreases
it. The symmetric reasoning holds for the majority. In the analysis that follows, I do not consider this type of strategies.
11A more general formulation would assume that the total number of voters isV > S,
that a party wins one seat every q=V /S votes received and that unallocated seats are distributed to the party with the largest remainder (Largest Remainder Method). Setting
V =S allows to disregard remainders and is equivalent to assuming that each of the V
The following lemma contains a first, important observation about open
list PR.
Lemma 1. In open list PR, receiving π votes is a sufficient condition for a
candidate to be elected.
A formal proof of the lemma is contained in the appendix. Intuitively,
as there are V party-votes and π preferential votes per voter, a total of
πV preferential votes will be cast. As S = V, winning π preferential votes
directly implies that a candidate wins a seat.12
A direct consequence of Lemma 1 is that perfectly proportional minority
representation is guaranteed whenever π ≤ Vm. When π is in this range,
indeed, the minority is always able to assign π preferential votes to Vm
can-didates within the same party. Clearly, since π ≤ Vm implies π ≤ VM, an
identical reasoning proves that the majority can always guarantee the
elec-tion of VM majority candidates. The number of elected minority candidates
therefore never exceeds the perfectly proportional one.
Proposition 1. In open list PR, the minority is proportionally represented
in parliament (M R=Vm) whenever π≤Vm.
The outcome described in Proposition 1 can arise from multiple equilibria.
In particular, all mixed strategy profiles where groupj ∈ {m, M}assigns all
its votes to one party with probability pj are (outcome-equivalent) equilibria
of the game. Extreme cases include those where pj = 1 or pj = 0 for
both groups (one party winning all the votes), and those where pj = 1 and
pj0 = 0 (each party receiving all and only the votes of one group). More
refined mixed strategy profiles (for example, completely mixed ones) can
constitute equilibria as long as they guarantee that Vm minority candidates
and VM majority ones are elected in expectations. This strictly depends on
the assumptions about the size of the two groups and the value of π.
Let me now turn to the case of π > Vm. A first, immediate observation
is that increasing the number of preferential votes can never improve the
representation of the minority in parliament. As before, the majority can
al-ways guarantee the election of at leastVM candidates, limiting the maximum
number of elected minority candidates to Vm. When π∈ {Vm, . . . , VM}, the
result follows immediately from Lemma 1, as discussed above. Whenπ > VM,
by voting for exactly the same VM candidates, the majority can assign VM preferential votes to each of them, which is more than what any minority
candidate can receive. This ensures the election of VM majority candidates.
As a matter of fact, the minority is strictly harmed by an increase in the
number of preferential votes. Consider the following example.
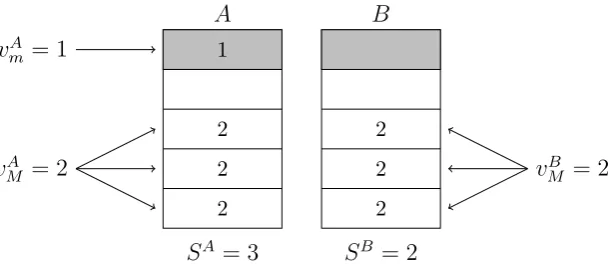
Example 1. LetVm = 1 and VM = 4. Whenπ = 1, Proposition 1 guarantees
M R = 1. Now letπ = 3 and consider the following voting behavior by the
majority: i) party-votes are equally divided betweenAandB (vA
M =vBM = 2) and ii) for every partyP, the 2 voters voting for it cast their preferential votes
for the same 3 majority candidates. Figure 1 provides a graphical illustration.
The strategy guarantees that 3 majority candidates in each party receive 2
preferential votes. Now consider the best response by the minority voter.
Assume he votes for party A and assigns his preferential vote to the only
minority candidate in the party. Then, A wins SA = 3 seats, and these will be assigned to the 3 candidates receiving the most preferential votes. These
are all majority candidates. As the same conclusion holds if the minority
voter votes for B, no minority candidate will be elected in equilibrium.
Proposition 2. Let VM = 2(Vm+ 1). In open list PR, minority
representa-tion is decreasing in π whenever π > Vm. More precisely,
M R(π)≤max{Vm−(π−VM/2),0} (1)
Inequality (1) generalizes the intuition behind Example 1: (the upper
A B
SA= 3 SB = 2
vB
M = 2
vA
M = 2
2 2 2 1
2 2 2
vA
[image:15.595.154.461.260.392.2]m= 1
proportional level, Vm) when the majority can vote for a number of
candi-dates strictly larger than the number of seats it assigns to parties by equally
splitting its votes between them, i.e. π > VM/2.
As for Proposition 1, there are many strategy profiles leading to the
equilibrium outcome described in Proposition 2. The equilibrium strategy
of the majority in this case is however fixed: the group must assign exactly
half of the votes to each of the parties. Failing to do so would result in a positive probability that a minority candidate is elected. The multiplicity of
equilibria then arises from the behavior of the minority. As before, assigning
all the votes to one party with probability pm is an equilibrium strategy, for
all pm ∈[0,1].
Proposition 2 considers a specific size for the two groups. The case of a
larger relative size of the majority (VM >2(Vm+ 1)) is of limited interest: it
seems clear that, in this case, minority representation would decrease even
faster when π increases. A more interesting case is the one of a relatively
small majority, VM <2(Vm+ 1). Consider a modified version of Example 1.
Example 2. Let Vm = 1, VM = 3 and π = 3. This is illustrated in Figure 2.
Assume the minority voter votes for party Aand assigns his preferential vote
to the minority candidate in the party. The best response of the majority
is to allocate two votes to A and one to B (vMA = 2, vMB = 1). Indeed, if the 2 voters voting forA distribute their preferential votes across the same 3
candidates, these will be the only winners of theSA = 3 seats obtained by the
party. In partyB, three majority candidates receive one preferential vote and
each of them will be elected with probability 1/3. Under this strategy profile
then, M R = 0. However, it cannot be an equilibrium. Given the strategy
played by the majority, the minority voter strictly prefers to vote forB: this
allows the minority candidate in the party to receive one preferential vote
and to compete with the other 3 majority candidates for the assignment of
A B
SA= 3 SB= 1
vB
M = 1
vA
M = 2
2 2 2 1 1 1 1
vAm = 1
A B
SA= 2 SB = 2
vB
M = 1
vA
M = 2
2 2 2 1 1 1 1 vA
[image:17.595.150.461.123.388.2]m = 1
Figure 2: Graphical representation of Example 2. If the minority assigns its vote to party A (top figure), the best response by the majority is to assign 2 votes to A and one to B and let the two A-voters vote for the 3 majority candidates. However, given this strategy by the majority, the best response by the minority is to assign its vote to B (bottom figure).
minority voter votes for B, the majority prefers a strategy that is symmetric to the one described before (vA
M = 1, vBM = 2), to which the minority voter would in turn best respond by voting forA. The (mixed strategy) equilibrium
of the game involves the two players randomizing between their two strategies
with equal probability, and leads to an outcome where a minority candidate
is elected with probability 0.25.
Proposition 3. In open list PR, minority representation is weakly decreasing
• If VM = 2Vm+ 1, then
E[M R(π)] = 1
2(2Vm+ 1−min{π, VM}) +
Vm2
Vm+ min{π, VM} (2)
• If VM <2Vm+ 1, then
E[M R(π)] = 1
2(3Vm+ 1−min{π, VM}) (3)
where E[M R(π)] denotes the equilibrium expected minority representation.
The qualitative result found in Proposition 2 therefore does not change:
increasing the number of preferential votes goes against the interest of the
minority. However, (expected) minority representation never reaches zero.
When π ≥VM, (2) and (3) become
E[M R(VM)] =
Vm2
3Vm+ 1
>0 (2’)
E[M R(VM)] =
1
2(3Vm+ 1−VM)>0 (3’)
respectively. As one would expect, minority representation is decreasing in
the relative size of the majority. Using (3’), one can see that E[M R(VM)] =
Vm when VM =Vm+ 1. At the opposite extreme, when VM = 2Vm+ 1, (2’)
implies that E[M R(VM)]< Vm/3.
4
Discussion and Extensions
4.1
Ethnic politics versus class politics
Consider again the ethnic politics versus class politics dilemma discussed in
the introduction. In this section, I discuss how my model can be applied
to a society that is divided along both dimensions. I provide an example
M m
r 1 1
[image:19.595.266.346.122.195.2]p 5 1
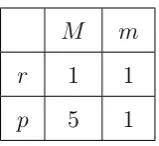
Table 1: Distribution of individuals across class- and ethnic-identity.
class-identity, referring to their income level, and an ethnic-identity. Assume
there are two possible class-identities, rich (r) and poor (p), and two possible
ethnic-identities, majority (M) and minority (m). This defines four possible
groups: the rich majority, the rich minority, the poor majority and the poor
minority. Table 1 shows an hypothetical distribution of 8 voters across the
different identities. Rows represent class-identity, columns represent
ethnic-identity. Each cell in the table then contains the number of individuals belonging to each of the four groups.
There exist two parties, the party of the rich (R) and the one of the
poor (P). Each party also contains 2 minority candidates and 6 majority
ones. The electoral system is open list PR, exactly as in the baseline model.
Assume voters care about two goals: i) they want the party representing
their class-identity to win the majority of the seats in parliament; and ii)
they want to maximize the number of elected candidates representing their
ethnic-identity. Assume also that voters in the poor majority group are
perfectly able to coordinate. In this scenario, what would be the voting equilibrium for different values of π?
Start by consideringπ≤2. If one focuses only on strategies that are not
weakly dominated, voting according to class-identity (i.e. all the rich voting
for partyRand all the poor voting for partyP) is the only equilibrium in this
case. PartyP wins the majority of the seats (6) and two minority candidates
are elected, one in each party. No voter has an incentive to change voting
increase the number of elected candidates representing an ethnic group.13
Now assumeπ= 8. If voters purely voted according to their class-identity,
as in the equilibrium just described, no minority candidate would be elected
in party P: the poor majority group would be able to assign 5 preferential
votes to all the majority candidates in the party. In partyR, the two minority
candidates would compete with the majority candidates for the assignment
of two seats. A minority candidate would be elected with probability 1/4. In this scenario, the poor minority voter would prefer to vote “ethnically” for
party R. This would not affect the chances of party P winning the majority
of seats, but would guarantee the election of two minority candidates in party
R. A similar reasoning shows that a pure “ethnic-voting” equilibrium might
not exist when ethnic considerations are strong enough. Assume all minority
voters vote for partyRand all majority voters vote for partyP. The outcome
would be the same as for the case of smallπ: partyP would win the majority
of the seats and two minority candidates would be elected in partyR. In this
scenario, the poor minority group might prefer to assign two votes to partyR: this would make the two parties tie, but would strictly decrease the number
of elected minority candidates. If ethnic-politics dominates class-politics,
this a profitable deviation. Under similar conditions, the equilibrium in this
voting game is such that all voters vote for their favorite party, except for two
poor-majority voters, who vote for party R(or, in other words, the majority
equally splits its votes across the two parties). This creates a tie between the
two parties but prevents the election of any minority candidate.
The example perfectly replicates the results contained in the main section
of the paper. Under open list PR with small π, the interest of the minority are always protected, even if voters vote according to their class-identity.
When π is large however, a stronger ethnic-identity would induce the
ma-13If weakly dominated strategies are allowed, the strategy profile such that all minority
jority to disregard class interests and optimally distribute its votes across
different parties, in order to limit the representation of minorities. This
con-clusion is of particular relevance if one considers the constitutional stage in a
democratizing country. A class-based ruling majority would prefer to adopt
an open list PR with small π. However, an ethnic-based ruling majority will
always set π very large: whenever ethnic-identity is predominant in the
soci-ety, this allows the group to consistently limit the representation of minorities in parliament.
4.2
Endogenous party list composition
Assume the number of minority candidates in each list is not set by law
and parties are free to decide list composition. This introduces two new
players in the game, (the leader of) party A and (the leader of) party B.
Assume their only goal is to maximize the number of seats won. A first,
natural question to ask is whether the list composition I assumed in the
benchmark model can be sustained in equilibrium. For simplicity, let me
assume that party leaders can only decide whether to include Vm minority
candidates or not in their lists.14 Also, let me focus on the two polar cases of π ≤Vm and π =S. Considering more refined strategies and intermediate
values of π would consistently decrease the tractability of the analysis and
conclusions would very likely depend on specific assumptions on the size
of the two groups. Assume both party lists initially contain Vm minority
candidates and let π ≤ Vm. As noted above, many voting equilibria can
arise in this subgame. While they all lead to the same outcome in terms
of minority representation, they differ in the number of seats obtained by
each party. Equilibrium restrictions in the voting subgame therefore matter
a lot for the conclusions. The same holds for equilibrium outcomes in the
14Parties cannot choose list length. When candidates can be placed on lists at no cost,
subgame where only one party contains minority candidates. In general, one
can always find conditions on voting behavior that ensure the existence of
equilibria with both parties containing minority candidates. However, this
type of equilibrium fails to exist under reasonable assumptions. Assume for
example that, if only one party contains majority candidates, it obtains all
the votes of the majority. This is the case if, everything else being equal, the
group prefers to vote for the party that “best represents” its interests. Then, (at least) one party has incentives to replace theVmminority candidates with
majority ones.
Now assume π = S. Even if one party removes the Vm minority
can-didates, it will never be able to attract all the votes of the majority. The
minority will vote for the other party and, in turn, this will attract some of
the votes of the majority (exactly half in the case of Proposition 2), who aims
at preventing the election of minority candidates in the party. The deviating
party therefore strictly decreases the number of seats won. The existence of
equilibria where both parties contain Vm candidates in their lists is therefore easier to sustain when π is large.
The opposite question one can ask is whether equilibria where no party
contains minority candidates can exist. In line with the intuition above, this
is more likely for small values of π (although, as before, this type of
equi-libria do not exist under specific restrictions on voting behavior). Sufficient
conditions for the existence of an equilibrium with no minority candidates in
party lists are that i) equilibrium behavior in this subgame results in both
parties obtaining half of the seats and ii) the majority casts all its votes for
one party whenever this is the only party containing majority candidates. Under these assumptions, no party would be willing to include a minority
candidate in its lists when the other does not. The opposite holds when π
is large and the intuition is the same as before: attracting the votes of the
minority helps to attract the votes of the majority too.
to include minority candidates in party lists are stronger whenπis large. This
is somewhat surprising. Given the results in Section 3, one would expect these
incentives to be stronger for small values of π. If the minority can guarantee
the election of some candidates with their votes, parties should be more likely
to target the group. These incentives look much weaker for the case of large
π, where the power of the minority is consistently reduced. As it turns out,
this intuition is misleading. The willingness of the majority to prevent the election of minority candidates acts as a powerful force and induces parties
to include (some) minority candidates in their lists.
Finally, this simple framework can be used to answer an additional
ques-tion: can there be equilibria with one “minority party”? This would be a
situation where only one party contains minority candidates. Let this party
be A. There are two possible reasons why this configuration might not be
part of an equilibrium. First, party A might have incentives to replace the
minority candidates with majority ones. Second, partyB might want to add
minority candidates in its list. For π ≤ Vm, the profitability of the two de-viations depends, again, on equilibrium restrictions in the voting subgames.
Just consider the following two examples. First, let the majority vote for
party B (the “fully majoritarian” party), so that party A obtains only Vm
seats. Also, assume that when no party contains minority candidates, each
of them gets half of the votes. In this case, partyAcan profitably deviate by
replacing the minority candidates with majority ones. Alternatively, assume
the majority votes for A as well and the party obtains more than half of the
seats. Then partyB might have incentives to includeVm candidates in its list
too. This is a profitable deviation if, among the equilibria arising in a voting subgame where both parties containVm minority candidates, we select those
in which seats are equally shared.
When π is large, a “minority party” can never exist. The driving forces
are the same as before: (both) parties need minority candidates to attract
will obtain the votes of the minority and many votes of the majority. Party
B has therefore incentives to include some minority candidates in its list, to
attract the votes of the two groups.
As a side note, notice that this reasoning rules out the existence of “pure
minority parties”, i.e. those containing exactly and only Vm minority
candi-dates. For party A in the example, including majority candidates in the list
strictly increases the number of seats won, as it allows to attract more votes from the majority. A pure minority party could only exist in my model if
parties were not purely interested in maximizing the number of seats won.
The simple framework considered here clearly does not claim to be an
exhaustive description of party behavior under open list PR. However, it
suggests an interesting conclusion: imposing a quota on the number of
mi-nority candidates that must appear on party lists can only help the interest
of the minority. When π is small, party decisions are likely to reduce
mi-nority representation, by reducing the availability of mimi-nority candidates in
their lists. On the contrary, parties seem to have larger incentives to include minority candidates when π is large. Given the conclusions obtained in the
previous section, however, the minority is never able to benefit from it.
No-tice that this reinforces the conclusions obtained in the previous section: at
the constitutional stage during a transitions to democracy, a majority ethnic
group in an ethnically divided society may have incentives to choose open
list PR with large π.
4.3
Coordination
As noted in the introduction, the paper makes a list of assumptions
guaran-teeing a highly coordinated and cohesive behavior by the two groups. This
section explores the consequences of assuming lower degrees of coordination.
If the minority did not behave as cohesive group, it would only decrease its chances to elect representatives that act in its interest. This would only
minority interests.
A less cohesive majority would probably increase the chances of electing
minority candidates. However, the comparative static results on the effect
of π would not change. The key intuition is the following: a less
coordi-nated majority would have lower chances of being able to target its votes
to the same party the minority voted for. This would therefore reduce the
ability to prevent the election of minority candidates. However, with strictly positive probability, the majority will still assign enough votes to the same
party supported by the minority. Increases in π reduce the probability that
a minority candidate is elected in those scenarios, therefore reducing overall
minority representation. The following illustrative example assumes no
coor-dination power for the majority and a completely non-strategic behavior by
voters within it. It shows that, even in this limit case, (expected) minority
representation is decreasing in π.
Example 3. Let Vm = 1 and VM = 3. Assume the majority does not act
as a cohesive group and each voter in the group behaves completely
non-strategically. More precisely, let each of them vote for partyAwith
probabil-ity ρ. Furthermore, assume they distribute their preferential votes randomly
across majority candidates in the party they voted for.15 The minority is still assumed to be a cohesive and strategic group, as in the benchmark model. Without loss of generality, let the minority voter vote for party A and for
the minority candidate in its list. When π = 1, the candidate is elected for
sure by Lemma 1. When π= 2, the probability that the candidate is elected
depends on how many majority voters vote for party A and on how they
distribute their preferential votes. If no majority voter votes for A or if all
of them do, the minority candidate is elected for sure. If only one majority
15In the example, voters are still perfectly able to distinguish minority from majority
voter votes for A, the candidate is elected with probability 2/3: party A
wins two seats and contains three candidates (the minority candidate and
two majority ones) receiving one preferential vote. If two majority
candi-dates vote for A, they can distribute their preferential votes in two possible
ways: with probability 1/3, they give two preferential votes to two majority
candidates and none to the third; with probability 2/3, they give two votes
to one candidate and one to the other two. In the first case, the minority candidate is elected for sure. In the second, she is elected with probability
1/3. Combining all these considerations, expected minority representation
for π = 2 is
E[M R(2)] =ρ3+ (1−ρ)3+2 3
3
1
!
ρ(1−ρ)2 + 3
2
!
ρ2(1−ρ)
1 3+ 2 3· 1 3
Now assumeπ= 3. As before, the minority candidate is elected for sure when
no majority voter votes for A or all of them do. When only one voter votes
forA, the minority candidate wins with probability 1/2 as she competes with
three other candidates for the assignment of two seats. Finally, when two
majority voters vote for A, they assign two preferential votes to all majority candidates in the party and the minority candidate has no chances of being
elected. Expected minority representation in this case is then
E[M R(3)] = (1−ρ)3+ 1 2
3
2
!
ρ(1−ρ)2+ρ3
It is immediate to see that E[M R(1)]> E[M R(2)]> E[M R(3)].
4.4
Number of parties
Proportional representation systems are usually associated with the existence
of multiple parties. The results contained in Lemma 1 and, as a consequence,
long as list composition is decided by the law as in the baseline model).
The presence of more than two parties would definitely enlarge the set of
equilibria having M R =Vm as an outcome, but would not limit the ability
of the minority to ensure the election of their favorite candidates.
The conclusions in Proposition 2 hinge on the possibility for the majority
to assign a large number of votes to all parties. In presence of more than
two parties, therefore, the relative size of the majority should be even larger for the result to hold. If, for example, the number of parties was equal to
three, the intuition behind Proposition 2 would still hold if VM ≥3(Vm+ 1):
the majority could assign Vm+ 1 votes to each of the three parties and, asπ
increases, cast a large number of preferential votes to more and more
candi-dates. More generally, a sufficient condition for the equivalent of Proposition
2 to hold in presence of N parties is thatVM ≥N(Vm+ 1).
The case of a “small” majority (Proposition 3) is not as straightforward
to analyze and I can only formulate conjectures about it. As before, the
majority wants to concentrate enough votes on the party chosen by the mi-nority, while the minority will try to differentiate its vote as much as possible
from the one of majority. The equilibrium will be in mixed strategies. For
some combinations of the pure strategies played with positive probability
in equilibrium, the two groups will vote for different parties and some
mi-nority candidates will be elected. For some other combinations instead, the
majority will concentrate enough votes on the party the minority is voting
for and will be able to prevent the election of (some) minority candidates.
The largerπ, the lower the number of minority candidates elected in this
sce-nario. Expected minority representation is probably increasing in the number of parties, as this increases the opportunity for the minority to vote for a
dif-ferent party than the majority. However, for a fixed number of parties, the
5
Limited vote vs Open List PR
As discussed in the introduction, an increase in the number of preferential
votes produces the same effect under limited vote and open list PR. This
section highlights the difference between the two systems. The possibility to
cast a party-vote under open list PR turns out to play a fundamental role. Whenπ is small, the election of minority candidates is guaranteed under
both systems. Similarly, whenπis very large and the two groups consistently
differ in their sizes (as in Proposition 2), no systems will guarantee any
pos-tive level of minority representation. However, in presence of a “small”
ma-jority (as in Proposition 3), the two systems produce substantial differences
when many preferential votes can be expressed.
Consider Example 2 again. Under open list PR, a minority candidate
wins a seat with probability 0.25. Now assume the eight candidates in the
two parties compete under limited vote. Voters face a ballot containing two minority candidates and six majority ones and must cast a preferential
vote for three of them. If majority voters assign their votes to the same
four majority candidates, these will receive (at least) two votes each. As
minority candidates can receive at most one vote, none of them has a positive
probability of being elected. Thus, minority representation would be zero
under limited vote.
The presence or absence of party lists is therefore key. Under open list PR,
candidates are divided in two groups that only partially compete against each
other. The election of a minority candidate in one party is independent of the number of preferential votes obtained by majority candidates in the other.
In order to completely prevent the election of minority candidates, then, the
majority should be able to assign enough votes to its favorite candidates in
both lists. This imposes stronger constraints on the size of the majority than
those imposed by limited vote.
Open list PR also produces different incentives for parties to include
where no party contains minority candidates is very unlikely to occur under
open list PR with large π. In addition, whenever a party contains some
mi-nority candidates, the other party has incentives to include some too. The
same is not true under limited vote. Again, Example 2 provides a good
in-tuition. For open list PR, assume party B does not contain any minority
candidate in its list. Then, by including one minority candidate, party A
can attract the votes of the minority and two votes by the majority. This is because by setting vA
M = 2, the majority can assign two preferential votes to three candidates, preventing the election of the minority one. Thus, party
A strictly benefits from introducing the minority candidate in its list. Now
consider the equivalent situation under open list. Assume all of the eight
candidates on the ballot are majority candidates. Would a party be able to
increase the number of seats won by replacing some of those candidates with
minority ones? As long as at least four majority candidates remain on the
ballot, no minority candidate would have any chance of being elected. Then,
a party can never gain by including more minority candidates.
Combining the two insights, one can conclude that open list PR performs
relatively better than limited vote in protecting the interest of the minority.
The two systems produce equivalent results for extreme cases (small π or
large π with large majority). However, open list PR guarantees a positive
expected minority representation for smaller sizes of the majority and creates
higher incentives for parties to include minority candidates in their lists.
6
Conclusions
The paper contributes to the literature on the impact of electoral systems
on minority representation. In particular, it studies the relationship between
the number of candidates voters can vote for under open list PR and the
representation of minorities in parliament. I consider a society divided in
interests as possible. Voters can vote for a party and, within the party,
can express some preferential votes for individual candidates. Seats are first
allocated across parties in proportion to the votes received and then within
parties to the candidates obtaining the largest number of preferential votes.
My results show that an increase in the number of preferential votes that
can be cast by voters reduces the representation of minorities in parliament.
This is because of a multiplier effect: when more preferential votes are allowed for each individual, the total number of votes the majority can use increases
more than the one for the minority. Thus, the majority can always assign
more votes to more candidates.
Most of the assumptions made in the model are conservative ones. They
allow for a clean and simple analysis of a situation where minorities are unable
to create their own parties. The groups must therefore rely on the possibility
to elect candidates representing their interests in parties containing many
other different candidates. This is the only situation in which the number
of preferential votes to be expressed matters for minority representation. Results show how this can be very limited even in the most favorable situation
for the minority. Relaxing many of the assumptions I make would therefore
only worsen the outcome.
The result of the paper is in line with what was already proven for limited
vote systems. However, the possibility to cast a party-vote under open list
PR turns out to have a significant impact. More precisely, minority
represen-tation seems to be (relatively) better protected under open list PR. This is
because the system limits the power of the majority to prevent the election of
minority candidates and provides higher incentives to parties to let minority candidates run.
An interesting application of the model helps drawing conclusions on the
design of electoral systems in countries that are transitioning to democracy.
When the ethnic division in a society is particularly strong, majority ethnic
References
Ames, B. (1995). Electoral strategy under open-list proportional
representa-tion. American Journal of Political Science 39(2), 406–433.
Aumann, R. J. (1959). Acceptable points in general cooperative n-person games. InContributions to the Theory of Games IV. Princeton University
Press, Princeton NJ.
Carey, J. M. and M. S. Shugart (1995). Incentives to cultivate a personal vote:
a rank ordering of electoral formulas. Electoral studies 14(4), 417–439.
Chang, E. C. (2005). Electoral incentives for political corruption under
open-list proportional representation. Journal of Politics 67(3), 716–730.
Chang, E. C. and M. A. Golden (2007). Electoral systems, district magnitude
and corruption. Journal of Political Science 37(1), 115–37.
Coate, S. and M. Conlin (2004). A group rule–utilitarian approach to voter
turnout: theory and evidence. The American Economic Review 94(5),
1476–1504.
Crutzen, B. (2013). Keeping politicians on their toes: Does the way parties
select candidates matter?
Feddersen, T. and A. Sandroni (2006). A theory of participation in elections.
The American Economic Review 96(4), 1271–1282.
Huber, J. (2017). Exclusion by elections: Inequality, ethnic diversity and
redistribution. Cambridge University Press.
Huber, J. D. (2012). Measuring ethnic voting: Do proportional electoral
laws politicize ethnicity? American Journal of Political Science 56(4),
Lijphart, A. and R. W. Gibberd (1977). Thresholds and payoffs in list
sys-tems of proportional representation. European Journal of Political
Re-search 5(3), 219–244.
Lijphart, A., R. L. Pintor, and Y. Sone (1986). The limited vote and the single
nontransferable vote: lessons from the Japanese and Spanish examples. In
B. Grofman and A. Lijphart (Eds.), Electoral Laws and Their Political Consequences. Agathon, New York.
Rae, D., V. Hanby, and J. Loosemore (1971). Thresholds of representation
and thresholds of exclusion. Comparative Political Studies 3(4), 479.
Shugart, M. S., M. E. Valdini, and K. Suominen (2005). Looking for locals:
Voter information demands and personal vote-earning attributes of
legis-lators under proportional representation. American Journal of Political
Science 49(2), 437–449.
A
Appendix
Proof of Lemma 1. Assume a candidate c ∈ P receives π preferential
votes. Since no voter can cast more than one preferential vote for the same
candidate, at least π voters must be voting for P and SP ≥ π. Candidate
c faces a positive probability of not being elected only if at least SP other candidates in partyP receive at leastπ preferential votes. Thus, there must
be at least π+ 1 candidates in P receiving at leastπ votes. As no voter can
vote for more than π candidates, this is only possible if at leastπ+ 1 voters
vote for P. Thus,SP ≥π+ 1. Candidatec then faces a positive probability
of not being elected only if there are at leastπ+ 1 other candidates receiving
at least π votes. Then, at least π+ 2 candidates in P must be receiving at
least π votes. By the same reasoning used before, this implies that at least
π+ 2 individuals must be voting for P and SP ≥π+ 2. Applying the same
reasoning enough times, one finds that c’s probability of not being elected is strictly positive only if SP ≥S, a contradiction.
Proof of Proposition 2. Assume the majority plays the following
strat-egy: i) vAM =vMB =VM/2 and ii) for each party P, the vPM voters voting for
it assign their preferential votes to the same min{VM, π} candidates, where the minimum is introduced to exclude the possibility that majority voters
vote for minority candidates when π > VM. Each party therefore contains
min{VM, π} majority candidates receivingVM/2 = Vm+ 1 preferential votes.
This is more than what any minority candidate can obtain (Vm). Consider
any assignment of votes to parties by the minority (vA
m, vBm). Each party P wins SP =VM/2 +vmP seats, and the number of elected majority candidates
in the party will be min{SP, VM, π}= min{SP, π}, sinceSP < VM. Minority
candidates will win any residual seat, so that
M R=S−min{SA, π} −min{SB, π} (4)
than max{Vm−(π−VM/2),0}.
Proof of Proposition 3. First of all, notice that the only rationalizable strategies for the minority must be such that vP
m = Vm and vP
0
m = 0 for some P, P0 ∈ {A, B}, P 6= P0. If minority voters vote for all Vm minority
candidates in the party they have chosen, all these candidates will receiveVm
preferential votes. Once all non-rationalizable strategies by the minority have
been eliminated, the majority is left with only two undominated strategies:
assign vP
M =Vm+ 1 votes to some partyP and vP
0
M =VM −(Vm+ 1) votes to partyP0, and let majority voters vote for the same min{π, VM}candidates in
the two parties. Thus, only four possible strategy profiles can emerge. The
outcomes originating from these strategies depend on the relative size of the majority. Let VM < 2Vm + 1. When vPm = Vm, vP
0
m = 0 and vPM = Vm+ 1,
vP0
M =VM −(Vm+ 1), SP = 2Vm+ 1 and SP
0
=VM −(Vm+ 1). As majority
candidates inP have priority in the allocation of seats (each of them receives
Vm+1 votes, while each minority candidate only receivesVm) and no minority
candidate receives any preferential vote in party P0, the number of elected
minority candidates will be
M R1 =SP −min{π, VM}= 2Vm+ 1−min{π, VM}
Now letvP
m =Vm, vP
0
m = 0 andvPM =VM−(Vm+ 1),vP
0
M =Vm+ 1. Under my assumption on the relative size of the two groups, VM −(Vm+ 1) < Vm and
minority candidates have priority in the allocation of theSP =V
M−1 seats. All minority candidates will be therefore elected. The following table shows
the payoffs originating from the four strategy profiles. The strategies for the
minority are shown on the raws, those of the majority on the columns. The
payoff for the minority is the first entry in the payoff vector.16
16The underlying assumption is that the voters voting for a party assign their preferential
(Vm+ 1, VM−(Vm+ 1)) (VM −(Vm+ 1), Vm+ 1)
(Vm,0) M R1, S−M R1 Vm, S−Vm
(0, Vm) Vm, S−Vm M R1, S−M R1
As this is a zero-sum game and M R1 < Vm, the only equilibrium is a mixed strategy profile where the groups play each of their pure strategies with
equal probability. The expected minority representation originating from
this equilibrium is then
E[M R(π)] = 1
2M R1+ 1 2Vm =
1
2(3Vm+ 1−min{π, VM})
Now consider the case of VM = 2Vm+ 1. The only change with respect to the
previous case is that now, when vmP =Vm, vmP0 = 0 and vPM =VM −(Vm+ 1),
vP0
M =Vm+ 1, minority and majority candidates in party P receive the same amount of preferential votes. Thus, each of them wins one of the SP = 2V
m seats with equal probability and the expected number of elected minority
candidates in this case is therefore
M R2 =
2Vm
Vm+ min{π, VM}
Vm
The modified payoff matrix is
(Vm+ 1, VM−(Vm+ 1)) (VM −(Vm+ 1), Vm+ 1)
(Vm,0) M R1, S−M R1 M R2, S−M R2
(0, Vm) M R2, S−M R2 M R1, S−M R1
As the mixed strategy equillibrium does not change, one obtains
E[M R(π)] = 1
2(2Vm+ 1−min{π, VM}) +
Vm2