Effect of Zn Doping on Bismuth Oxide Thin Films
S. Prabahar1, S. Srikanth1, T. Samidurai2, R. Mahudeeswari3
1, 2, 3,
PG & Research Department of Physics, Government Arts College, Udumalpet-642 126, Tamilnadu, India
Abstract: Synthesis of Zn doped Bi2O3 thin films were successfully deposited on to glass substrates at 70˚C temperature by
Chemical Bath Deposition method, using Bismuth Nitrate, triethanolamine, Sodium Hydroxide pellets and Zinc Nitrate. The films were characterized by using optical analysis and Fourier transform infrared spectrum. FTIR analysis clearly explains about different types of stretching and bending vibrations present in Zn doped Bi2O3 thin films. The optical band gap of Zn
doped Bi2O3 thin films were varying 2.86- 2.14 eV depending on deposition time periods and thickness. Therefore, Zn doped
Bi2O3 thin films can be used as transparent conducting materials which are widely used as electrodes in solar cells, flat-panel
displays, light emitting diodes and other optoelectronics.
Keywords: Zn doped Bi2O3 thin films, Chemical bath deposition, Optical Studies, FTIR Characteristics
I. INTRODUCTION
Zinc doped Bismuth oxide is a substantial transition metal oxide with large value of band gap, refractive index, permittivity, electrochemical stability, specific capacitance, photosensitivity, photoluminescence and high oxide ionic conductivity at high temperature, giving its potential and practical use for, super capacitors, electrolyzers, ceramic membranes optical coatings, solar cells, transparent ceramic glass manufacturing, fuel cells and oxygen sensors[1,2]. Bi2O3 has four crystalline phases which are
(monoclinic) α-Bi2O3, (tetragonal) β-Bi2O3, -Bi2O3 (BCC), (cubic) δ-Bi2O3 and -Bi2O3 (triclinic).
Diverse phases have its divergent electronic assets and crystal structure. The preparatory condition of the Bi2O3 plays a key role in the nanostructure liable on vapor phase or liquid phase technique. Some of the important vapor phase technique includes RF sputtering, laser ablation, chemical vapor deposition and thermal evaporation. Likewise the liquid phase technique includes sol-gel, Silar, Electro deposition, and Chemical bath deposition and spray pyrolysis.
The electrical conductivity of Bi2O3 may be changed with the preparatory condition; the energy gap can also be amended from 2 to 3.96 eV.
There are different techniques for the preparation of Zinc doped bismuth oxide films, including chemical bath deposition, chemical spray pyrolysis, sol gel, sputtering and vacuum evaporated bismuth films.
Due to both experimental significance and theoretical attention, the study of optical belongings of Zinc doped bismuth oxide thin films has been testified by a number of authors [3-8]. The occurrence of the dopant shows a substantial role in the energy gap tuning.
It is the objectives of the current paper to formulate Zn doped Bi2O3 thin films through the chemical bath deposition method and optical characterization have been carried out.
II. MATERIALS AND METHODS
Zn doped Bi2O3 thin films were deposited on the glass substrate using chemical bath deposition method.
The precursor solution was prepared with Bismuth (III) nitrate dissolved in 25 ml of deionized water with a concentration of 0.1 M, then 25 ml solution of Zinc nitrate is prepared with a concentration of 0.1M and both the solution were mixed to make up 50ml of precursor solution, then 4 ml of triethonalamine is added to the solution to maintain the acidity of the solution in order to dissolve the Bismuth (III) nitrate with constant stirring at room temperature.
To regulate the pH value NaOH solution were added. Prior to deposition the glass substrate were cleaned with deionized water and acetone. The substrates were cut to dimensions of 1x3cm.
The substrate placed vertically in the bath for different deposition time varying from 60 to 120 minutes. While depositing the films at temperature 70oC the surface of the film has become more uniform while varying the pH of the bath it is found that the solution having pH value 12 gives uniform and compact films.
III. RESULTS AND DISCUSSION
A. Optical Analysis
3 2 0 3 2 5 3 3 0 3 3 5 3 4 0 0
5 1 0 1 5
A
b
s
o
rb
a
n
c
e
(
%
)
W a v e l e n g t h (n m)
Fig.1 UV Visible Absorbance Spectra of Zn doped Bi2O3thin films prepared at temperature 70˚C (pH 12, 60min) of thickness 3700 Å
3 0 0 3 1 0 3 2 0 3 3 0 - 4
0 4 8 1 2
A
b
s
o
rb
a
n
c
e
(
%
)
W a v e l e n g t h ( n m )
Fig.2 UV Visible Absorbance Spectra of Zn doped Bi2O3thin films prepared at temperature 70˚C (pH 12, 90min) of thickness 5900 Å
3 4 0 3 6 0 3 8 0 4 0 0
1 0 2 0 3 0 4 0 5 0 6 0 7 0 8 0 9 0 1 0 0
T
ra
n
s
m
it
ta
n
c
e
(%
)
W a v e le n g th ( n m )
3 4 0 3 6 0 3 8 0 4 0 0 1 0
2 0 3 0 4 0 5 0 6 0 7 0 8 0 9 0 1 0 0
T
ra
n
s
m
it
ta
n
c
e
(
%
)
W a v e l e n g t h ( n m )
Fig.4 Transmittance Spectra of Zn doped Bi2O3thin films prepared at 70˚C (pH 12, 90min) of thickness 5900Å
2 .0 2 .5 3 .0 3 .5
0 .0 0 E + 0 0 0 1 .0 0 E - 0 1 0 2 .0 0 E - 0 1 0 3 .0 0 E - 0 1 0 4 .0 0 E - 0 1 0
h( e V )
h
e
V
/c
m
)
2
Eg= 2 .8 6 e V 7 0C
Fig.5 A plot of (αhʋ)2 Vs (hʋ) Zn dopedBi2O3thin films prepared at prepared at 70˚C (pH 12, 60min) of thickness 3700Å
1 .8 2 .1 2 .4
0 . 0 0 E + 0 0 0 1 .0 0 E - 0 1 2 2 .0 0 E - 0 1 2 3 .0 0 E - 0 1 2 4 .0 0 E - 0 1 2
h
eV/
cm
)
2
h( e V )
Eg= 2 . 1 4 e V 7 0C
Figure 1 and 2 shows UV Visible Absorbance Spectra of Zn doped Bi2O3 thin films prepared at temperature 70˚C with pH 12 in 60 and 90 min respectively. Optical analysis of Zn doped Bi2O3 samples deposited over glass was performed using UV-Visible spectroscopy. UV-visible spectroscopy was performed in room temperature and at a region from 200 to 600 nm.
The absorbance decreases with the increase in deposition time period of the films, which leads to increase in the thickness of deposited films. The decrease in absorption with thickness can be explained in another way, where in this case of a thicker films, more atoms are present in the films so more states will be available for the photons to be absorbed[9-11]. When the deposition time period increases absorbance found to be decreased. Figure 3 and 4 shows Transmittance Spectra of Zn doped Bi2O3 thin films prepared at temperature 70˚C with pH 12 in 60 and 90 minutes respectively.
Transmittance spectroscopy was performed in room temperature and at a region from 200 to 600 nm. The band gap and the transparency is an important parameter in the opto-electronic devices. Analyzing the optical transmittance spectrum of Zn doped Bi2O3 thin film, the transmittance of 55-60% is observed for the lower thickness films whereas when the film is increases, the transmittance found to be decreases which is around 50-55%.
The optical transmittance spectrum depends on the chemical composition, crystal structure, energy of incident photon, film thickness and films surface morphology. The transmittance decreases with respect to deposition time period and film thickness. These results reveals that the film shows good uniformity and transparency in the visible and NIR regions(50-60%) and this high transmittance because there is no free electron this is because the breaking of electron linkage and moving it to the conduction band need photon with high energy.
Transmittance becomes constant in the range 310-400 nm. The band gap values depends in common on the films crystal structure, the organization and dispersal of atoms in the crystal lattice, also it is precious by crystal regularity.
The plot of (αhʋ)2 against hʋ for the films deposited at various deposition time periods are presented in Fig. 5 & 6. For a direct band
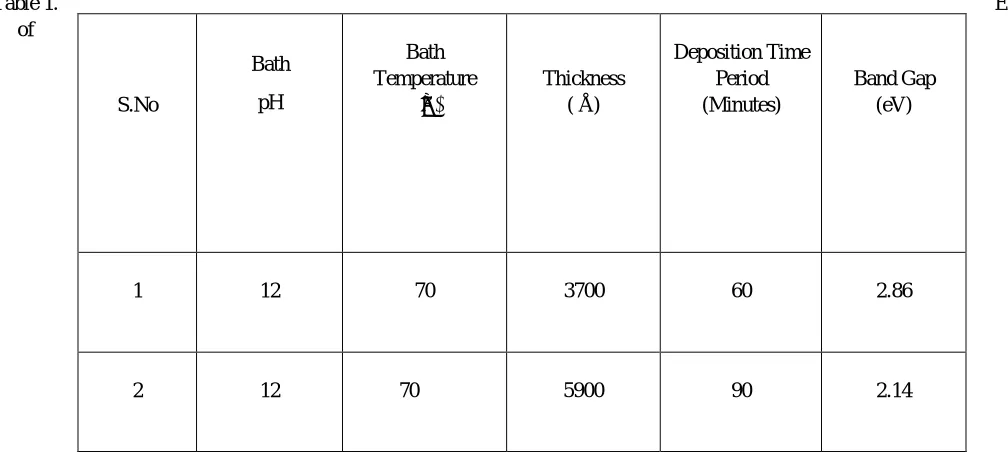
gap semiconductor (n=1), the (αhʋ)2 against hʋ is predicted to be a straight line with a photon energy (hʋ) axis intercept giving the band gap value. Optical band gap varied from about 2.86 to 2.14 eV for samples prepared at 60 and 90 minutes respectively and thus it is dependent upon thickness and deposition time period.
The decrease of band gap with increase of deposition time period is likely to be attributed to an increase of particle size, a decrease in strain and dislocation density in the films. Measured band gap values are comparable with earlier reported values.
[image:4.612.45.549.488.714.2]The decrease of film band gap is due to many reasons: (i) it may be caused by the presence of internal electrical fields associated with defects present in the films; (ii) it may be due to the action of atmospheric oxygen on the film surface, which produces an acceptor level in the forbidden band; (iii) the decrease of band gap with an increase of deposition temperature is likely to be attributed to an increase of particle size, a decrease in strain and dislocation density in the films[9]. The values of the optical band gap are tabulated in Table 4.1.
Table 1. Effect
of
thickness and deposition time period on optical band gap of the Zn dopedBi2O3 thin films S.No
Bath
pH
Bath Temperature
( ̊C)
Thickness ( Å)
Deposition Time Period
(Minutes)
Band Gap (eV)
1 12 70 3700 60 2.86
B.FTIR Analysis
5 0 0 1 0 0 0 1 5 0 0 2 0 0 0 2 5 0 0 3 0 0 0 3 5 0 0 4 0 0 0 4 5 0 0 0 .9 9 2
0 .9 9 4 0 .9 9 6 0 .9 9 8 1 .0 0 0 1 .0 0 2 1 .0 0 4
T
ra
n
s
m
it
ta
n
c
e
(
%)
W a v e n u m b e r (c m- 1) (6 6 0 )
(7 6 0 )
(1 5 4 0 ) (1 6 9 8 )
(2 3 6 1 )
[image:5.612.95.489.119.357.2](3 6 5 0 -3 8 5 0 )
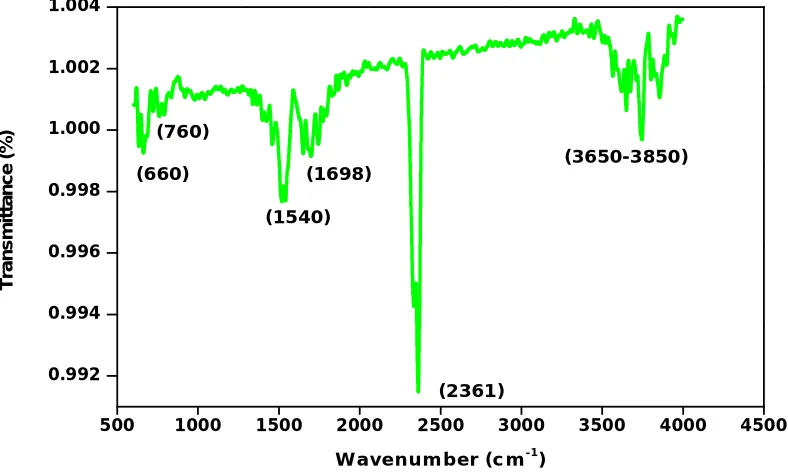
Fig.7 FTIR Spectra of Zn doped Bi2O3thin films prepared at temperature 70˚C (pH 12, 90min) of thickness 5900Å
Table 2. Indicates modes of FTIR Transmittance spectrum of Zn doped Bi2O3 thin films
The FTIR spectrum is used to recognize and analyze more smartly the structure and molecular arrangements of thin films. Type of functional groups present in the substance is indicated by the transmittance that occurs at various frequencies. Figure 7 shows FTIR spectrum of Zn doped Bi2O3 thin films prepared at 70˚C (pH-12) and 90 minutes. The Bi-O bond vibration and symmetrical stretching mode is observed at around in the wave number of 600-700 cm-1 [11].The oxalate group has absorption band at 1540cm-1 , conforming the presence of a oxalate group (c=o stretching mode )in the complex. A band at 1698 cm-1 is to be (H2O) and vibration of water molecule in the range of 2334-2421cm-1 is also observed. In addition to wave number of hydroxyl group is observed in the bands of 3500-4000 cm-1, that indicates the stretching vibration of water molecule present is to be confirmed. The common behavior of the FTIR spectra displays a broadening of the peaks and a complete smoothing when the Zn concentration from the samples rises. This behavior recommends a decrease of the crystallinity of the samples with the growth of zinc concentration. Furthermore, Zn
S.No Wave number (cm-1) Mode of Assignment
1 660 Bi-O bond vibration
2 760 Bi-O symmetrical stretching
3 1540 Sulphate group
4 1698 Absorbance of water
5 2361 Vibration of H2O molecule
[image:5.612.79.533.392.579.2]doping results given the absorption peak towards visible region. It is observed from Fig.7 that Zn doping has effectively enhanced the visible light absorption capability of Bi2O3 nanostructures which might be potential for visible light photo catalysis. This enrichment in absorption of light in visible region with Zn doping may be recognized to d-d transition concerning closely spaced Zn2+ and Bi2+ ions [12-15].
IV. CONCLUSION
The Zn doped Bi2O3 thin film was deposited by the CBD technique. UV-visible absorbance and transmittance spectroscopy performed in the room temperature and at a region from 200 to 600 nm. Absorbance and transmittance decreases as the deposition time period and film thickness are increases. The optical studies infer that the transmittance of 50% - 55% is observed for as deposited film and optical band gap varied from about 2.14 to 2.86 eV for samples prepared at 60 and 90 minutes respectively. The band gap value decreases with increase in deposition time period. FTIR analysis clearly explains about different types of stretching and bending vibrations present in Zn doped Bi2O3 thin films. Zn doped Bi2O3 thin films can be used as transparent conducting materials which is widely used as electrodes in solar cells, flat-panel displays, light emitting diodes and other optoelectronics.
REFERENCES
[1] F.I Ezema, “Optical Characterization of Chemical bath deposited Bismuth Oxyiodide thin films”, Turkish Journal of Physics, vol.29, pp.105-114, 2004.
[2] F.I Ezema, “Chemical bath deposition Bismuth Chloride Oxide thin film and its Applications”, Pacific journal of Science and Technology, vol.6, pp.6-15,
2005.
[3] P. Gopinath, S. Sriram and R. Chandiramouli, “Influence of Zn doping on nano structured Bi2O3 thin films”, International Journal of Chem Tech Research,
vol.8, pp.2534-2539, 2013.
[4] V. Fruth, A. Ianculescu, D. Berger, S. Preda, G. Voicu, E. Tenea and M. Popaa, “Synthesis, structure and properties of doped Bi2O3”, Journal of the European
Ceramic Society, vol.26, pp.3011–3016, 2006.
[5] H. Wang and Y. Chiang, “Thermodynamic Stability of Intergranular Amorphous Film in Bismuth-Doped Zinc Oxide”, Journal of American Ceramic Society,
vol.8.pp.89-96, 1998.
[6] J.Kim, T.Kimura and T.Yamaguchi, “Sintering of Zinc Oxide Doped with Antimony Oxide and Bismuth Oxide”, Journal of American Ceramic Society, vol.72,
pp.1390-1395, 1989.
[7] C.W. Nahm, “Varistor characteristics of vanadium oxide-doped zinc oxide ceramics modified with bismuth oxide”, Journal of Materials Science: Materials in Electronics, vol.24, pp.70–78, 2013.
[8] Yaya, and D. Dodoo-Arhin, “The Influence of Bi2O3 And Sb2O3 Doping On The Microstructure And Electrical Properties Of Sintered Zinc Oxide”, ARPN
Journal of Engineering and Applied Sciences,vol.7, pp.834-842, 2012.
[9] R.S. Ali, “Structural and optical properties of nano structured bismuth oxide”, International Letters of Chemistry, Physics and Astronomy, vol.15, pp. 64-72,
2014.
[10] S.H.Chaki , M.P. Deshpande and J.P.Tailor, “Characterization of CuS nanocrystalline thin films synthesized by chemical bath deposition and dip coating techniques”, Thin Solid films, vol.550, pp.291-297, 2014.
[11] S.P Singh, R.P.S. Chakradhar, J.L. Rao and B.Karmakar, “EPR, FTIR, optical absorption and photoluminescence studies of Fe2O3 and CeO2 doped ZnO–
Bi2O3–B2O3 glasses”, Journal of Alloys and Compounds, vol. 493, pp.256–262, 2010.
[12] A.H. Hammad, M.A. Marzouk and H.A. ElBatal, “The Effects of Bi2O3 on Optical, FTIR and Thermal Properties of SrO-Bi2O3 Glasses”, Silicon, vol.8,
pp.123-131, 2016.
[13] A.Adamczyk and E.Dlugon, “The FTIR studies of gels and thin films Al2O3–TiO2 and Al2O3–TiO2–SiO2 systems”, Spectrochimica Acta, vol.89, pp.11-17,
2012.
[14] M.S. Gaafar, S.Y. Marzouk and H. Mady, “Ultrasonic and FT-IR studies on Bi2O3–Er2O3–PbO glasses”, Philosophical Magazine, vol.89, pp. 2213–2224,
2009.