64
©IJRASET: All Rights are Reserved
Identifying Miscalculation Ratio and Missing Value
of Missing Data Imputation Using DarbouX
Variate
A. Finny Belwin1, Dr. A. Kanagaraj2
1
Research Scholar, NGM College, Pollachi, 642001 2
Assistant Professor, NGM College, Pollachi, 642001
Abstract: A serious problem in mining data bases is that they are often incomplete, and a significant amount of data is missing, or erroneously entered. Missing data occur in almost all serious statistical analyses. In statistics, imputation is the process of replacing missing data with substituted values. Simple imputation is attractive and often used to impute missing data whereas multiple imputation generates right value to replace. This paper explores the use of machine-learning based alternatives to missing data in large datasets focusing on several unsupervised Machine Learning algorithms, standard statistical data completion (data imputation) methods and Supervised ML techniques for dealing with missing data. We have approached the data completion problem using two well-known supervised machine learning techniques – Booster Algorithm and DarbouX variate. The primary objective is to highlight the features on selection of suitable data imputation algorithms and also implementing Darboux’s theorem in machine learning techniques to evaluate the performance of every sequence of rational and irrational number has a monotonic subsequence. To generate the inference levels of imputation of missing data, the standard UCI repository dataset is deployed. Experimental results reveal a significant improvement of accuracy in the proposed approach. Keyword: Darboux’S Classifier, DarbouX Variate, Imputation Algorithm, Naive Bayesian Classifier, Boosting Algorithm, Supervised Machine Learning, Unsupervised Machine Learning.
I. INTRODUCTION
Missing data imputation is an actual and challenging issue confronted by machine learning and data mining. Most of the real world datasets are characterized by an unavoidable problem of incompleteness, in terms of missing values. Missing data are simply observations that we intended to be made. Missing value may generate bias and affect the quality of the supervised learning process. Missing value imputation is an efficient way to find or guess the missing values based on other information in the datasets. Data mining consists of the various technical approaches including machine learning, statistic and database system. The main goal of the data mining process is to discover knowledge from large database and transform into a human understandable format. This paper focuses on several algorithms such as missing data mechanisms, multiple imputation techniques and supervised machine learning algorithm. Experimental results are separately imputed in each real datasets and checked for accuracy. A simple technique for handling with missing value is to bring forward all the values for any pattern removed one or more info items. The major issues among here content may be decreased. Especially this is applicable although the decreased pattern content is smaller to attain momentous outcome in the study. The mechanism causing the missing data can influence the performance of both imputation and complete data methods. There are three different ways to categorize missing data. Missing Completely At Random (MCAR) point into several distinct data sets being removed are separate both of noticeable scalar and of unnoticeable argument. Missing At Random (MAR) is the alternative, suggesting that what caused the data to be missing does not depend upon the missing data itself. Not Missing At Random (NMAR) is the quantities or characters or symbols that is removed as a precise reasoning.
A. Machine Learning Approach
In machine learning, such solutions are called target or output and situations are called input or unleveled data. Situation and solution in combination it is called leveled data.
1) Supervised: So, if you are training your machine learning task for every input with corresponding target, it is called supervised learning, which will be able to provide target for any new input after sufficient training. Your learning algorithm seeks a function from inputs to the respective targets. If the targets are expressed in some classes, it is called classification problem. Alternatively, if the target space is continuous, it is called regression problem.
65
©IJRASET: All Rights are Reserved
In the data mining context, machine learning technique is generally classified as supervised and unsupervised learning technique both belong to machine learning technique. Supervised classification focus on the prediction based on known properties and the classification of unsupervised focus on commonly used classification algorithm known as Naïve Bayesian imputation techniques.
Structure of Machine Learning
a) Supervised Machine Learning Approach: Mean Imputation is the process of replacing the missing data from the available data where the instance with missing attribute belongs. Median Imputation is calculated by grouping up of data and finding average for the data. Median can be calculated by finding difference between upper and lower class boundaries of median class. Standard Deviation calculates the scatter data concerning the mean value. It can be convenient in estimating the set of fact which can possess the identical aim but a different domain. Estimate standard deviation based on sample and entire population data.
66
©IJRASET: All Rights are Reserved
II. LITERATUREREVIEW
Miroslaw Pawlak computed a number of nonparametric kernel classification rules, consistency and speed of convergence of kernel classification rules established from missing data. Prediction density approach, the deletion techniques, and stochastic mechanism of mechanism of generation of missing values can be introduced by imposing probability distribution on the variables. ShenQiping et al. described problem solving processes in value management (VM) workshop in the construction industry are experience-based, and the quality workshops depends on the experience of the team members. Experimental results show that DM techniques can help team members in VM workshops to understand the problems more clearly and to generate more information for recent issues in feasibility studies, risk analyses, resource allocation, site layout, and time/cost predictions. Jort Florent Gemmeke et al. focused effective way to increase the noise robustness of automatic speech recognition to label noisy speech features either reliable or unreliable and to replace the missing data by clean speech estimates. Little and Rubin summarize the mechanism of imputation method. Also introduces mean imputation method to find out missing values. The drawbacks of mean imputation are sample size is overestimated, variance is underestimated, correlation is negatively biased. For median and standard deviation also replacing all missing records with a single value will deflate the variance and artificially inflate the significance of any statistical tests based on it. Different types of machine learning techniques are supervised and unsupervised machine learning techniques summarized in. Damian Dechev et al., exploited the parallelism in multiprocessor systems is a major challenge in modern computer science. In this paper, the author presented the vision for the theory and practice for the design and implementation of a collection of highly concurrent fundamental data structures for multiprocessor application development with associated programming interface and advanced optimization support. Ingunn Myrtveit et al, analyzed in data sets used to construct effort prediction models in an empirical evaluation of imputation methods and Likelihood-based methods. The evaluation suggested full information maximum likelihood (FIML) is appropriate when the data are not missing completely at random (MCAR) compared with four missing data techniques (MDTs) like listwise deletion (LD), Mean imputation (MI), similar response pattern imputation (SRPI), and full information maximum likelihood (FIML) seem appropriate only if the resulting LD data set is too small to enable the construction of a meaningful regression-based prediction model. Educational researchers have become increasingly aware of the problems and biases which caused by missing data. Multiple imputation is not implemented by many researchers who could benefit from it, very possibly because of lack of familiarity with the technique. Therefore, the main objective of this author, to help familiarize researchers with the basic process of multiple imputation. Classification of multiple imputation and experimental analysis are described by Min Pan et al., summarize the new concept of machine learning techniques like NBI also analysis the experimental results which impute missing values. To overcome the unsupervised problem Peng Liu, Liu Lei et al. applied the supervised machine learning techniques called Naïve Bayesian Classifier. Yuri Pirola et al, introduced minimum-recombinant haplotype configuration problem (MRHC) provide highly successful in sound combinatorial formulation for genotype phasing on pedigrees. An experimental analysis demonstrated the biological soundness of the phasing model and the effectiveness of the algorithm under several context.
III. ANALYSISOFMULTIPLEIMPUTATIONMETHOD
The Multiple imputations for each missing values generated a set of possible values, each missing value is used to fill the data set, resulting in a number of representative sets of complete data set for statistical methods and statistical analysis. The main application of multiple imputation process produces more intermediate interpolation values, can use the variation between the values interpolated reflects the uncertainty that no answer, including the case of no answer to the reasons given sampling variability and non- response of the reasons for the variability caused by uncertainty. Multiple imputation simulate the distribution that well preserve the relationship between variables. It can give a lot of information for uncertainty of measuring results of a single interpolation is relatively simple.
A. Naïve Bayesian Classifier(NBC)
67
©IJRASET: All Rights are Reserved
Process of DarbouX variate
B. Darboux Theorem
The Darboux theorem states that every defined group in Rn consist of a concurrent subgroup. For instance, a subgroup is a group that can be derived from another group by deleting any items without modifying the order of the resting items. Every bounded real sequence has a convergent subsequence. A subset of R is compact if and only if it is closed and bounded. The set S is rational and countable, and treat S as a bounded sequence from 0 to 1. Then it gives the following results for each statement. There is a convergent subsequence in S. Darboux theorem require an infinite construction, and it has no exception. The infinite construction is easier than the constructions in other proof. If (Rn) is a sequence of numbers in the closed segment [M, N], then it has a subsequence
which converges to a point in [M, N]. Let’s have an arbitrary point P, which is between the points M and N. Then observe the segment [M, P]. It may contain a finite number of members from the sequence (Rn) and it may contain an infinite number of them. If
take the point P to be N, the segment [M, N] would contain an infinite number of members from the sequence.
If take the point P to be M, the segment [M, N] would contain at most only one point from the sequence. Let’s introducing the set S= {P ϵ [M, N] | [M, P] contains a finite number of (Rn) members. M belongs to set S. If a point P belongs to S, it mean that [M, P]
has a finite number of members from (Rn), and it will mean that any subset of [M, P] would also have only a finite number of
members from (Rn). Therefore for any P that belongs to S, all the point between that P and M would also belongs to S. The set S is
actually a segment, starting at M and ending in some unknown location [M, N]. Now let’s move to next step R= Sup(S) it means R is an accumulation point of (Rn). According to the special case R= M, and assume that R ϵ (M, N).Now we take an arbitrarily small
ɛ. Observe the segment [M, R+ɛ]. R+ɛ cannot belong to S since it is higher than the supremum. Hence [M, R+ɛ] contains an infinite number of (Rn) members. Now the segment [M, R-ɛ]. R-ɛ must belong to S, since it is smaller than the supremum of the segment S.
Thus [M, R-ɛ] contains a finite number of members from (Rn). But [M, R-ɛ] is a subset of [M, R+ɛ]. If the bigger set contains an
infinite number of (Rn) members and its subset contains only a finite amount, the complement of the subset must contain an infinite
number of members from (Rn). Proved that for every ɛ, the segment (R-ɛ, R+ɛ) contains an infinite number of members from the
68
©IJRASET: All Rights are Reserved
member. This theorem proof that every bounded sequence of real numbers has a convergent subsequence, every bounded sequence in Rn has a convergent subsequence and every sequence in a closed and bounded set S in Rn has a convergent subsequence.
NBC technique is one of the widely used missing data treatment methods. The basic idea of NBC is first to define the attribute to be imputed, called imputation attribute and then, to construct NBC using imputation attribute as the class attribute. Other attribute in the dataset are used as the training subset. Hence the imputation problem is becoming a classification problem. Finally, the NBC is used to estimate and replace the missing data in imputation attribute. So this paper proposes a new method based on Naïve Bayesian Classifier to handle missing data.
Bayes theorem afford a method of manipulating the rear probability P(C/X) of category from P(C) is the algorithmic probability of category, P(X) is the algorithmic probability of rear and P(X/C) is the likelihood of predictor for given category. Naïve Bayes classifier estimate that the outcome of the rate of a predictor (X) on a given category (C) is free from outside control of the point of other predictors called conditionally independent.
1) Algorithm For Posterior Probability: Construct a frequency distributions for each credit across the destination. Transform frequency distribution to likelihood distribution. Certainly adopt the help of Naïve Bayesian equation to determine the posterior likelihood for every category.
2) Zero Frequency Problem: When a credit value doesn’t exist with every category value increment 1 to the count for every aspect value category sequence.
3) Numerical Predictors: Arithmetic values need to be converting into their absolute analogue values since creating their frequency distribution. The classification with the greatest posterior likelihood is the result of the prediction.
IV. EXPERIMENTALRESULTS
Experimental datasets were carried out from the University Data set of the UCI Repository. Table1 describes the dataset with Multivariate Data Characteristics with Categorical Integer Attributes which contains 285 number of instances and 17 number of attributes about the datasets used in this paper. The main objective of the experiments conducted in this work is to analyze the classification of machine learning algorithm. Datasets without missing values are taken and few values are removed from it randomly. The rates of the missing values removed are from 5% to 25%. In these experiments, missing values are artificially imputed in different rates in different attributes.
Data Set Characteristics: Multivariate Number of Instances: 285
Attribute Characteristics: Categorical, Integer Number of Attributes: 17
[image:5.612.126.488.558.719.2]Associated Tasks: Classification Missing Values? Yes
TABLE - Dataset Used for Analysis
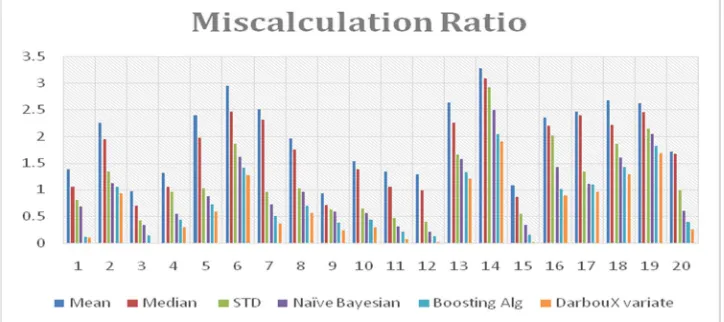
The following Figure represents the Miscalculation Ration in classification of all attribute of original dataset using supervised machine learning techniques like NB, Boosting Algorithm and Darboux Variate and unsupervised machine learning techniques like Mean, Median and STD without missing values.
69
©IJRASET: All Rights are Reserved
The below Figure 5 represents the percentage rates of missing values using both the techniques like supervised and unsupervised using missing values with the rate of 5%, 10%, 15%, 20% and 25% respectively.
Percentage Rates of Missing Values
The figure represents the comparison of both supervised techniques - NBI, Boosting Algorithm, DarbouX and unsupervised techniques - Mean, Median and Standard Deviation using missing values for all the attributes contains different rate of percentage.
V. DISCUSSION
According to the previous discussion, Bayes imputation classifier consists of 2 process. Process 1. State the imputation of element and the imputation sequence. Process 2. Apply DarbouX variate to assign missing values. For the sequence suitable approach, as stated above the imputation of element and the imputation sequence, Naïve Bayesian classifier assign the missing value in the first imputation element of the sequence and then assign the later on the altered new database. DarbouX Variate construct classification model, however it can’t be improved systemically also it can’t automatically select suitable features like boosted tree as the performance of DarbouX Variate lies on the rightness of the element selection in database. Since every imputation element, main facts of its function elements are determined. The most important drawbacks of Bayes classifier is that it has strong feature independence assumptions. Another one is if has no occurrences of a class label and a certain element value together then the frequency based probability estimate will be zero. According to conditional independence assumption, when all the probabilities are multiplied will get zero and this will affect the posterior probability estimate.
VI. CONCLUSION
70
©IJRASET: All Rights are Reserved
REFERENCES
[1] Alireza Farhangfar, Lukasz Kurgan and Witold Pedrycz, “Experimental Analysis of Methods for Imputation of Missing Values in Databases. [2] Apostol, Tom M.: Mathematical Analysis: A Modern Approach to Advanced Calculus, 2nd edition, Addison-Wesley Longman, Inc. (1974), page 112. [3] Blessie, C.E., Karthikeyan, E, Selvaraj.B. (2010): NAD – A Discretization approach for improving interdependency, Journal of Advanced Research in
Computer Science, 2910,pp.9-17.
[4] Bruckner, Andrew M: Differentiation of real functions, 2 ed, page 6, American Mathematical Society, 1994
[5] Ciesielski, Krzysztof (1997). Set theory for the working mathematician. London Mathematical Society Student Texts. 39. Cambridge: Cambridge University Press. pp. 106–111. ISBN 0-521-59441-3. Zbl 0938.03067.
[6] Damian Dechev, Pierre Laborde, and Steven D. Feldman, “LC-DC: Lockless Containers and Data Concurrency A Novel Nonblocking Container Library for Multicore Applications” IEEE Access Practical Innovations: Open Solutions Vol. 1, 2013
[7] E.Chandra Blessie, DR.E.Karthikeyan and DR.V.Thavavel, “Improving Classifier Performance by Imputing Missing Values using Discretization Method”, International Journal of Engineering Science and Technology.
[8] Enders CK. Applied Missing Data Analysis (Methodology in the Social Sciences) ISBN-13: 978-1606236390. Available from: https://www.amazon.com/Applied-Missing-Analysis-Methodology
[9] Han J. and Kamber M., Data Mining: Concepts and Techniques. San Francisco: Morgan Kaufmann Publishers, 2001. [10] HTTP Link: https://ipfs.io/ipfs/QmXoypizjW3WknFiJnKLwHCnL72vedxjQkDDP1mXWo6uco/wiki/Darboux.html [11] Ingunn Myrtveit, Erik Stensrud, “IEEE Transactions on Software Engineering”, Vol. 27, No 11, November 2001.
[12] Jeffrey C.Wayman, “Multiple Imputation for Missing Data: What is it and How Can I Use It?” Paper presented at the 2003 Annual Meeting of the American Educational Research Association, Chicago, IL, pp.2-16, 2003.
[13] Jort Florent Gemmeke, Hugo Van Hamme, Bert Cranen, and Lou Boves “Compressive Sensing for Missing Data Imputation in Noise Robust Speech Recognition” IEEE Journal of Selected Topics in Signal Processing, Vol. 4, No. 2, April 2010
[14] K. Lakshminarayan, S. A. Harp, and T. Samad, “Imputation of Missing Data in Industrial Databases”, Applied Intelligence, vol 11, pp., 259-275, 1999. [15] K.Raja, G.Tholkappia Arasu, Chitra S.Nair, “Imputation Framework for missing value” International Journal of Computer Trends and Technology-Volume3
Issue2-2012.
[16] Kamakshi Lakshminarayan, Steven A. Harp, Robert Goldman and Tariq Samad, “Imputation of Missing Data Using Machine Learning Techinques”, from KDD-96 Proceedings.
[17] Lim Eng Aik and Zarita Zainuddin, “A Comparative Study of Missing Value Estimation Methods: Which Method Performs Better?” 2008 International Conference on Electronic Design.
[18] Link (most recent): /ipns/QmdJiuMWp2FxyaerfLrtdLF6Nr1EWpL7dPAxA9oKSPYYgV/wiki/Darboux's_theorem_(analysis).html [19] Link (this snaphost): /ipfs/QmXoypizjW3WknFiJnKLwHCnL72vedxjQkDDP1mXWo6uco/wiki/Darboux's_theorem_(analysis).html
[20] Liu P., Lei L., and Wu N., A Quantitative Study of the Effect of Missing Data in Classifiers, proceedings of CIT2005 by IEEE Computer Society Press, September 21-23,2015.
[21] Min Pan “Based on Kernel Function and Non-Parametric Multiple Imputation Algorithm to Solve the Problem of Missing Data” IEEE MSIE 2014 [22] MiroslawPawlak “Kernel Classification Rules from Missing Data” IEEE Transactions on Information Theory, Vol. 39, No.3, May 2003
[23] Olsen, Lars: A New Proof of Darboux's Theorem, Vol. 111, No. 8 (Oct., 2014) (pp. 713–715), The American Mathematical Monthly
[24] Peng Liu, Lei Lei, “Missing Data Treatment Methods and NBI Model”, Sixth International Conference on Intelligent Systems Design and Applications, 0-7695-2528-8/06.
[25] R. Kavitha Kumar and Dr. R. M. Chandrasekar, “Missing Data Imputation in Cardiac data set”.
[26] R. Malarvizhi, Dr. Antony Selvadoss Thanamani, “K-Nearest Neighbor in Missing Data Imputation”, International Journal of Engineering Research and Development, Volume 5 Issue 1-November-2015.
[27] R.J. Little and D. B. Rubin. Statistical Analysis with missing Data, John Wiley and Sons, New York, 2007.
[28] R.S. Somasundaram, R. Nedunchezhian, “Evaluation on Three simple Imputation Methods for Enhancing Preprocessing of Data with Missing Values”, International Journal of Computer Applications, Vol21-No. 10, May 2017, pp14-19.
[29] S.Hichao Zhang, Jilian Zhang, Xiaofeng Zhu, Yongsong Qin, Chengqi Zhang, “Missing Value Imputation Based on Data Clustering”, Springer-Verlag Berlin, Heidelberg,2016.
[30] Shen Qiping, GuoJianfeng, Zhang Jianping, and Liu Guiwen, “Using Data Mining Techniques to Support Value Management Workshops in Construction” TSINGHUA Science and Technology ISSN 1007-0214 13/20 pp 191-201 Vol. 13, No. 2, April 2016