CENTRAL NERVOUS FUNCTION AND CHANGES IN
BRAIN METABOLITE CONCENTRATION
I. GLYCOGEN AND LACTATE IN CONVULSING MICE
BY M. R. A. CHANCE AND D. C. YAXLEY Pharmacology Department, University of Birmingham
{Received 31 March 1950)
(With Three Text-figures)
INTRODUCTION
For some time it has been known that the alteration of central nervous activity by various experimental procedures is accompanied by changes in the concentration of brain metabolites. The significance of earlier work in this field is discussed later in relation to the observations reported here. It may be noted, however, that the investigators have used a variety of techniques, and some of their results will have to be reconsidered in the light of improved methods of extraction.
METHODS Extraction
Samples in which the concentration of biochemical substances are to be estimated are usually now dropped alive into liquid air and are thus instantly frozen solid, after which the sample requires careful dissection. This method, however, is time-consuming, and in view of the large number of samples required by subsequent investigations, a method was devised for the rapid extraction of different parts of the living brain so that they could be transferred directly to the extraction fluid.
i H 2 3 4 Time of removal (in tnin.)
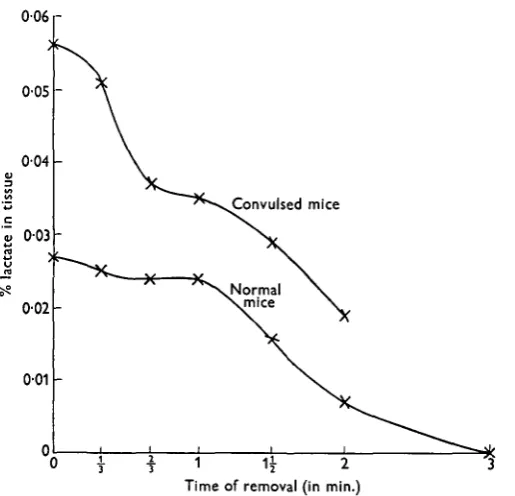
Fig. i. Rate of loss of glycogen following circular-saw extraction of brain from normal and convulsed mice.
of loss of glycogen and Fig. 2 of lactate in the mouse cortex following this procedure. From these it will be seen that samples removed during 30 sec. following execution retain the full amount of glycogen in animals which have not been convulsed, but
Convulsed mice
006
0 0 5
004
0 0 3
0 0 2
001
[image:3.451.101.359.125.373.2]-1 -1* 2 Time of removal (in min.)
Fig. 2. Rate of loss of lactate following circular-saw extraction of brain from normal and convulsed mice.
Table 1. Effect of method extraction on percentage increment
1 of glycogen in convulsed mouse brain Means in heavy type.
Area
Cortex
Mid-brain
Medulla
Drug
Picrotoxin Amphetamine Metrazol Picrotoxin Amphetamine Metrazol Picrotoxin Amphetamine Metrazol
Dropped into liquid air
86 86 69 86 39 16
S3 85 49 64
88 89 88 87 7° 71 85 85 39 4° 16 JS 52 S3 84 86 48 5° 63 62
87 7 0 85 39
16
53 85 49 63
S.D.
0 6 6
Circular-saw extraction
74
6 4 82
37
1 2
49 8 0 4 3
58
80
63
8 0
35
13 4 9 82
45 59
83
62
76
35 14 5O
84 46
6 1
79 63 79 36
13
49
8 2
45
6 0 S.D.
3-o
Diff.
8
7 6 3 3
4
3
4
3
[image:3.451.44.410.452.574.2]in rate of loss of glycogen following procedures which increased the amounts of this metabolite in the brain, it was decided to check the validity of this assumption for the different parts of the brain following an increase of glycogen (Table i).
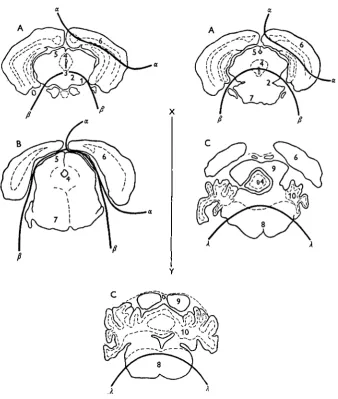
Fig. 3. Approximate anatomical limits of the three brain samples.
KEY. 1, substantia nigra; 2, red nucleus; 3, oculomotor nucleus; 4, central grey matter of the mid-brain; 5, superior colliculus; 6, cortex; 7, pons; 8, medulla; 9, inferior colliculus; io, cerebellum. A, transverse sections mesencephalic region; B, transverse section metencephalic region; C, transverse sections myelencephalic region, a—a, cortical sample; /?—/?, mid-brain sample; A—A, medullary sample; X—Y, plane of transverse section across the head.
then be sampled directly from the cut surface with a nickel spatula. The spinal cord can be sucked out by means of a glass capillary tube from the point where the head was severed from the body. The approximate limits of the regions sampled are shown in the figures of transverse sections of the mouse brain (Fig. 3).
These samples are transferred with their spatula or blown from the capillary tube directly into the extraction fluid in a previously weighed test-tube. On reweighing the weight of the sample is found by difference.
Estimation
Glycogen. The method of Kerr (1936), modified to increase the specificity of the method for estimating the reducing value, was used. The Schaffer-Hartmann method replaced the Somogyi method for the determination of reducing value, and the end-point was obtained with a sodium starch glycolate indicator according to the method of Bourne, Peat & Thrower (1947). Standard amounts of glucose were added from freshly prepared solutions of analar glucose when the sugar in excep-tionally small quantities of brain tissue were estimated. By this means the reducing value could be brought on to the appropriate region of the curve for accurate estima-tion. The smallest quantity estimated by this method was 20 /xg. The substance extracted and estimated was identified as glycogen by the following properties: acid hydrolysis, 76-5%; amylase hydrolysis, 39-1 %; iodine brownish red; % yeast fermentable in convulsed brain, 97-2; % yeast fermentable in normal brain, 97-3. Lactate. The method of Hawk et al. (1947) was used without alteration. The smallest quantity estimated by this method is 2 /xg.
Experimental procedure
Convulsions can be induced in animals by either of two methods: (i) extrinsic methods involving the application of abnormal stimuli to normal animals, and (ii) intrinsic methods in which strains of animals with idiopathic susceptibility to seizures are subjected to normal precipitating stimuli. Both these methods have been studied. The extrinsic stimuli include electrical stimulation of the central nervous system by electrodes placed on the skull and on regions of the body close to the spinal cord, oxygen lack, and the action of drugs.
316 M. R. A. CHANCE AND D. C. YAXLEY
RESULTS
The normal values for the different regions of the brain obtained were in mg./ioo g.
Cortex Mid-brain Medulla
Glycogen
7 5 27-5 17-4
S.D.
±0-38 ±°'49 ±0-56
No of. samples
22 22 22
Lactate
26
3°
35
S.D.
± 0 6 6 ± 0 6 0 ±O-57
No. of samples
12
9 9
Increments of glycogen following convulsions induced by drugs (reported later) could be detected up to 40 min. after the end of the convulsion in animals killed after varying intervals of time. Approximately half the initial rise was present after 20 min. We have, therefore, made all estimations within a minute of the end of the convulsion.
Changes in lactate and glycogen under extrinsic stimuli
Stimulation by oxygen lack. The animal under test was placed in a small 250 c.c. bottle from which there was an inlet and an outlet through the rubber bung. In the first experiment nitrogen alone was passed over the animals, until after a few minutes apnoea developed and the animals died quietly. This procedure produced no alteration in the glycogen concentration, but a slight rise in lactate, as will be seen from Table 2. In the second experiment, the respiration was stimulated by the
Table 2. Percentage increment of glycogen and lactate in
mouse cortex during oxygen lack Means in heavy type.
Procedure
7 parts nitrogen, 1 part carbon dioxide
Nitrogen only
Pre-convulsive
Pre-convulsive symptoms
Escape behaviour followed by rapid shallow breathing Dyspnoea to respiratory arrest
Glycogen
0 0 1 0
1 0 0 1
Lactate
19 23 18 3i
15 12
7 15
Post-convulsive Duration
of convulsions
(sec.) 6
2 x 20 10
Glycogen
28 27 25 29
Lactate
58 71 86 69
Stimulation by drugs. In this experiment subconvulsive and convulsive levels of a number of different central nervous stimulants were used to investigate the relation-ship between convulsive seizures and changes in glycogen and lactate concentration. The dose used for the subconvulsive stimulation was two-thirds of the E.D.50.* For the convulsive stimulation the E.D. 50 of the particular drug was chosen. As in the earlier experiment subconvulsive stimulation had little or no effect on the glyco-gen level except in the case of amphetamine, where a 4% increase was recorded; but this is not statistically significant. Here again changes in lactate accompanied both levels of stimulation (Table 3).
Table 3. Percentage increment of glycogen and lactate in mouse
cortex during stimulation by drugs Means in heavy type.
Drug
Picrotoxin
Metrazol
Amphetamine sulphate
Nikethamide
Dose i.v. (mg./kg.) i - 6
3 2
4 0
32
Sub-convulsive
Glycogen
- 7
4
- 4
0
6 3 4 7
1 3 7 0
4 7
6
1
— 1
0
3
4
2
Lactate
3
1 7
- 3
1 1 1 7 2 0 IS 19 2 4
I I
7
2 4
6
16
19
14
Dose i.v. (mg./kg.) 2-S
5°
6 0
S°
Convulsive
Glycogen
74
8 0
83
82 80
76 64 63
62
72
76 76
79
79
63
74
Lactate
49 26 56 28 34
2 2 3°
43
2 0
3 i
34 44
44
28
3 1
36
Electrical stimulation. A 50-cycle current, the voltage of which was controlled by a variable transformer, was obtained by tapping the mains. The voltage and the current were measured simultaneously, and the electrodes were a copper bar in the mouth and a metal saline pad applied to the parietal and occipital regions of the head. In these experiments the voltage required for different animals was different according to the resistance of the animal and the contact which was made between the electrodes and the head. By variation either of the input or the degree of contact the current could be controlled. In Table 4, a number of different experiments were performed in order to obtain currents having three effects. When the lowest current was put into the animal by stimulation with 7-5 V., the animal struggled for 6 sec, then between 6 and 12 sec. tetany was induced with this voltage. Tetany was also maintained for 10 sec. by 5 V. in another experiment. In both these circumstances
there was no change in glycogen concentration, although small changes in lactate occurred during struggling. These were greater during tetany.
Table 4. Percentage increment of glycogen and lactate in mouse cortex
during electrical stimulation through the head
50 cycles a.c. electrodes through mouth and on parietal region of head. Means in heavy type.
Nature of response 20 V. producing i sec.
tetany and 5-6 sec. con-vulsion
5 V. producing tetany for 10 sec.
7-5 V.; mouse struggles for 6 sec. and passes into tetany for a further 5 sec, and after re-moval of the electrodes at 14 sec. has a 5-6 sec. convulsion Sec. after stim. 6 1 2 2 0 Pre-convulsive mA. 2 0 26 32 25 26 3 0 1 2 13 15 IO 15 IO Glycogen 1 0 1 0 0 0 0 I 1 0 — 1 0 5 3 3 j mA. 2 2 2 8 3° 8 1 0 11 10 11 16 Lactate 3 a 1 19 20 2 3 17 15 12 3 18 29 26 29 21 Convulsive mA. 39 46 52 1 4 16 17 Glycogen 54 55 55 57 86 77 73 73 mA. 52 56 58 1 2 1 2 13 Lactate 19 26 26 34 56 43 33 4 0
A large increase in glycogen, however, occurred as soon as the current reached a sufficiently high value or was maintained long enough to obtain a clonic convulsion on removal of the electrodes. In these circumstances also the lactate rose to the highest value.
Tables 2, 3 and 4 show, therefore, that subconvulsive intensities of any extrinsic stimulus, whether by electrical stimulation, the action of drugs or oxygen lack, produce a slight but statistically significant increase of lactate, without a significant change in the amount of glycogen. When convulsions are precipitated by these means, however, there is usually a small further increment in lactate and the amount of glycogen rises sharply. A point of interest about these results is the constancy in the amount of glycogen which accumulates after any particular method of pre-cipitating a convulsion, whereas the change in lactate is more variable.
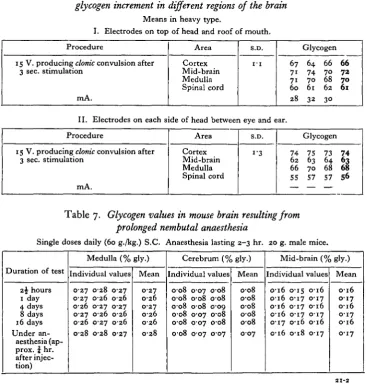
Table 5. Percentage glycogen increment in mouse brain and severity of convulsions Electrodes on top of head and along spinal column-.
Means in heavy type. Procedure
20 V. producing tonic convulsion after 3 sec. stimulation
mA,
15 V. producing clonic convulsion after 3 sec. stimulation
mA. Area Cortex Mid-brain Medulla Spinal cord Cortex Mid-brain Medulla Spinal cord S.D. i-8 i"5 61 72 67 80 4 0 57 64 58 8 0 32 Glycogen 62 70 7 0 82 32 54 6 2 63 79 31 6 0 68 64 85 37 58 63 61 77 33 61 7 0 67 82 S6 63 6 1 79
Table 6. Electrical stimulation. Position of electrodes and percentage
glycogen increment in different regions of the brain
Means in heavy type.
I. Electrodes on top of head and roof of mouth. Procedure
15 V. producing clonic convulsion after 3 sec. stimulation
mA. Area Cortex Mid-brain Medulla Spinal cord S.D.
I - I
Glycogen 67 64 66 66
71 74 70 72 71 70 68 70 60 61 62 61 28 32 30
II. Electrodes on each side of head between eye and ear. Procedure
15 V. producing clonic convulsion after 3 sec. stimulation
mA. Area Cortex Mid-brain Medulla Spinal cord S.D. 1-3 74 62 66 55 — Glycogen 75 73 63 64 70 68 57 57 — — 74
u
56Table 7. Glycogen values in mouse brain resulting from
prolonged nembutal anaesthesia
Single doses daily (60 g./kg.) S.C. Anaesthesia lasting 2-3 hr. 20 g. male mice.
Duration of test 2$ hours 1 day 4 days 8 days :6 days Under an-aesthesia (ap-prox. % hr. after injec-tion)
Medulla (% Individual values
0 2 7
0-27 0-26 0-27
0 2 6
0-28
0 2 8
0-26 0-27 0-26
c-27 0 2 8
0-27
0 2 6
0-27
C 2 6 0 2 6 c-27
gly.) Mean
0 2 7
0-26 0-27 0-26
C 2 6 c-28
Cerebrum (% gly.) Individual
0 0 8
0-08 0-08
0 0 8 c-08 0 0 8
0-07 0-08
0 0 8
0-07 0-07 0-07
values 0 0 8 0 0 8
0-09 0-08 c-08 0-07 Mean 0-08 0-08 0-08 c-08 c-08 0-07 Mid-brain (% Individual 0-16 0-16 0-16 O'i6 0-17 c-16 o-is 0-17 0-17 0-17 c-16 c-18 values c-16 0-17
o-i6
0 1 7
0-16 0-17
, gly.) Mean
c-16 0 1 7
o-i6
0 1 7
[image:9.451.43.411.257.644.2]head would be expected to produce correspondingly greater increases in those regions close to the electrodes. This is shown in Table 6. The absence of any change in glycogen under nembutal anaesthesia or after prolonged periods of depression produced by this drug is shown in Table 7.
Changes in glycogen and lactate under intrinsic stimuli
As described in an earlier publication (Chance & Yaxley, 1949), the j ingling of metal tubes induced escape reactions in animals of the strain of Peromyscus susceptible to seizures. First of all the animal rushed about in the container in a controlled manner, then it crouched and finally it passed into a phase of uncontrolled running which inevitably terminated in a clonic or tonic seizure. This happened in immature animals for a period of approximately 2 months from the time of weaning and ceased, first of all, by the suppression of the terminal convulsions, at about maturity. In view of the findings of the previous section, which showed that only when extrinsic stimuli were of sufficient intensity to produce convulsions was there any change in the glycogen level of the brain it was thought worth while investigating the effect of precipitating stimuli on the brain glycogen of non-susceptible and susceptible animals of the strain of Peromyscus. Accordingly, the glycogen level was estimated in the mid-brain, cortex and medulla of the young unstimulated Peromyscus, and in litter-mates subjected to audiogenic stimulation to the point of convulsions. All the animals of the litter had on the previous day shown the typical sequence of behaviour described above, ending in clonic convulsions followed by periods of automatism lasting between 15 and 40 sec. The same pattern was repeated by the animals on the day when the estimation of glycogen was made within a minute of the end of the con-vulsion and approximately 30 sec. after the end of automatism, in three litter-mates.
Table 8. Glycogen values in Peromyscus brain under intrinsic stimulation
Unstimulated Mean Stimulated
Mean
% change of stimulated over unstimulated
No. of animals
2
3
Young readers
Cortex
0 1 1 0 0 1 2 6 o-n8
0-216 02IO O22I 0-216
+ 75
Mid-brain
0-185
O-2OO O I 9 2
O24O O-28O O-23O O25O
+ 3O
Medulla
0-320
°-3°5
0-312
0-560 0-520 0540 0540
+ 73
No. of animals
2
2
Old non-reacters
Cortex
0082 0-078 0-080
0-094 0097
0095
+ 18
Mid-brain
0-185 0 1 8 0 0-183
0-167
0-140
O-I53
- 1 6
Medulla
0-275 0-285 0-280
0-280 0-291
0285
+ 2
brain. This is the only instance we have found of alteration in glycogen level without accompanying signs of convulsions in the overt behaviour of the animals.
Momentary loss of support produced by suspending the H.C. mice by their tails and gently shaking them produced the typical convulsions described elsewhere. An increase in glycogen was found in the medulla and cortex and a slight increase in the mid-brain, but no increase occurred when the mice were shaken by the tail for a short period without precipitating a convulsion. Increases in lactate also occurred in these three regions during the convulsions (Table 9).
Table 9. Glycogen and lactate values for H.C. mice brain under intrinsic stimulation
Normal Mean
Held by tail and shaken without con-vulsion
Mean
Held by tail and shaken till convulsed Mean
% increment of con-vulsed over normal
No. of animals
2
2
2
Glycogen
Cortex
0-078 0-076 0-077
0 0 7 5 0 0 7 6
0-076
0 1 2 8 O-I34 0-131
+ 70
Mid-brain
0-190 0-180 0-185
0-190 °-i95
0-192
0-206 0-195
o-zoo
+ 8
Medulla
0-200 O'22O
O-2IO
O-22O
0 2 3 0
O-225
O-345
0-310
0-328
+ 56
Lactate
Cortex
0-027 0023 0025
0-031 0-033 0-032
+ 27
Mid-brain
0030 0026 0-028
0-032 0-035 0034
+ 19
Medulla
0-037 0 0 3 9 0-038
0-042 0-045 0-044
+ 15
DISCUSSION
concentrated in the latter part of the investigations on estimations of this sub-stance.
Except for the work of Kerr & Ghantus (1936) and Chesler & Himwich (1943), it is impossible to compare our results with the figures obtained by other workers. Until the publication of Kerr's paper in 1936 the methods used for extraction were unreliable because they involved long periods elapsing between the death of the animal and the extraction of the tissue (Holmes, 1926; Kobori, 1926; Takahashi, 1924, 1925; and Winterstein & Hirchberg, 1925). There is the added complication that none of them have worked with mice.
Uchida (1926) and Kojima (1927) give sufficient details of their methods of extraction to suggest that they obtained their material from rats and rabbits within a minute or two of the animal's death, though no precise information on this is given. The values obtained by them are of the same order as those obtained by Kerr & Ghantus for dogs and rabbits, but in view of the rapid loss we have found in mice, following removal from the animal, their results, though suggestive, are inconclusive. Anaesthetization by itself would not appear to be a barrier in the way of obtaining normal glycogen levels since the values reported by Kerr and his colleagues who anaesthetized cats and dogs agree substantially with those we have obtained in mice and which were also found for rats and mice by Neiman (1936). From these com-parisons we may infer that a large number of vertebrates normally possess between 10 and 30 mg. of glycogen per 100 g. of brain tissue, though as Kerr & Ghantus (1936) and Neiman (1936), as well as our own findings, demonstrate the exact amount in different parts of the brain of the same species show consistent differences; one part of the brain possessing as much as two or three times another.
On the other hand, it is quite possible that as anaesthesia seriously interferes with central nervous function it thus alters the effect of various procedures on the glyco-gen level of this tissue. For this reason it is not perhaps surprising that an increase of glycogen following convulsions has not previously been demonstrated. In parti-cular, the work of Kerr & Ghantus (1936) and Klein & Olsen (1947) is unreliable in this respect because of their use of anaesthetics. The convulsions in each instance were induced in anaesthetized animals.
We have not been able to find conditions which will put up the amount of glycogen in the brain by more than 100%. Chesler & Himwich (1943) recommend the use of iodo acetate injections as a means of determining the glycogen concentration in situ. This method, however, gives a loss of some 25 % in the brain glycogen in comparison with liquid air extraction and is therefore not sufficiently reliable for use in studying differences in the accumulation of glycogen in different parts of the central nervous system. On the other hand, the use of a circular saw, such as we have found satisfactory for estimations of samples of mouse brain, may prove impractible for larger animals. While the loss of glycogen obtained in this way is sufficiently small to allow comparisons of changes in different parts of the brain, it is our opinion that new methods should always be checked against extraction after freezing in liquid air, before the reliability of any procedure can be assessed.
glycogen in the H.C. strain of mice. In this respect they show the same character-istics as normal animals receiving extrinsic stimulation. The convulsion in the strain either appears or is absent, and the glycogen level follows the same pattern. The glycogen appears to be more labile in the audiogenic strain of Peromyscus; in these animals the convulsion is the terminal state of a progressive disturbance of behaviour. This may indicate the presence of convulsive autonomic discharges, which are not visible, or, alternatively, a residual susceptibility to convulsive discharge may exist in the older mice which is prevented from disturbing their behaviour by compensatory nervous pathways. The significance of the fall in glycogen in the mid-brain of these older animals is, however, still obscure.
SUMMARY
The content of glycogen and lactate in mouse brain has been estimated after a new extraction procedure which has been demonstrated to involve only a slight loss in amount of these two metabolites in comparison with extraction following freezing in situ. Five different methods of precipitating convulsions produced increases in the amount of lactate concentration at both subconvulsive and convulsive levels, but glycogen increased appreciably only when these methods produced a convulsion. It is concluded that glycogen increase in the mouse brain is specifically related to the occurrence of epileptic discharge in the brain. This increase has been shown to occur in all parts of the brain, though in varying degrees. Previous studies on these brain metabolites are discussed in the light of these results.
We are indebted to Prof. A. C. Frazer for his interest in the work, and one of us (M.R.A.C.) is indebted to Mr A. L. Bacharach for an early opportunity to explore the possibilities of this study. We should like to thank Dr E. J. Bourne for his advice on the method of extraction of glycogen, and Dr R. Gaddy for estimating the yeast fermentable reducing substance in the material extracted from the brain. We are also grateful to Mr A. E. Froggatt for the design of the high-speed rotating saws.
REFERENCES
BOURNE, E. J., PEAT, S. & THROWER, R. D. (1947). Nature, Lond., 159, 810. CHANCE, M. R. A. & YAXLEY, D. C. (1949). Behaviour, 2, parts 1-2. CHANCE, M. R. A. & YAXLEY, D. C. (1951). In preparation. CHESLER, A. & HIMWICH, H. E. (1943). Arch. Biochem. a, 175.
HAWK, P. B., OSER, B. L. & SUMMERSON, W. H. (1947). Practical Physiological Chemistry, 12th ed. Philadelphia: Blakiston.
HOLMES, E. G. (1926). Biochem. J. 20, 1196. KERR, S. E. (1936). J. Biol. Chem. 116, 1.
KERR, S. E. & GHANTUS, M. (1936). J. Biol. Chem. 116, 9. KLEIN, J. R. & OLSEN, N. S. (1947). J. Biol. Chem. 167, 747. KOBORI, B. (1926). Biochem. Z. 173, 166.
KOJIMA, Y. (1927). Biochem. Z. 190, 379.
NEIMAN, N. M. (1936). Works of 1st All Union Session of Ancologists, Kiev, p. 176. RICHTER, D. & DAWSON, R. M. C. (1948). Amer. J. Physiol. 154, no. 1.
STONE, W. E. (1938). Biochem. J. 32, 2. TAKAHASHI, K. (1924). Biochem. Z. 154, 444. TAKAHASHI, K. (1925)- Biochem. Z. 159, 484. UCHIDA, S. (1926). Biochem. Z. 167, 9.