[
46 8 ]
CENTRAL NERVOUS FUNCTION AND CHANGES IN
BRAIN METABOLITE CONCENTRATION
III. GLYCOGEN IN THE NORMAL BEHAVIOUR OF MICE
BY M. R. A. CHANCE
Department of Pharmacology, University of Birmingham
(Received 18 September 1952)
INTRODUCTION
As reported earlier (Chance & Yaxley, 1950), glycogen increments in the mouse brain are specifically related to the occurrence of convulsive discharge from the central nervous system. Also in that publication it was reported that the convulsion precipitated by shaking the H.C.* strain of mice by the tail was accompanied by glycogen increments in different parts of the brain. Subsequently, it was observed that the H.C. convulsion is identical with the posture adopted by normal mice during a fall (Chance, 1953). It was therefore considered worth while to investigate the possibility that some types of normal mouse behaviour might be accompanied by brain glycogen increments. In this respect the investigation widened the scop'e of the earlier work which was undertaken to define precisely the conditions in which changes in the concentration of brain metabolites take place in the mouse brain.
METHODS AND RESULTS
Different parts of the brain were examined since the earlier investigations had shown that the extent of the glycogen increment varies from one part of the brain to another, depending on the nature of the precipitating stimulus (Chance, 1951). Glycogen estimations were made by the method described in the earlier publi-cations (Chance & Yaxley, 1950). The description and identity of the different anatomical parts of the brain, and the values for the normal glycogen concentration of these different parts, were also published in that paper, f
Male mice weighing 20-25 g1118- °f a single strain were used throughout. The methods used for inducing the different types of behaviour in mice and the results obtained are described below.
Running
The mice were placed on a horizontal rotating disk, with a rough surface, diameter 12 in. Above the disk two fixed vertical wooden barriers were mounted. They met above the centre of the disk and lay along radii diverging at an angle of • Animals of this strain adopt a characteristic posture when lifted by the tail and momentarily lowered sharply. The posture may be maintained for 5 sec.
6o°. The gap between their ends, 7^ in. from the centre, was closed by a tangential barrier. The barriers thus confined the mouse to the periphery of the rotating disk. The disk was then rotated, slowly at first, and finally at a constant rate which, at the maximum, forced the mouse to run at a speed of 8-8 yd./min. At higher speeds the mouse fell off the edge. The figures in Table 1 show that the glycogen concen-tration remained unchanged throughout the brain, after it had run 120 yd. in 13 min.
Table 1. Running
Description of events
Six mice each forced to
run 120 yd. in 13 min.
(i.e. 8-8 yd./min.)
Mean change
Percentage change in glycogen content
Cortex
- 4 - 2
+ 1-3 + 6-7 — i-o
+ i-8
+ 4-0
+ i-4
Mid-brain
- 0 - 7
0
-03 - i s
0
+ 0-7
- 0 - 3
Medulla
0 + i-8
0 + i-6
0 0 + o-6
Swimming
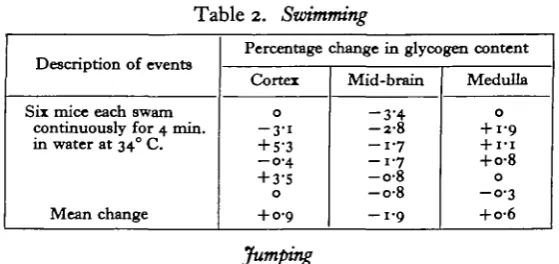
Mice swim as a reflex to immersion in water, and provided there is no point at which they can climb out, the mice 'dog paddle' continuously. In this experiment the mice were allowed to swim round an aquarium tank with vertical sides for 4 min. Earlier observations had shown that exhaustion sets in after about 6 min. No change in brain glycogen occurred (see Table 2).
Table 2. Swimming
Description of events
Six mice each swam continuously for 4 min in water at 340 C.
Mean change
Percentage change in glycogen content
Cortex
0
- 3-i + 5-3 - 0 - 4
+ 3-5
0
+ 0-9
Mid-brain
- 3 - 4
- 2 - 8 - i - 7 - i - 7 - o - 8 - o - 8 - i - 9
Medulla
0
+ 1-9 + I-I H-o-8
0
- 0 - 3 + o-6
Jumping
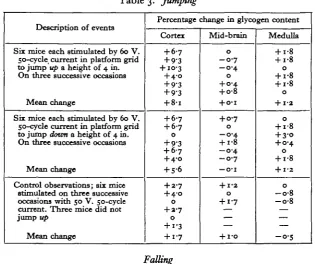
When a mouse is kept in a glass beaker it will often jump vertically up on to the edge. This behaviour can be induced by the application of an electrical stimulus to the feet of the mouse. For this purpose, a square perspex container with sides 4 in. high and with a metal grid floor was constructed with bars ^ in. apart. Alter-nate bars were connected together along one side and reached to within -fa in. of the opposite side. In this way alternate bars formed the opposite poles of an electric circuit which was connected through a tapping key to a ' variac' by means of which the voltage in the circuit could be altered. The feet of the mouse made contact with more than one bar at a time, and thus completed the circuit. By depressing the tapping key, and so closing the circuit, a short series of electrical shocks was applied to the feet, and, at a sufficiently high voltage, induced the mouse to jump up to the
[image:2.595.158.438.427.559.2]47°
[image:3.595.139.455.273.537.2]edge of the container. To induce a jump down the box was reversed on the bench so that the grid was at the top. The figures in Table 3 show that a glycogen incre-ment occurred in the cortex of all the mice which jumped up, and in five out of the six mice which jumped dozen. No change took place in the mid-brain or medulla. A control test with a just subthreshold electrical stimulus produced a slight rise in the cortex by an amount which is not statistically significant from the cortical values of the twenty-two normal mice, the mean figure for which was published earlier (Chance & Yaxley, 1950). This indicates that the cortical increment is a result of the jumps.
Table 3. Jumping
Description of events
Six mice each stimulated by 60 V. 50-cycle current in platform grid to jump up a height of 4 in. On three successive occasions
Mean change
Six mice each stimulated by 60 V. 50-cycle current in platform grid to jump down a height of 4 in. On three successive occasions
Mean change
Control observations; six mice stimulated on three successive occasions with 50 V. 50-cycle current. Three mice did not jump up
Mean change
Percentage change in glycogen content
Cortex
+ 6-7 + 9-3 + 10-3 + 4-o + 9-3 + 9-3 + 8-i
+ 6-7 + 6-7 0 + 9-3 + 67 + 4-0 + 5-6
+ 2-7 + 4-0 0
+ 3-7
0
+ i-3 + i-7
Mid-brain
0
- 0 - 7 - 0 - 4
0 + 0-4 + o-8 + O-I
+ 0-7 0
- 0 - 4 + i-8 - 0 - 4 - 0 - 7 — o-i
+ 1-2
O
+ i-7
+ I-O
Medulla
+ i-8 + i-8
0
+ i-8 + i-8
0
+ 1-2
O
+ 18 + 3-o + 0-4 0 + i-8 + 1-2
0
- o - 8 - o - 8
- 0 - 5
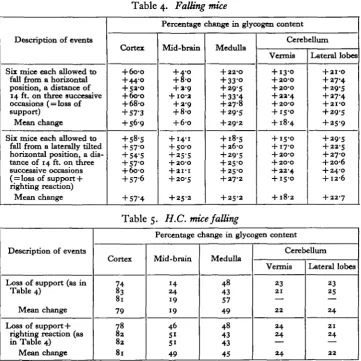
Falling
each fall was 0-7 sec. approximately. The values of the glycogen in the different parts of the brain, listed in Table 4, show that increments occur in all parts and, with the exception of the brain, are the same for the two procedures. The mid-brain increment is low following loss of support alone, and rises to approximately the same value as that in the medulla on the addition of the righting reaction. It is concluded that the mid-brain increment is a reflexion of the activity in the brain due to the righting reaction; and that, if the impact is assumed to play no part, the
Table 4. Falling mice
Description of events
Six mice each allowed to fall from a horizontal position, a distance of 14 ft. on three successive occasions ( = loss of support)
Mean change
Six mice each allowed to fall from a laterally tilted horizontal position, a dis-tance of 14 ft. on three successive occasions ( = loss of support + righting reaction)
Mean change
Percentage change in glycogen content
Cortex + 6o-o +44-0 + 52-0 + 6o-o + 68-O + 57-3 + S6-9 + 58-5 + 57-0 + 54'5 + 57-0 + 600 + 57-6 + 57-4 Mid-brain + 4-0 + 8-o + 2-9 + IO-2 + 2-9 + 8-o + 6-o + 14-1 + 50-0 + 25-5 + 2O-O + 2 I-I
+ 2O-S + 25-2 Medulla + 22-O + 33-O + 29-5 + 33-4 + 27-8 + 29-5 + 29-2 + 18-5 + 26-0 + 29-5 + 25-0 + 25-0 + 27-2 + 25-2 Cerebellum Vermis + 13-0 + 2O-O + 2O-O + 22-4 + 2O-O + 15-0 + 18-4 + 15-0 + 17-0 + 2O-O + 2O-O + 22-4 + 15-0 + 18-2 Lateral lobes + 2I-O + 27-4 + 29-5 + 27-4 + 2I-O + 29-5 + 25-9 + 29-5 + 22-S + 27-O + 2O-6 + 24-0 + 12-6 + 22-7
Description of events
Loss of support (as in Table 4)
Mean change
Loss of support + righting reaction (as in Table 4)
Mean change
Table 5. H.C. mice falling
Percentage change in glycogen content
Cortex
B
81 79 78 82 82 81 Mid-brain 14 24 19 19 46 51 51 49 Medulla 48 43 57 49 48 43 43 45 Cerebellum Vermis 23 21 22 24 24 24 Lateral lobes 23 25 24 21 24 22increments in the cortex and medulla result from brain activity associated with the falling posture. Comparison of the figures following loss of support alone with those reported in figure 9 of the earlier publication (Chance & Yaxley, 1950) for H.C. mice held by the tail and shaken show that the pattern is the same. This supports the conclusion that the cortical and medullary increments are the result of the falling posture and are not due to the stimulus of impact. Added support for this is obtained from the glycogen increments on falling, which are higher for H.C.
mice (see Table 5) than for normals (see Table 4). This difference shows that the increased responsiveness to loss of support is reflected in the amount of the glycogen increment as well as in the ease with which the falling posture is elicited.
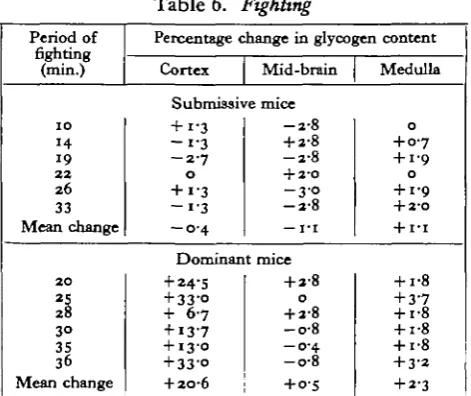
Fighting
This behaviour is shown by young adult male mice of most strains after they have been isolated for a period lasting between 3 and 6 weeks. When they are removed from their isolation boxes and are placed together into another box they start to threaten each other by rattling the tail, and will often fight for a period which rarely exceeds half an hour. The fight is terminated by one mouse offering the ' defensive posture' (Chance, 1947) to the approaches of the aggressor, and on all subsequent encounters either submitting to bites, adopting the ' defensive posture' or running away. In these circumstances, the aggressor gradually lowers the intensity of its attacks till tail-rattling replaces attacks, and finally it retires to another part of the
Period of fighting
(min.)
1 0
14 19
2 2
2 6
33
Mean change
2 0 25 28 3 0
35 36
[image:5.595.181.417.337.535.2]Mean change
Table 6. ,Fighting
Percentage change in glycogen content
Cortex Mid-brain Medulla
Submissive mice + i-3
- i - 3 - 2 - 7
0 + i-3
- 1 - 3 - O - 4
- 2 - 8
+ 2-8
- 2 - 8
+ 2-0 - 3 - o - 2 - 8 — I T
0 + 0 7 + 1-9 0 + i-9
+ 2-O
+ IT
Dominant mice + 24-5
+ 33-O
+ 6-7
+ 13-7
+ 13-0
+ 33-O
+ 2O-6
+ 2-8
O
+ 2-8
- o - 8 - 0 - 4 - o - 8
+ o-s
+ i-8 + 3-7 + i-8 + i-8 + i-8 + 3-2 + 2-3
box. Careful observation of many such encounters shows that, in most instances the mouse which finally adopts all three submissive gestures has adopted the 'defensive posture' early in the fight, but that this has not appeared (except occasionally once or twice) in the repertoire of the mouse which is finally dominant. The fight appears to persist as long as the behaviour of the ultimately submissive mouse contains retaliatory attacks in response to the aggressive advances of the more dominant animal. In respect of its role as aggressor or attacked, the behaviour of any mouse is usually consistent over the greater part of the fight.
The fight was considered to be over 5 or 10 min. after the consistent adoption of the defensive posture' by the submissive mouse had terminated attacks by the aggressor.
473
extent of the rise in the medulla, although constant, is not statistically significant (P = o-i) when comparison is made with the mean medullary value for the twenty-two normal mice already published (Chance & Yaxley, 1950).A detailed analysis of the fighting behaviour of mice is under way, but as yet it has not been possible to make any suggestions as to the components of the behaviour which are responsible for the glycogen increment in the brain of the dominant mouse.
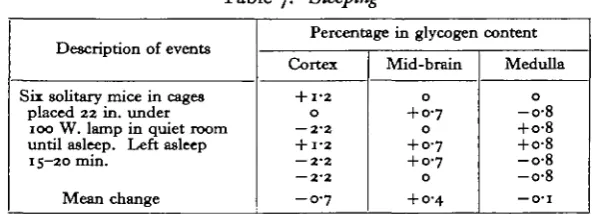
Sleeping
[image:6.595.149.447.328.435.2]Mice can be induced to sleep in quiet surroundings if placed under a bright light. Sleep is recognized by a deep regular breathing at about 120/min., and the mouse is usually lying on its side and curled up. When touched on the back once sufficiently hard to straighten the spine a small amount, it does not open its eyes or move any part of the body. It may be roused on a second touch. This test distinguishes sleep
Table 7. Sleeping
Description of events
Sir solitary mice in cages placed 22 in. under 100 W. lamp in quiet room until asleep. Left asleep 15-20 min.
Mean change
Percentage in glycogen content
Cortex
+ 1-2 O — 2-2 + 1-2 — 2-2 — 2-2
- 0 - 7
Mid-brain
0
+ 0-7
0
+ 0-7 + 0-7
0
+ 0-4
Medulla
0
-o-8 + o-8 + o-8 -o-8 -o-8
— O ' l
from resting; in the latter condition the eyes are often closed but the respiration is less regular. A single touch on the back will cause a resting mouse to open its eyes and raise its head. It may also move away. As shown in Table 7 the brain glycogen content was not altered by sleep which lasted 15 min.
SUMMARY
1. The changes in the glycogen content of different parts of the brain have been studied in mice in relation to the behaviour of these animals.
2. Increases in glycogen content have been demonstrated after a jump, a fall, after the righting reaction accompanying a fall, and after aggressive behaviour has been shown in a fight.
3. No increase has been demonstrated during sleep, after running or walking, or after defensive behaviour in a fight.
4. It was shown earlier that external stimulation must reach convulsive intensity to produce an increase in brain glycogen, and it is suggested that the particular forms of normal behaviour associated with increase in brain glycogen involve a 'convulsive' type of brain activity.
REFERENCES
CHANCE, M. R. A. (1947). A peculiar form of social behaviour induced in mice by amphetamine.
Behaviour, 1, pt. 1.
CHANCE, M. R. A. & YAXLEY, D. C. (1950). Central nervous function and changes in brain metabolite concentration. I. Glycogen and lactate in convulsing mice. J. Exp. Biol. 27, nos. 3 and 4,311-23. CHANCE, M. R. A. (1951). Central nervous function and changes in brain metabolite
concen-tration. II. Characteristic glycogen increment patterns produced by convulsant drugs. Brit.
J. Pharmacol. 6, no. 1, 1-7.