Original Article
Associations of the
APOC3
rs2854116 and rs2854117
polymorphisms with plasma APOC3 and
lipid levels: a meta-analysis
Shujin Li1, Yang Yang2, Xiaoxiao Ouyang2, Jing Shen3, Min Zhou1, Yongyan Song4
1School of Continuing Education, North Sichuan Medical College, Nanchong, P. R. China; 2School of Clinical Medicine, North Sichuan Medical College, Nanchong, P. R. China; 3Department of Nutrition and Health Sciences, University of Nebraska-Lincoln, Lincoln, Nebraska, USA; 4Department of Medical Biochemistry, School of Preclinical Medicine, North Sichuan Medical College, Nanchong, P. R. China
Received January 27, 2016; Accepted June 26, 2016; Epub August 15, 2016; Published August 30, 2016
Abstract: Studies on the associations between the apolipoprotein C3 (APOC3) gene rs2854116 and rs2854117 polymorphisms and the plasma levels of APOC3 and lipids have reported apparently conflicting findings. This meta-analysis aimed to investigate the associations of the rs2854116 and rs2854117 polymorphisms and their inter-action with fasting APOC3 and lipid levels. The following information was extracted from each study: age, gender, ethnicity, health condition, sample size, genotypes, lipid assay methods, mean and standard deviation or standard error of plasma APOC3 and lipids by genotypes. There were 23 eligible studies with 17493 subjects included in this meta-analysis. A dominant model was used for this meta-analysis. The carriers of the rs2854116 variant allele (C) had higher levels of APOC3 [standardized mean difference (SMD) = 0.08, 95% confidence interval (CI) = 0.01-0.15,
P = 0.024] and triglycerides (TG) (SMD = 0.30, 95% CI = 0.09-0.51, P = 0.004), and lower levels of high-density lipoprotein cholesterol (HDL-C) (SMD = -0.16, 95% CI = -0.31--0.02, P = 0.028) than the non-carriers. The carriers of the rs2854117 variant allele (T) had higher levels of TG (SMD = 0.24, 95% CI = 0.00-0.48, P = 0.047) than the non-carriers. No significant differences in plasma lipid levels between the wild-type homozygotes (rs2854116 TT and rs2854117 CC) and the carriers of one or more variant alleles (rs2854116 C and rs2854117 T) were detected under the dominant model. The rs2854116 polymorphism is significantly associated with higher levels of APOC3 and TG, and lower levels of HDL-C. The rs2854117 polymorphism is marginally significantly associated with higher levels of TG. Further studies are needed to elucidate the underlying mechanisms.
Keywords: Apolipoprotein C3, lipids, rs2854116, rs2854117, polymorphism
Introduction
Cardiovascular disease (CVD) remains the lead-ing cause of death for both men and women in developed and some developing countries [1]. A number of CVD risk factors have been
identi-fied in the past several decades. Among these
risk factors, dyslipidemia accounts for at least 50% of the population-attributable risk for CVD [2]. Dyslipidemia is currently characterized by
elevated levels of triglycerides (TG), total cho
-lesterol (TC) and low-density lipoprotein choles -terol (LDL-C), and/or reduced levels of high-density lipoprotein cholesterol (HDL-C). In re- cent years, many efforts have been made by researchers to investigate the genetic
polymor-phisms that influence plasma lipid levels. However, it is difficult to identify the dyslipid -emia-related polymorphisms and most associa-tions have not been replicated across studies due to various reasons.
Apolipoprotein (APO) C3 gene is a member of the APOA1/C3/A4/A5 gene cluster, which is
located within chromosome 11q23. This chro -mosomal region has been implicated in strong linkage with plasma lipid homeostasis [3]. APOC3 is an essential component of chylomi-cron and very low-density lipoprotein (VLDL), to a less extent of high-density lipoprotein (HDL).
-els. APOC3 transgenic pigs showed significantly increased plasma TG levels as compared with
nontransgenic controls [4]. In humans, hetero-zygous carriers of a null mutation (R19X) in
APOC3 express half the amount of APOC3 pres-ent in noncarriers. Mutation carriers also had
significantly lower fasting and postprandial serum TG compared with noncarriers [5]. The
results from an in vitro study [6] indicated that APOC3 was a noncompetitive inhibitor of lipo-protein lipase (LPL), which is the rate-limiting
enzyme for TG hydrolysis. Furthermore, it inter
-feres the clearance of the TG-rich lipoprotein
remnants by displacement of APOE from VLDL particles in vivo [7, 8]. Except for the important
role in TG metabolism, APOC3 also play roles in
modulating other lipid variables such as HDL-C
[9]. Given its important role in plasma lipid
homeostasis, APOC3 is generally considered as a candidate gene for dyslipidemia and atherosclerosis.
Two polymorphisms (rs2854116 and
rs2854-117) within the promoter of APOC3 have been extensively explored in terms of their associa-tions with plasma lipid levels and CVD over the
past two decades. The rs2854116 polymor
-phism is formed by a transition from T to C,
whereas the rs2854117 polymorphism is for-
med by a transition from C to T. A recent
meta-analysis [10] demonstrated that the rs2854- 116, but not the rs2854117 polymorphism, is associated with the occurrence of CVD. How- ever, whether the two polymorphisms are asso-ciated with plasma lipid levels have not been
clarified yet. Although there were a number of
studies investigating the associations of the two polymorphic loci with plasma APOC3 and
lipid levels [11-33], the results were conflicting
and inconclusive. In some of these studies, the rs2854116 polymorphism was found to be associated with higher plasma levels of APOC3
[17], TG [12, 13, 21, 22, 25, 27], TC [13] and
LDL-C [13], and lower levels of HDL-C [19-22, 27]; the rs2854117 polymorphism was associ-ated with higher plasma levels of APOC3 [25]
and TG [11, 14, 23, 25], and lower levels of
HDL-C [16, 20]. However, the results from other
studies did not support these findings. Hence,
a meta-analysis is required to clarify the rela-tionships between the two polymorphisms and plasma lipid levels.
In 2010, a study by Petersen et al. [29] report-ed that the carriers of one or more variant
alleles (rs2854116 C and rs2854117 T) had
30% increase in fasting plasma APOC3 and
60% increase in fasting TG concentration than the wild-type homozygotes (rs2854116 TT and rs2854117 CC). The carriers of variant alleles also had significantly higher prevalence of non
-alcoholic fatty liver disease (NAFLD) than the non-carriers. These findings triggered a series
of similar studies [30-33] investigating the associations between the rs2854116-rs285- 4117 interaction [i.e., wild-type homozygotes
(rs2854116 TT and rs2854117 CC) vs. the car -riers of one or more variant alleles (rs2854116
C and rs2854117 T)] and NAFLD, as well as
plasma lipid levels in different populations and ethnicities, but the results among these stud-ies were inconsistent. In this analysis, we also
pooled the data from the five studies and
intended to clarify the effects of the interaction of the two polymorphisms on plasma lipid levels.
In this paper, a meta-analysis was performed on previous reports to investigate the associa-tions of rs2854116, rs2854117 and their inter-action with APOC3 and fasting lipid levels. Our analysis results can provide the opportunity to elucidate the interrelationships among the rs2854116 and rs2854117 polymorphisms, dyslipidemia and CVD.
Materials and methods
Identification and eligibility of relevant studies
All articles published before May 2015 on the associations of the APOC3 rs2854116 and/or rs2854117 polymorphisms with plasma APOC3
and lipid levels were identified. The language
was limited to English and Chinese. A compre-hensive search of the literature was carried out by using the databases including Medline, Web
of Science, Embase and Cochrane Library. The
keywords used for the search were “apolipopro-tein C-III or apolipopro“apolipopro-tein CIII or apolipopro“apolipopro-tein C3 or APOC3 or APOC-III or APO C3” concate-nated with “polymorphism or variant or
muta-tion or SNP”. The variables of this meta-analy -sis are limited to APOC3 and the plasma lipids
APOC3 and/or at least one of the four plasma lipid variables; (3) data reported on fasting lipid variables; (4) pre-intervention baseline data were used for interventional studies. All the ref-erences cited in the included articles were
reviewed to find other published work which
was not indexed by Medline, Web of Science, Embase or Cochrane Library. Reports with incomplete data, review articles, studies based on pedigree data, case reports, abstracts and animal studies were excluded from the meta- analysis.
Data extraction
The irrelevant and overlapping studies were
excluded after being reviewed independently by two reviewers using a structured data collec-tion form. In the process of data extraccollec-tion, the original data were cross-checked and com-pared, and the disagreements were resolved by discussion. Regarding the overlapping articles, only those publications that presented the most detailed information were included. In the present meta-analysis, the data extracted from each of the included study are as followings:
first author, year of publication, ethnicity, gen -der, health condition, age, genotyping and lipid assay methods, sample size, mean APOC3 or lipid variables and SD or SE by genotypes.
Statistical analysis
The STATA software package (Version 10, Stata Corporation, College Station, TX) was used for
the meta-analysis. All data were presented as
mean ± SD in this analysis. For those articles in
which mean ± SE was given, the value of the SD was calculated. Since most of the included studies reported the results in a dominant way
[i.e., TT vs. (TC + CC) for rs2854116; CC vs. (CT + TT) for rs2854117], a dominant model was
employed in the present meta-analysis to ensure adequate statistical power. When data was presented for more than one subpopula-tion (e.g., female or male subjects, the subjects from different ethnicity) in one article, each subpopulation was treated as a separate com-parison in this meta-analysis. Subgroup analy-ses were conducted according to age, gender, ethnicity and health condition. Age subgroup
was defined as adults and children (less than 18 years of age). Ethnic subgroup was defined
as Caucasian, Asian, and the subjects of other ethnic origins. Health condition subgroup was
defined as healthy subjects, CVD patients, dia
-betic patients, etc. The subgroup analysis was
only performed with at least three comparisons to ensure adequate statistical power.
A random effects model was used for all analy-ses because both between-study and within-study heterogeneity is considered in this model.
The random effects model also provides a more conservative evaluation of the signifi
-cance of the associations than the fixed effects model [34]. The pooled standardized mean dif
-ference (SMD) and its 95% confidence interval
(CI) were used to assess the differences in APOC3 and lipids between the genotypes. Heterogeneity among studies was tested by
Cochran’s χ2-based Q-statistic at a significance
levelof P < 0.05.Galbraith plots were used to
detect the potential sources of heterogeneity, and the pooled SMD was recalculated after
removal of the outlier studies identified by the plots. The included populations were tested for Hardy-Weinberg equilibrium (HWE) by χ2 test if
available; the significance level was defined as α < 0.05. Publication bias was assessed by
Begg’s rank correlation test and Egger’s linear regression test combined with funnel plots
[35], and a significance level of 0.05 was used
to indicate the presence of potential publica-tion bias.
Results
Characteristics of the included studies
Initial search of the databases yielded 763
articles. Six hundred and fifty-eight studies
were excluded according to titles and abstracts.
Then full-text articles were retrieved and
assessed on the basis of the inclusion criteria. Eighty-two papers were ineligible for the follow-ing reasons: 64 papers did not provide com-plete data for this meta-analysis, 12 papers presented data on other polymorphisms, 4 papers had overlapping subjects with other included publications, and 2 studies were based on pedigree data. In the end, 23 studies were selected for this meta-analysis.
The characteristics of the 23 included studies
are summarized in Tables S1 and S2 of the
sup-plementary data file. Fourteen studies [11-13,
studies [11-13, 17-22, 24-27], 7 studies [13, 18, 19, 22, 24-26], 7 studies [13, 18, 19, 22, 24-26] and 11 studies [13, 16, 18- 22, 24-27] presented the data on APOC3,
TG, TC, LDL-C and
HDL-C, respectively.
Twelve studies [11,
13-16, 18-20, 23, 25, 26, 28] presented the lipid data for the rs2854117 polymor-phism by genotypes, and 4 studies [11, 13, 25, 26], 11 stud-ies [11, 13-15, 18-20, 23, 25, 26, 28], 7 studies [13, 14, 18, 19, 25, 26, 28], 6 studies [13, 18, 19, 25, 26, 28] and 9 studies [13, 16, 18- 20, 23, 25, 26, 28] of which presented the
data on APOC3, TG, TC, LDL-C and HDL-C, respectively. Five
stu-dies [29-33] present-ed the lipid data for the wild-type
homozy-gotes (rs2854116 TT
and rs2854117 CC) and the carriers of one or more variant alleles (rs2854116 C
and rs2854117 T). Of
them, 1 study [29], 5 studies [29-33], 4 studies [29, 31-33], 4 studies [29-31, 33] and 4 studies [29-31, 33] presented the
data on APOC3, TG, TC, LDL-C and HDL-C, respectively. Thirteen
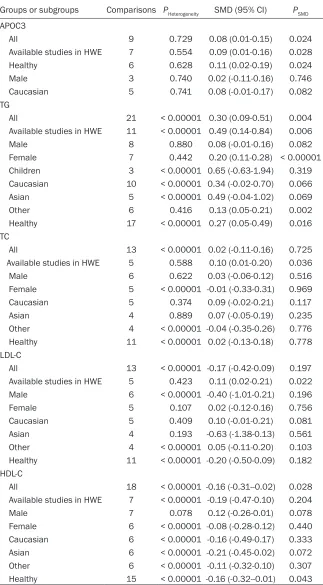
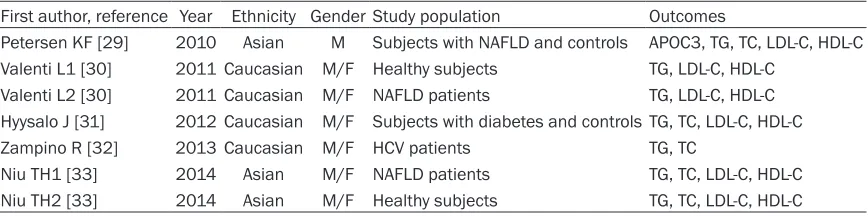
[image:4.612.91.414.97.682.2]studies [11-15, 17, 18, 21, 23, 24, 30-32], 7 studies [16, 25-29, 33] and 2 studies [19, 20] involved Cauca- sians, Asians, and Table 1. Meta-analysis of the associations between the rs2854116
polymor-phism and plasma APOC3 and lipids
Groups or subgroups Comparisons PHeterogeneity SMD (95% CI) PSMD
APOC3
All 9 0.729 0.08 (0.01-0.15) 0.024
Available studies in HWE 7 0.554 0.09 (0.01-0.16) 0.028
Healthy 6 0.628 0.11 (0.02-0.19) 0.024
Male 3 0.740 0.02 (-0.11-0.16) 0.746
Caucasian 5 0.741 0.08 (-0.01-0.17) 0.082 TG
All 21 < 0.00001 0.30 (0.09-0.51) 0.004 Available studies in HWE 11 < 0.00001 0.49 (0.14-0.84) 0.006
Male 8 0.880 0.08 (-0.01-0.16) 0.082
Female 7 0.442 0.20 (0.11-0.28) < 0.00001 Children 3 < 0.00001 0.65 (-0.63-1.94) 0.319 Caucasian 10 < 0.00001 0.34 (-0.02-0.70) 0.066 Asian 5 < 0.00001 0.49 (-0.04-1.02) 0.069
Other 6 0.416 0.13 (0.05-0.21) 0.002
Healthy 17 < 0.00001 0.27 (0.05-0.49) 0.016 TC
All 13 < 0.00001 0.02 (-0.11-0.16) 0.725 Available studies in HWE 5 0.588 0.10 (0.01-0.20) 0.036
Male 6 0.622 0.03 (-0.06-0.12) 0.516
Female 5 < 0.00001 -0.01 (-0.33-0.31) 0.969 Caucasian 5 0.374 0.09 (-0.02-0.21) 0.117
Asian 4 0.889 0.07 (-0.05-0.19) 0.235
Other 4 < 0.00001 -0.04 (-0.35-0.26) 0.776 Healthy 11 < 0.00001 0.02 (-0.13-0.18) 0.778 LDL-C
All 13 < 0.00001 -0.17 (-0.42-0.09) 0.197 Available studies in HWE 5 0.423 0.11 (0.02-0.21) 0.022 Male 6 < 0.00001 -0.40 (-1.01-0.21) 0.196
Female 5 0.107 0.02 (-0.12-0.16) 0.756
Caucasian 5 0.409 0.10 (-0.01-0.21) 0.081
Asian 4 0.193 -0.63 (-1.38-0.13) 0.561
Other 4 < 0.00001 0.05 (-0.11-0.20) 0.103 Healthy 11 < 0.00001 -0.20 (-0.50-0.09) 0.182 HDL-C
All 18 < 0.00001 -0.16 (-0.31--0.02) 0.028 Available studies in HWE 7 < 0.00001 -0.19 (-0.47-0.10) 0.204
Male 7 0.078 0.12 (-0.26-0.01) 0.078
Female 6 < 0.00001 -0.08 (-0.28-0.12) 0.440 Caucasian 6 < 0.00001 -0.16 (-0.49-0.17) 0.333 Asian 6 < 0.00001 -0.21 (-0.45-0.02) 0.072 Other 6 < 0.00001 -0.11 (-0.32-0.10) 0.307 Healthy 15 < 0.00001 -0.16 (-0.32--0.01) 0.043
APOC3: apolipoprotein C3, SMD: standardized mean difference, 95% CI: 95% confidence inter
-val, HWE: Hardy-Weinberg equilibrium, TG: triglyceride, TC: total cholesterol, LDL-C: low-density
the subjects of other ethnic origins, respective-ly. One study [22] involved all the ethnicities including Caucasians, Asians and the subjects
of other ethnic origins. Two studies [18, 29]
Twenty-four comparisons, 17 comparisons and
7 comparisons were respectively distinguished for rs2854116, rs2854117 and their
[image:5.612.90.393.97.630.2]interac-tion [Wild-type homozygotes (rs2854116 TT
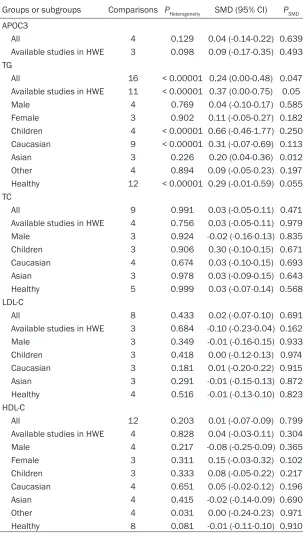
Table 2. Meta-analysis of the associations between the rs2854117 polymorphism and plasma APOC3 and lipids
Groups or subgroups Comparisons PHeterogeneity SMD (95% CI) PSMD
APOC3
All 4 0.129 0.04 (-0.14-0.22) 0.639
Available studies in HWE 3 0.098 0.09 (-0.17-0.35) 0.493 TG
All 16 < 0.00001 0.24 (0.00-0.48) 0.047 Available studies in HWE 11 < 0.00001 0.37 (0.00-0.75) 0.05
Male 4 0.769 0.04 (-0.10-0.17) 0.585
Female 3 0.902 0.11 (-0.05-0.27) 0.182
Children 4 < 0.00001 0.66 (-0.46-1.77) 0.250 Caucasian 9 < 0.00001 0.31 (-0.07-0.69) 0.113
Asian 3 0.226 0.20 (0.04-0.36) 0.012
Other 4 0.894 0.09 (-0.05-0.23) 0.197
Healthy 12 < 0.00001 0.29 (-0.01-0.59) 0.055 TC
All 9 0.991 0.03 (-0.05-0.11) 0.471
Available studies in HWE 4 0.756 0.03 (-0.05-0.11) 0.979
Male 3 0.924 -0.02 (-0.16-0.13) 0.835
Children 3 0.906 0.30 (-0.10-0.15) 0.671 Caucasian 4 0.674 0.03 (-0.10-0.15) 0.693
Asian 3 0.978 0.03 (-0.09-0.15) 0.643
Healthy 5 0.999 0.03 (-0.07-0.14) 0.568 LDL-C
All 8 0.433 0.02 (-0.07-0.10) 0.691
Available studies in HWE 3 0.684 -0.10 (-0.23-0.04) 0.162
Male 3 0.349 -0.01 (-0.16-0.15) 0.933
Children 3 0.418 0.00 (-0.12-0.13) 0.974 Caucasian 3 0.181 0.01 (-0.20-0.22) 0.915 Asian 3 0.291 -0.01 (-0.15-0.13) 0.872 Healthy 4 0.516 -0.01 (-0.13-0.10) 0.823 HDL-C
All 12 0.203 0.01 (-0.07-0.09) 0.799
Available studies in HWE 4 0.828 0.04 (-0.03-0.11) 0.304
Male 4 0.217 -0.08 (-0.25-0.09) 0.365
Female 3 0.311 0.15 (-0.03-0.32) 0.102
Children 3 0.333 0.08 (-0.05-0.22) 0.217 Caucasian 4 0.651 0.05 (-0.02-0.12) 0.196 Asian 4 0.415 -0.02 (-0.14-0.09) 0.690
Other 4 0.031 0.00 (-0.24-0.23) 0.971
Healthy 8 0.081 -0.01 (-0.11-0.10) 0.910
APOC3: apolipoprotein C3, SMD: standardized mean difference, 95% CI: 95% confidence interval, HWE: Hardy-Weinberg equilibrium, TG: triglyceride, TC: total cholesterol, LDL-C:
low-density lipoprotein cholesterol, HDL-C: high-density lipoprotein cholesterol.
only involved males, and the other 21 studies in- volved both males and females, among which 6 studies [12, 13, 19, 20, 22, 24] separately pro-vided data for males and
females. Three studies
[11, 19, 28] involved chil-dren, and the rest of the included studies involved
adults. Four studies [17,
24, 26, 27] involved both the subjects with CHD and controls, but the lipid data were not separately presented. Nine studies [12, 13, 15, 19, 20, 22, 24, 30, 33] separately provided data for more than one subpopulation, and each subpopulation was treated as a sepa-rate comparison. Nine studies [11-13, 17, 18, 21, 25-27] and 8 studies [11, 14, 15, 18, 23, 25, 26, 28] presented the detailed genotype distri-bution for rs2854116 and rs2854117, respec-tively, and none of these studies deviated from HWE except one study [26] in the rs2854117
genotype distribution. The
units of APOC3 and plas-ma lipids used in the eli-gible studies included
mg/dL or mmol/L. The
complete plasma APOC3 and lipid data by geno-types can be found in
Table S3 (rs2854116),
Table S4 (rs2854117)
and Table S5 (rs2854116-rs2854117 interaction) of the supplemental data
file.
and rs2854117 CC) vs. the carriers of one or more variant alleles (rs2854116 C and rs-
2854117 T)] according to the categories such
as age, gender, ethnicity and health condition. Nine, 21, 13, 13 and 18 comparisons were respectively included to compare the
differenc-es in APOC3, TG, TC, LDL-C and HDL-C for the
rs2854116 polymorphism (Table 1). Four, 16,
9, 8 and 12 comparisons were respectively included to compare the differences in APOC3,
TG, TC, LDL-C and HDL-C for the rs2854117
polymorphism (Table 2). Seven, 5, 6 and 6 parisons were respectively included to
com-pare the differences in TG, TC, LDL-C and HDL-C
for the rs2854116-rs2854117 interaction (Table 3).
Totally, 17493 subjects were enrolled in this
meta-analysis. Of them, 8800, 8326 and 2550 subjects were enrolled in the analysis for rs2854116, rs2854117 and the
rs2854116-rs2854117 interaction, respectively. For the
rs2854116 polymorphism, 33.3% of the
sub-jects (2933 subsub-jects) have the TT genotype, and 66.7% of them (5867 subjects) have the TC or CC genotype. For the rs2854117 polymor -phism, 47.8% of the subjects (3977 subjects) have the CC genotype, and 52.2% of them
(4349 subjects) have the CT or TT genotype. For the rs2854116-rs2854117 interaction,
27.5% of the subjects (700 subjects) are the
1). No statistically significant differences in the levels of TC and LDL-C were detected between
the C carriers and the non-carriers (Table 1; Figure 1). In the available studies in HWE, the associations between the rs2854116 polymor-phism and higher levels of APOC3 (SMD = 0.09, 95% CI: 0.01-0.16, P = 0.028) and TG (SMD =
0.49, 95% CI = 0.14-0.84, P = 0.006) were also
significant (Table 1).
The subgroup analyses stratified by the charac
-teristics of the subjects were performed. The
associations between the APOC3 rs2854116 polymorphism and higher levels of APOC3 (SMD = 0.11, 95% CI = 0.02-0.19, P = 0.024)
and TG (SMD = 0.27, 95% CI = 0.05-0.49, P = 0.016), and lower levels of HDL-C (SMD = -0.16, 95% CI = -0.32--0.01, P = 0.043) were found to
be significant in healthy subjects. The signifi -cant association between the APOC3 rs285-
4116 polymorphism and higher levels of TG
was detected in females (SMD = 0.20, 95% CI = 0.11-0.28, P < 0.00001) and in the subjects from other ethnic origins (SMD = 0.13, 95% CI = 0.05-0.21, P = 0.002).
Associations of the APOC3 rs2854117 poly-morphism with APOC3 and lipid levels
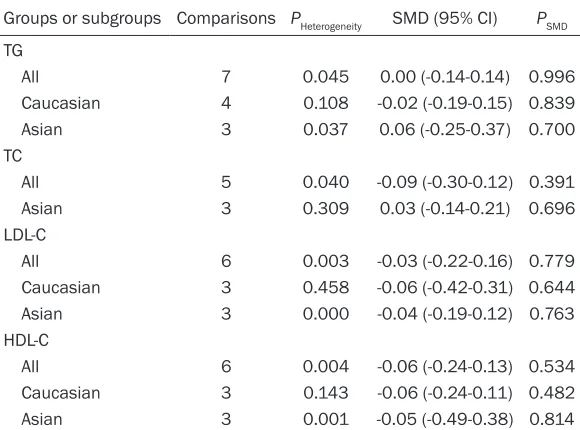
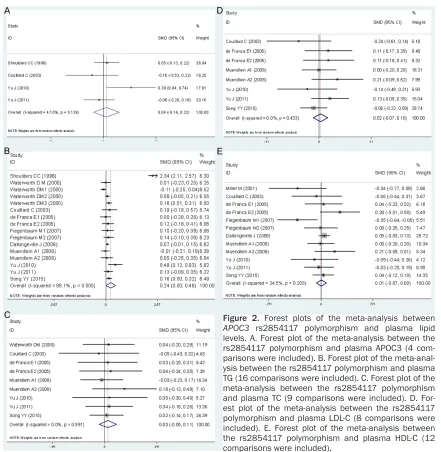
[image:6.612.91.381.98.313.2]The outcomes of the analyses on all compari -sons for the rs2854117 polymorphism showed Table 3. Meta-analysis of the associations between the
rs2854116-rs2854117 interaction and plasma lipids
Groups or subgroups Comparisons PHeterogeneity SMD (95% CI) PSMD
TG
All 7 0.045 0.00 (-0.14-0.14) 0.996
Caucasian 4 0.108 -0.02 (-0.19-0.15) 0.839 Asian 3 0.037 0.06 (-0.25-0.37) 0.700 TC
All 5 0.040 -0.09 (-0.30-0.12) 0.391 Asian 3 0.309 0.03 (-0.14-0.21) 0.696 LDL-C
All 6 0.003 -0.03 (-0.22-0.16) 0.779 Caucasian 3 0.458 -0.06 (-0.42-0.31) 0.644 Asian 3 0.000 -0.04 (-0.19-0.12) 0.763 HDL-C
All 6 0.004 -0.06 (-0.24-0.13) 0.534 Caucasian 3 0.143 -0.06 (-0.24-0.11) 0.482 Asian 3 0.001 -0.05 (-0.49-0.38) 0.814
SMD: standardized mean difference, 95% CI: 95% confidence interval, TG: triglycer
-ide, TC: total cholesterol, LDL-C: low-density lipoprotein cholesterol, HDL-C: high-densi -ty lipoprotein cholesterol.
wild-type homozygotes (rs-
2854116 TT and
rs28541-17 CC), and 72.5% of them are the carriers (1850 sub-jects) of one or more variant alleles (rs2854116 C and
rs2854117 T).
Associations of the APOC3 rs2854116 polymorphism with APOC3 and lipid levels
The outcomes of the analy -ses on all comparisons for the rs2854116 polymor-phism showed that the C carriers had higher levels of APOC3 (SMD = 0.08, 95% CI = 0.01-0.15, P = 0.024) and
TG (SMD = 0.30, 95% CI =
that the T carriers had marginally significantly higher levels of TG (SMD = 0.24, 95% CI =
[image:7.612.88.521.62.559.2]0.00-0.48, P = 0.047) than the non-carriers (Table 2; Figure 2). In the available studies in HWE, the association between the APOC3 rs2854117
polymorphism and higher levels of TG (SMD =
0.37, 95% CI = 0.00-0.75, P = 0.05) was also
marginally significant (Table 2). In the subgroup
analyses stratified by the characteristics of the subjects, no statistically significant differences
were observed for all except that the rs2854117
polymorphism was significantly associated with
higher levels of TG (SMD = 0.20, 95% CI =
0.04-0.36, P = 0.012) in Asians.
Associations of the rs2854116-rs2854117 interaction with APOC3 and lipid levels
No statistically significant differences were
detected between the wild-type homozygotes
(rs2854116 TT and rs2854117 CC) and the
carriers of one or more variant alleles (rs28-
54116 C and rs2854117 T) in either the total
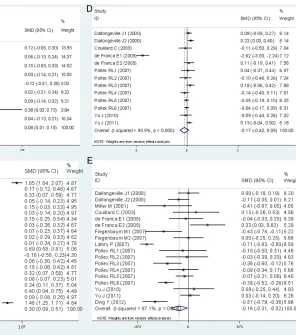
comparisons or the subgroup analyses strati-Figure 1. Forest plots of the meta-analysis between
[image:7.612.218.514.68.403.2]fied by the characteristics of the subjects (Table 3; Figure 3).
Heterogeneity analysis
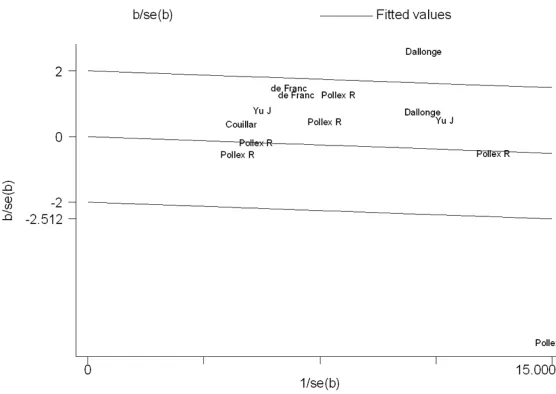
In the analyses for the rs2854116
polymor-phism, there was significant heterogeneity among the total comparisons for TG, TC, LDL-C,
and HDL-C. Seven comparisons (Shoulders CC, 1996, Dallongeville J1, 2000, Olivieri O, 2002, Lahiry P, 2007, Pollex RL5, 2007, Yu J, 2011, Ding Y, 2012), 2 comparisons (Dallongeville J2, 2000, Pollex RL6, 2007), 2 comparisons
(Dallongeville J1, 2000, de França E1, 2005)
and 6 comparisons (Dallongeville J1, 2000, de
França E2, 2005, Lahiry P, 2007, Pollex RL6,
2007, Yu J, 2011, Ding Y, 2012) were
respec-tively identified as the main contributors to the heterogeneity for TG, TC, LDL-C and HDL-C by using Galbraith plots (Figures S1, S2, S3, S4 of
the supplemental data file). The heterogeneity
was effectively removed or decreased after exclusion of these outlier studies, but the SMD values and their 95% CIs did not change
sub-stantially (TG: SMD = 0.17, 95% CI = 0.10-0.24,
PSMD < 0.00001, PHeterogeneity = 0.49; TC: SMD =
0.04, 95% CI = -0.03-0.11, PSMD = 0.244,
[image:8.612.87.528.66.518.2]PHeterogeneity = 0.875; LDL-C: SMD = 0.03, 95% CI = -0.04-0.11, PSMD = 0.427, PHeterogeneity = 0.266; HDL-C: SMD = -0.12, 95% CI = -0.21--0.03, P = 0.008, PHeterogeneity = 0.223).
Figure 2. Forest plots of the meta-analysis between
In the analyses for the rs2854117
polymor-phism, there was significant heterogeneity in the total comparison for TG, and 2 comparisons
(Shoulders CC, 1996, Waterworth DM2, 2000)
were identified as the main contributors to the heterogeneity by using Galbraith plot (Figure S5 of the supplemental data file). The heterogene -ity was effectively removed after exclusion of the two studies, but the SMD value and its 95%
CI did not change significantly (SMD = 0.10,
95% CI = 0.05-0.14, PSMD < 0.00001, PHeterogeneity
= 0.775). No significant heterogeneity was
found among the total comparisons or the
sub-group analyses for APOC3, TC, LDL-C and
HDL-C.
In the analyses for the rs2854116-rs2854117
interaction, there was significant heterogeneity among the total comparisons for TG, TC, LDL-C and HDL-C. One comparison (Petersen KF,
2010), 1 comparison (Hyysalo J, 2012), 2 com-parisons (Hyysalo J, 2012, Valenti L1, 2011)
and 2 comparisons (Niu TH1, 2014, Niu TH2, 2014) were respectively identified as the main
contributors to the heterogeneity for TG, TC, LDL-C and HDL-C by using Galbraith plots
(Figures S6, S7, S8, S9 of the supplemental
data file). The heterogeneity was effectively
removed or decreased after exclusion of these outlier studies, but the SMD values and their
95% CIs did not change significantly (TG: SMD =
-0.04, 95% CI = -0.16-0.07, PSMD = 0.457,
PHeterogeneity = 0.186; TC: SMD = -0.02, 95% CI:
-0.21-0.17, PSMD = 0.846, PHeterogeneity = 0.180; LDL-C: SMD = -0.05, 95% CI = -0.16-0.05, PSMD
= 0.318, PHeterogeneity = 0.644; HDL-C: SMD = -0.06, 95% CI = -0.20-0.08, PSMD = 0.396,
PHeterogeneity = 0.264).
Publication bias test
In the present study, Begg’s and Egger’s tests
did not find any publication bias in the
asso-ciation analyses for the rs2854116 and rs2854117 polymorphisms, and their
interac-tion. For the rs2854116 polymorphism, no pub -lication bias was detected for the analyses
[image:9.612.90.523.71.341.2]regarding APOC3, TG, TC and LDL-C. However,
Egger’s test showed that there might be a pub-lication bias in the pooling analysis for HDL-C (t
= -0.85, P = 0.045), although the Begg’s test could not demonstrate the presence of pub- lication bias (z = 1.17, P = 0.244). To clarify this problem, a trim-and-fill method was employed
to adjust the results, and no trimming was per-formed and the results were unchanged. It indi-cated that there was no publication bias for
HDL-C analysis. The significant P value of Egger’s test was originated from other factors, e.g., heterogeneity.
Discussion
The polymorphisms in or near APOC3 have been suggested to be the strongest genetic determinants of plasma lipid concentrations [36]. A substantial body of literature has inves-tigated the associations of rs2854116, rs- 2854117, and their interaction with plasma APOC3 and/or lipid levels [11-33]. Associations of these polymorphisms with increased levels
of APOC3, TG, TC and LDL-C, and/or decreased
levels of HDL-C have been reported in some,
but not all studies. The lack of consistency across the studies reflects some existed limita -tions such as small sample size and differenc-es in ethnicity and rdifferenc-esearch methodology. In the present meta-analysis, the associations of the APOC3 rs2854116 and rs2854117 poly-morphisms and their interaction with plasma APOC3 and lipid levels were investigated to clarify these discrepancies.
A dominant model was adopted in most of the
included studies, i.e., TT vs. TC + CC for the rs2854116 polymorphism; CC vs. CT + TT for the rs2854117 polymorphism. Therefore, a
dominant model was employed for both the polymorphic loci in this meta-analysis to ensure adequate statistical power. Regarding the inter-action of the rs2854116 and rs2854117
poly-morphisms, all the five included studies strati
-fied the subjects as the wild-type homozygotes (rs2854116 TT and rs2854117 CC) and the
carriers of one or more variant alleles
(rs2854116 C and rs2854117 T), so the two
groups were compared in the meta-analysis. Our results suggested that the rs2854116
polymorphism was significantly associated with higher levels of APOC3 and TG, and lower levels
of HDL-C. A meta-analysis [10] demonstrated that the rs2854116 polymorphism is
associat-ed with the risk of CVD, and which was repli-cated by another recent case-control and
meta-analysis study [37]. Taken our results
together, it is possible that the association between the rs2854116 polymorphism and
CVD is mediated by the increase of TG levels
and decrease of HDL-C levels caused by the C allele of the rs2854116 polymorphism, since
both Hypertriglyceridemia (HTG) and hypo HDL
cholesterolemia are recognized risk factors for
CVD [38]. The present meta-analysis also dem
-onstrated a marginally significant association
between the rs2854117 polymorphism and
higher levels of TG, which indicates that the
rs2854117 polymorphism may have mild effects on the expression of APOC3 since this gene has profound effects on plasma levels of
TG [39].
In the present meta-analysis, we also examined whether the interaction of the two polymor-phisms had any effects on plasma lipid levels
since a recent meta-analysis [40] has clarified its relationship with NAFLD. Our analysis did not find any significant associations between
the interaction of the two polymorphisms [i.e.,
the wild-type homozygotes (rs2854116 TT and
rs2854117 CC) vs. the carriers of one or more variant alleles (rs2854116 C and rs2854117
T)] and plasma lipid levels. One of the reasons could be that the significant effects of the
rs2854116 polymorphism on lipids have been counteracted by the rs2854117 polymorphism
which only had a weak association with TG as
our analyses demonstrated.
Subgroup analyses by gender, age, ethnicity and health condition were performed since they might be important variables in
determin-ing associative risk with dyslipidemia. For
example, the present analyses indicated that gender might modulate the association
between the rs2854116 polymorphism and TG levels since the significant association espe -cially exists in females, but not in males (Table 1). Ethnicity might modulate the associations of
the two polymorphic loci with TG levels, i.e., the significant effect of the rs2854116 polymor
-phism on TG exists in the subjects with other
ethnic origins, but not in Caucasians and Asians (Table 1), and the significant effect of the rs2854117 polymorphism on TG exists in
-ies are needed to examine the associations of
two polymorphisms with TG levels in terms of
the different effects by gender and ethnicity.
The associations of the rs2854116 polymor
-phism with plasma levels of APOC3 and TG
were very robust, which did not vary apprecia-bly when the analyses were performed only
with the available studies in HWE. The signifi -cant associations of the APOC3 rs2854116
polymorphism with plasma TC and LDL-C levels
were not detected in this meta-analysis.
However, they became significant when the
analyses were limited to the studies in HWE, which might be due to the small sample size enrolled in the analyses performed only with the available studies in HWE.
The possible mechanism under which the
rs2854116 polymorphism modulates the
plas-ma levels of APOC3, TG and HDL-C has not been clarified yet. One explanation could be
that the C allele enhances the transcriptional activity of APOC3 and leads to a higher plasma APOC3 level since the rs2854116 polymor-phism is located in the promoter of this gene. Peter et al. [41] demonstrated that the carriers of the C allele tended to have higher hepatic
APOC3 mRNA expression. In the present
analy-sis, significant higher levels of APOC3 were observed in C carriers compared with the TT
genotype subjects. Previous studies have
shown that APOC3 could increase plasma TG levels [4, 5]. Three mechanisms were consid
-ered to be involved in the elevation of TG levels by APOC3. Firstly, APOC3 promotes the assem -bly and secretion of VLDL in liver [42]. Secondly, APOC3 inhibits LPL, which is located on the inner side of capillaries and is the key enzyme
to hydrolyze TG-rich particles [6]. Thirdly, APOC3
inhibits hepatic lipase. Hepatic lipase is located on the endothelial side of liver sinusoids, and its main function is to remove the remnants of
chylomicron and VLDL. The present meta-anal
-ysis also suggested the significant association
of the rs2854116 polymorphism with lower
lev-els of HDL-C. There is a profound interrelation
-ship between the plasma levels of TG and that of HDL-C. Generally, a higher plasma level of TG
correlates with a lower level of HDL-C [38].
Significant heterogeneity was found across the analyses for rs2854116 (TG, TC, LDL-C and HDL-C), rs2854117 (TG) and their interaction (TG, TC, LDL-C and HDL-C). Subgroup analyses
stratified by the characteristics of the subjects
were performed to explore the potential sourc-es of the observed heterogeneity, and the results showed that the main sources of het-erogeneity were from ethnic origin, gender and
health condition of the subjects, etc. Galbraith
plots were employed to further evaluate the sources of heterogeneity. Outlier studies were
identified by using the plots, and the heteroge -neity was effectively removed or decreased after exclusion of these outlier studies. No
sig-nificant changes in SMD values and 95% CIs
were found after excluding the outlier studies.
The associations of the APOC3 rs2854116 and rs2854117 polymorphisms with plasma lipids were not likely to be type I errors (false-positive
results). Firstly, the results from this meta-anal -ysis were based on the random effects model.
Comparing with fixed effects model, the ran -dom effects model is a more conservative method and less likely to produce false-positive results. Secondly, 8800 subjects and 8326 subjects were respectively included in the anal-yses for the rs2854116 and rs2854117 poly-morphisms. Among the subjects, 65.7% (rs2854116) and 52.2% (rs2854117) of the subjects were respectively the carriers of the variant allele. Since the incidence of the variant
allele carriers was sufficiently high, type I error
may have been prevented for both polymorphic loci.
The present meta-analysis has several limita
-tions. Firstly, dyslipidemia is involved in a group
of genes as well as some environmental factors. However, the interactions of the rs2854116 and rs2854117 polymorphisms with the polymorphic loci on other related genes or with environmental factors on plasma APOC3 and lipid levels have not been investi-gated in this analysis due to the lack of the original data from the included studies. In other words, the more precise results could have been gained if more detailed individual data
were available or the stratification analyses
(false-negative results). Studies with larger sample size are required to further investigate
these associations. Thirdly, this meta-analysis
only included the studies published in English
and Chinese as it was very difficult to get the
full papers published in various languages. Conclusions
In conclusion, the significant associations
between the APOC3 rs2854116 polymorphism
and higher levels of APOC3 and TG, and lower
levels of HDL-C were found in the present
meta-analysis. In addition, a marginally significant
association between APOC3 rs2854117
poly-morphism and higher levels of TG were also
detected.
Acknowledgements
This research was supported by the grants
from the Basic and Applied Research Project of Sichuan Province, China (2013JY0072) and the Key Cultivation Project of North Sichuan Medical College, Sichuan Province, China (CBY12-A-ZP06).
Disclosure of conflict of interest
None.
Address correspondence to: Dr. Yongyan Song, De- partment of Medical Biochemistry, School of Preclinical Medicine, North Sichuan Medical College, Nanchong 637000, P. R. China. Tel: +86 817 3352032; E-mail: [email protected]
References
[1] Go AS, Mozaffarian D, Roger VL, Benjamin EJ, Berry JD, Borden WB, Bravata DM, Dai S, Ford ES, Fox CS, Franco S, Fullerton HJ, Gillespie C, Hailpern SM, Heit JA, Howard VJ, Huffman MD, Kissela BM, Kittner SJ, Lackland DT, Lichtman JH, Lisabeth LD, Magid D, Marcus GM, Marelli A, Matchar DB, McGuire DK, Mohler ER, Moy CS, Mussolino ME, Nichol G, Paynter NP, Schreiner PJ, Sorlie PD, Stein J, Turan TN, Virani SS, Wong ND, Woo D and Turner MB. Executive summary: heart disease and stroke statistics-2013 update: a report from the American Heart Association. Circulation 2013; 127: 143-152.
[2] Yusuf S, Hawken S, Ounpuu S, Dans T, Avezum A, Lanas F, McQueen M, Budaj A, Pais P, Varigos J and Lisheng L. Effect of potentially modifiable risk factors associated with
myocar-dial infarction in 52 countries (the INTERHE- ART study): case-control study. Lancet 2004; 364: 937-952.
[3] Bosse Y, Chagnon YC, Despres JP, Rice T, Rao DC, Bouchard C, Perusse L and Vohl MC. Genome-wide linkage scan reveals multiple susceptibility loci influencing lipid and lipopro-tein levels in the Quebec Family Study. J Lipid Res 2004; 45: 419-426.
[4] Wei J, Ouyang H, Wang Y, Pang D, Cong NX, Wang T, Leng B, Li D, Li X, Wu R, Ding Y, Gao F, Deng Y, Liu B, Li Z, Lai L, Feng H, Liu G and Deng X. Characterization of a hypertriglyceride-mic transgenic miniature pig model expressing human apolipoprotein CIII. FEBS J 2012; 279: 91-99.
[5] Pollin TI, Damcott CM, Shen H, Ott SH, Shelton J, Horenstein RB, Post W, McLenithan JC, Bielak LF, Peyser PA, Mitchell BD, Miller M, O'Connell JR and Shuldiner AR. A null mutation in human APOC3 confers a favorable plasma lipid profile and apparent cardioprotection. Science 2008; 322: 1702-1705.
[6] Wang CS, McConathy WJ, Kloer HU and Alaupovic P. Modulation of lipoprotein lipase activity by apolipoproteins. Effect of apolipo-protein C-III. J Clin Invest 1985; 75: 384-390. [7] Aalto-Setala K, Weinstock PH, Bisgaier CL, Wu
L, Smith JD and Breslow JL. Further character-ization of the metabolic properties of triglycer-ide-rich lipoproteins from human and mouse apoC-III transgenic mice. J Lipid Res 1996; 37: 1802-1811.
[8] Aalto-Setala K, Fisher EA, Chen X, Chajek-Shaul T, Hayek T, Zechner R, Walsh A, Ramakrishnan R, Ginsberg HN and Breslow JL. Mechanism of hypertriglyceridemia in human apolipoprotein (apo) CIII transgenic mice. Diminished very low density lipoprotein frac-tional catabolic rate associated with increased apo CIII and reduced apo E on the particles. J Clin Invest 1992; 90: 1889-1900.
[9] Bochem AE, van Capelleveen JC, Dallinga-Thie GM, Schimmel AW, Motazacker MM, Tietjen I, Singaraja RR, Hayden MR, Kastelein JJ, Stroes ES and Hovingh GK. Two novel mutations in apolipoprotein C3 underlie atheroprotective lipid profiles in families. Clin Genet 2014; 85: 433-440.
[10] Lin B, Huang Y, Zhang M, Wang J and Wu Y. Association between apolipoprotein C3 Sst I, T-455C, C-482T and C1100T polymorphisms and risk of coronary heart disease. BMJ Open 2014; 4: e004156.
element in Italian school children. Hum Genet 1996; 98: 557-566.
[12] Hegele RA, Connelly PW, Hanley AJ, Sun F, Harris SB and Zinman B. Common genomic variation in the APOC3 promoter associated with variation in plasma lipoproteins. Arterioscler Thromb Vasc Biol 1997; 17: 2753-2758.
[13] Dallongeville J, Meirhaeghe A, Cottel D, Fruchart JC, Amouyel P and Helbecque N. Gender related association between genetic variations of APOC-III gene and lipid and lipo-protein variables in northern France. Athero- sclerosis 2000; 150: 149-157.
[14] Waterworth DM, Hubacek JA, Pitha J, Kovar J, Poledne R, Humphries SE and Talmud PJ. Plasma levels of remnant particles are deter-mined in part by variation in the APOC3 gene insulin response element and the APOCI-APOE cluster. J Lipid Res 2000; 41: 1103-1109. [15] Waterworth DM, Talmud PJ, Bujac SR, Fisher
RM, Miller GJ and Humphries SE. Contribution of apolipoprotein C-III gene variants to determi-nation of triglyceride levels and interaction with smoking in middle-aged men. Arterioscler Thromb Vasc Biol 2000; 20: 2663-2669. [16] Miller M, Rhyne J, Khatta M, Parekh H and
Zeller K. Prevalence of the APOC3 promoter polymorphisms T-455C and C-482T in Asian-Indians. Am J Cardiol 2001; 87: 220-221, A228.
[17] Olivieri O, Stranieri C, Bassi A, Zaia B, Girelli D, Pizzolo F, Trabetti E, Cheng S, Grow MA, Pignatti PF and Corrocher R. ApoC-III gene polymor-phisms and risk of coronary artery disease. J Lipid Res 2002; 43: 1450-1457.
[18] Couillard C, Vohl MC, Engert JC, Lemieux I, Houde A, Almeras N, Prud’homme D, Nadeau A, Despres JP and Bergeron J. Effect of apoC-III gene polymorphisms on the lipoprotein-lipid profile of viscerally obese men. J Lipid Res 2003; 44: 986-993.
[19] de Franca E, Alves JG and Hutz MH. APOA1/ C3/A4 gene cluster variability and lipid levels in Brazilian children. Braz J Med Biol Res 2005; 38: 535-541.
[20] Fiegenbaum M, de Andrade FM and Hutz MH. Association between plasma lipid parameters and APOC3 genotypes in Brazilian subjects: ef-fect of gender, smoking and APOE genotypes. Clin Chim Acta 2007; 380: 175-181.
[21] Lahiry P, Ban MR, Pollex RL, Feldman RD, Sawyez CG, Huff MW, Young TK, Bjerregaard P and Hegele RA. Common variants APOC3, APOA5, APOE and PON1 are associated with variation in plasma lipoprotein traits in Greenlanders. Int J Circumpolar Health 2007; 66: 390-400.
[22] Pollex RL, Ban MR, Young TK, Bjerregaard P, Anand SS, Yusuf S, Zinman B, Harris SB, Hanley AJ, Connelly PW, Huff MW and Hegele RA. Association between the -455T>C promot-er polymorphism of the APOC3 gene and the metabolic syndrome in a multi-ethnic sample. BMC Med Genet 2007; 8: 80.
[23] Dallongeville J, Cottel D, Wagner A, Ducimetiere P, Ruidavets JB, Arveiler D, Bingham A, Ferrieres J, Amouyel P and Meirhaeghe A. The APOA5 Trp19 allele is associated with meta-bolic syndrome via its association with plasma triglycerides. BMC Med Genet 2008; 9: 84. [24] Muendlein A, Saely CH, Marte T, Schmid F,
Koch L, Rein P, Langer P, Aczel S and Drexel H. Synergistic effects of the apolipoprotein E epsi-lon3/epsilon2/epsilon4, the cholesteryl ester transfer protein TaqIB, and the apolipoprotein C3 -482 C>T polymorphisms on their associa-tion with coronary artery disease. Atheros- clerosis 2008; 199: 179-186.
[25] Yu J, Wang HM, Yang SM, Yuan J, Chen LY, Chen CL, Huang DF, Wang YG, Ju SQ and Zhu JY. The Effect of APOC3 Promoter Poly- morphisms on the Risk of Hypertriglyceridemia in Chinese Han Population With or Without Type 2 Diabetes Mellitus. Lab Med 2010; 41: 34-39.
[26] Yu J, Huang J, Liang Y, Qin B, He S, Xiao J, Wang H and Zhong R. Lack of association between apolipoprotein C3 gene polymorphisms and risk of coronary heart disease in a Han popula-tion in East China. Lipids Health Dis 2011; 10: 200.
[27] Ding Y, Zhu MA, Wang ZX, Zhu J, Feng JB and Li DS. Associations of polymorphisms in the apo-lipoprotein APOA1-C3-A5 gene cluster with acute coronary syndrome. J Biomed Biotechnol 2012; 2012: 509420.
[28] Song YY, Gong RR, Zhang Z, Li YH, Fan M, Hu MS and Fang DZ. Effects of APOC3 polymor-phisms on the plasma lipids in healthy adoles-cents with different body mass index. Sichuan Da Xue Xue Bao Yi Xue Ban 2015; 46: 65-70, 74.
[29] Petersen KF, Dufour S, Hariri A, Nelson-Williams C, Foo JN, Zhang XM, Dziura J, Lifton RP and Shulman GI. Apolipoprotein C3 gene variants in nonalcoholic fatty liver disease. N Engl J Med 2010; 362: 1082-1089.
[31] Hyysalo J, Stojkovic I, Kotronen A, Hakkarainen A, Sevastianova K, Makkonen J, Lundbom N, Rissanen A, Krauss RM, Melander O, Orho-Melander M and Yki-Jarvinen H. Genetic varia-tion in PNPLA3 but not APOC3 influences liver fat in non-alcoholic fatty liver disease. J Gastroenterol Hepatol 2012; 27: 951-956. [32] Zampino R, Coppola N, Cirillo G, Boemio A,
Pisaturo M, Marrone A, Macera M, Sagnelli E, Perrone L, Adinolfi LE and Miraglia del Giudice E. Abdominal fat interacts with PNPLA3 I148M, but not with the APOC3 variant in the patho-genesis of liver steatosis in chronic hepatitis C. J Viral Hepat 2013; 20: 517-523.
[33] Niu TH, Jiang M, Xin YN, Jiang XJ, Lin ZH and Xuan SY. Lack of association between apolipo-protein C3 gene polymorphisms and risk of nonalcoholic fatty liver disease in a Chinese Han population. World J Gastroenterol 2014; 20: 3655-3662.
[34] Fleiss JL. The statistical basis of meta-analy-sis. Stat Methods Med Res 1993; 2: 121-145. [35] Egger M, Davey Smith G, Schneider M and
Minder C. Bias in meta-analysis detected by a simple, graphical test. BMJ 1997; 315: 629-634.
[36] Adams JN, Raffield LM, Freedman BI, Langefeld CD, Ng MC, Carr JJ, Cox AJ and Bowden DW. Analysis of common and coding variants with cardiovascular disease in the Diabetes Heart Study. Cardiovasc Diabetol 2014; 13: 77. [37] Yang G, Lei MM, Yu CL, Liu XX, An Z and Song
CL. Apolipoprotein A5 and apolipoprotein C3 single nucleotide polymorphisms are correlat-ed with an increascorrelat-ed risk of coronary heart dis-ease: a case-control and meta-analysis study. Lipids Health Dis 2015; 14: 113.
[38] Third Report of the National Cholesterol Education Program (NCEP) Expert Panel on Detection, Evaluation, and Treatment of High Blood Cholesterol in Adults (Adult Treatment Panel III) final report. Circulation 2002; 106: 3143-3421.
[39] Crosby J, Peloso GM, Auer PL, Crosslin DR, Stitziel NO, Lange LA, Lu Y, Tang ZZ, Zhang H, Hindy G, Masca N, Stirrups K, Kanoni S, Do R, Jun G, Hu Y, Kang HM, Xue C, Goel A, Farrall M, Duga S, Merlini PA, Asselta R, Girelli D, Olivieri O, Martinelli N, Yin W, Reilly D, Speliotes E, Fox CS, Hveem K, Holmen OL, Nikpay M, Farlow DN, Assimes TL, Franceschini N, Robinson J, North KE, Martin LW, DePristo M, Gupta N, Escher SA, Jansson JH, Van Zuydam N, Palmer CN, Wareham N, Koch W, Meitinger T, Peters A, Lieb W, Erbel R, Konig IR, Kruppa J, Degenhardt F, Gottesman O, Bottinger EP, O’Donnell CJ, Psaty BM, Ballantyne CM, Abecasis G, Ordovas JM, Melander O, Watkins H, Orho-Melander M, Ardissino D, Loos RJ, McPherson R, Willer CJ, Erdmann J, Hall AS, Samani NJ, Deloukas P, Schunkert H, Wilson JG, Kooperberg C, Rich SS, Tracy RP, Lin DY, Altshuler D, Gabriel S, Nickerson DA, Jarvik GP, Cupples LA, Reiner AP, Boerwinkle E and Kathiresan S. Loss-of-function mutations in APOC3, triglycerides, and coronary disease. N Engl J Med 2014; 371: 22-31.
[40] Zhang H, Chen L, Xin Y, Lou Y, Liu Y and Xuan S. Apolipoprotein c3 gene polymorphisms are not a risk factor for developing non-alcoholic Fatty liver disease: a meta-analysis. Hepat Mon 2014; 14: e23100.
[41] Peter A, Kantartzis K, Machicao F, Machann J, Wagner S, Templin S, Konigsrainer I, Koni- gsrainer A, Schick F, Fritsche A, Haring HU and Stefan N. Visceral obesity modulates the im-pact of apolipoprotein C3 gene variants on liv-er fat content. Int J Obes (Lond) 2012; 36: 774-782.
Table S1. Characteristics of the studies included in the meta-analysis for the rs2854116 and rs2854117 polymorphisms
First author,
reference Polymorphisms Year Ethnicity Gender Study population Outcomes
Shoulders CC [11] rs2854116 and rs2854117 1996 Caucasian M/F Healthy children APOC3, TG
Hegele RA1 [12] rs2854116 1997 Caucasian M Healthy subjects TG
Hegele RA2 [12] rs2854116 1997 Caucasian F Healthy subjects TG
Dallongeville J1 [13] rs2854116 and rs2854117 2000 Caucasian M Healthy subjects APOC3, TG, TC, LDL-C, HDL-C
Dallongeville J2 [13] rs2854116 and rs2854117 2000 Caucasian F Healthy subjects APOC3, TG, TC, LDL-C, HDL-C
Waterworth DM [14] rs2854117 2000 Caucasian M/F Healthy subjects TG, TC
Waterworth DM1 [15] rs2854117 2000 Caucasian M/F Never smokers TG
Waterworth DM2 [15] rs2854117 2000 Caucasian M/F Exsmokers TG
Waterworth DM3 [15] rs2854117 2000 Caucasian M/F Current smokers TG
Miller M [16] rs2854116 and rs2854117 2001 Asian M/F Healthy subjects HDL-C Olivieri O [17] rs2854116 2002 Caucasian M/F Subjects with CHD and controls APOC3, TG
Couillard C [18] rs2854116 and rs2854117 2003 Caucasian M Obese subjects TG, TC, LDL-C, HDL-C de França E1 [19] rs2854116 and rs2854117 2005 Other M Healthy children TG, TC, LDL-C, HDL-C de França E2 [19] rs2854116 and rs2854117 2005 Other F Healthy children TG, TC, LDL-C, HDL-C Fiegenbaum M1 [20] rs2854116 and rs2854117 2007 Other M Healthy subjects TG, HDL-C Fiegenbaum M2 [20] rs2854116 and rs2854117 2007 Other F Healthy subjects TG, HDL-C
Lahiry P [21] rs2854116 2007 Caucasian M/F Healthy subjects TG, HDL-C
Pollex RL1 [22] rs2854116 2007 Caucasian M Healthy subjects TG, TC, LDL-C, HDL-C
Pollex RL2 [22] rs2854116 2007 Caucasian F Healthy subjects TG, TC, LDL-C, HDL-C
Pollex RL3 [22] rs2854116 2007 Asian M Healthy subjects TG, TC, LDL-C, HDL-C
Pollex RL4 [22] rs2854116 2007 Asian F Healthy subjects TG, TC, LDL-C, HDL-C
Pollex RL5 [22] rs2854116 2007 Other M Healthy subjects TG, TC, LDL-C, HDL-C
Pollex RL6 [22] rs2854116 2007 Other F Healthy subjects TG, TC, LDL-C, HDL-C
Dallongeville J [23] rs2854117 2008 Caucasian M/F Subjects without metabolic syndrome TG, HDL-C
Muendlein A1 [24] rs2854116 2008 Caucasian M Subjects with CHD and controls TG, TC, LDL-C, HDL-C
Muendlein A2 [24] rs2854116 2008 Caucasian F Subjects with CHD and controls TG, TC, LDL-C, HDL-C
Yu J [25] rs2854116 and rs2854117 2010 Asian M/F Healthy subjects APOC3, TG, TC, LDL-C, HDL-C
Yu J [26] rs2854116 and rs2854117 2011 Asian M/F Subjects with CHD and controls APOC3, TG, TC, LDL-C, HDL-C
Ding Y [27] rs2854116 2012 Asian M/F Subjects with CHD can controls TG, HDL-C
Song YY [28] rs2854117 2015 Asian M/F Healthy children TG, TC, LDL-C, HDL-C
Table S2. Characteristics of the studies included in the meta-analysis for the rs2854116-rs2854117 interaction
First author, reference Year Ethnicity GenderStudy population Outcomes
Petersen KF [29] 2010 Asian M Subjects with NAFLD and controls APOC3, TG, TC, LDL-C, HDL-C Valenti L1 [30] 2011 Caucasian M/F Healthy subjects TG, LDL-C, HDL-C
Valenti L2 [30] 2011 Caucasian M/F NAFLD patients TG, LDL-C, HDL-C Hyysalo J [31] 2012 Caucasian M/F Subjects with diabetes and controlsTG, TC, LDL-C, HDL-C Zampino R [32] 2013 Caucasian M/F HCV patients TG, TC
[image:15.612.90.524.513.621.2]Table S3. The plasma APOC3 and lipid levels according to the APOC3 rs2854116 genotypes
First author,
reference Genotype ApoC3, mg/dL TG, mmol/L TC, mmol/L LDL-C, mmol/L HDL-C, mmol/L
TT TC + CC TT TC + CC TT TC + CC TT TC + CC TT TC + CC TT TC + CC
Shoulders CC [11] 173 330 5.59 ± 1.41 5.76 ± 1.41 0.63 ± 0.02 0.68 ± 0.03 - - -
-Hegele RA1 [12] 64 156 - - 1.53 ± 0.77 1.65 ± 0.7 - - -
-Hegele RA2 [12] 83 206 - - 1.34 ± 0.84 1.6 ± 0.77 - - -
-Dallongeville J1 [13] 187 312 4.70 ± 4.20 4.98 ± 5.51 1.68 ± 1.54 1.79 ± 2.77 5.82 ± 1.08 5.88 ± 1.01 3.79 ± 1.04 3.88 ± 1.01 1.34 ± 0.37 1.34 ± 0.44 Dallongeville J2 [13] 188 320 4.00 ± 2.10 4.36 ± 2.66 1.08 ± 0.77 1.08 ± 0.77 5.71 ± 0.99 5.95 ± 1.08 3.52 ± 0.93 3.73 ± 1.00 1.72 ± 0.50 1.64 ± 0.46
Miller M [16] 24 75 - - - 1.14 ± 0.38 1.02 ± 0.26
Olivieri O [17] 206 328 11.47 ± 3.90 11.61 ± 4.10 1.79 ± 0.94 1.82 ± 1.02 - - - -Couillard C [18] 41 62 15.00 ± 3.50 14.61 ± 3.28 2.39 ± 0.91 2.55 ± 1.17 5.43 ± 0.79 5.47 ± 0.74 3.74 ± 0.68 3.66 ± 0.76 0.85 ± 0.17 0.87 ± 0.14
de França E1 [19] 64 157 - - 0.90 ± 0.40 0.91 ± 0.37 3.91 ± 0.60 4.02 ± 0.66 2.36 ± 0.51 0.91 ± 0.57 1.14 ± 0.23 1.13 ± 0.23
de França E2 [19] 63 130 - - 0.97 ± 0.45 1.00 ± 0.42 4.03 ± 0.69 4.18 ± 0.73 2.47 ± 0.56 2.54 ± 0.67 1.11 ± 0.23 1.19 ± 0.25
Fiegenbaum M1 [20] 62 115 - - 1.54 ± 0.93 1.56 ± 0.80 - - - - 1.14 ± 0.29 1.03 ± 0.24
Table S4. The plasma APOC3 and lipid levels according to the APOC3 rs2854117 genotypes
First author,
reference Genotype APOC3, mg/dL TG, mmol/L TC, mmol/L LDL-C, mmol/L HDL-C, mmol/L CC TC + TT CC TC + TT CC TC + TT CC TC + TT CC TC + TT CC TC + TT
Shoulders CC [11] 245 258 5.67 ± 1.41 5.74 ± 1.41 0.63 ± 0.02 0.69 ± 0.03 - - - -Waterworth DM [14] 117 155 - - 1.60 ± 11.36 1.68 ± 10.80 5.51 ± 1.08 5.55 ± 1.10 - - -
-Waterworth DM1 [15] 434 322 - - 1.58 ± 0.76 1.50 ± 0.71 - - -
-Waterworth DM2 [15] 549 386 - - 1.63 ± 0.86 1.70 ± 0.82 - - -
-Waterworth DM3 [15] 385 299 - - 1.70 ± 0.79 1.84 ± 0.96 - - -
-Miller M [16] 31 68 - - - 0.78 ± 0.35 0.68 ± 0.26
Couillard C [18] 60 51 15.2 ± 3.5 14.67 ± 3.17 2.43 ± 0.91 2.64 ± 1.28 5.46 ± 0.72 5.42 ± 0.77 3.74 ± 0.66 3.57 ± 0.79 0.87 ± 0.17 0.86 ± 0.15
de França E1 [19] 77 144 - - 0.91 ± 0.37 0.91 ± 0.38 3.94 ± 0.63 4.01 ± 0.65 2.40 ± 0.55 2.46 ± 0.55 1.13 ± 0.23 1.14 ± 0.24
de França E2 [19] 68 125 - - 0.96 ± 0.43 1.01 ± 0.43 4.04 ± 0.70 4.18 ± 0.73 2.47 ± 0.58 2.54 ± 0.66 1.12 ± 0.24 1.19 ± 0.25
Fiegenbaum M1 [20] 85 93 - - 1.51 ± 0.87 1.59 ± 0.81 - - - - 1.12 ± 0.27 1.03 ± 0.25
Fiegenbaum M2 [20] 122 131 - - 1.33 ± 0.73 1.44 ± 0.81 - - - - 1.22 ± 0.29 1.22 ± 0.26 Dallongeville J [23] 1148 1058 - - 1.27 ± 1.0 1.34 ± 1.0 - - - - 1.47 ± 0.4 1.49 ± 0.4 Muendlein A1 [24] 191 196 - - 2.03 ± 1.42 2.01 ± 1.30 5.56 ± 1.11 5.53 ± 1.01 3.36 ± 0.88 3.36 ± 0.85 3.59 ± 1.01 1.16 ± 0.26 Muendlein A2 [24] 88 82 - - 1.50 ± 0.73 1.54 ± 0.79 5.74 ± 1.03 5.95 ± 1.24 3.39 ± 0.85 3.59 ± 1.01 1.45 ± 0.36 1.53 ± 0.41 Yu J [25] 46 99 8.12 ± 2.69 9.45 ± 3.69 1.45 ± 0.78 2.06 ± 1.45 4.62 ± 0.76 4.66 ± 0.87 2.67 ± 0.61 2.58 ± 0.68 1.36 ± 0.29 1.33 ± 0.34 Yu J [26] 100 390 8.4 ± 4.3 8.15 ± 4.18 1.25 ± 0.98 1.40 ± 1.22 3.91 ± 1.18 3.96 ± 1.20 2.34 ± 0.90 2.45 ± 0.84 1.13 ± 0.37 1.12 ± 0.36 Song YY [28] 231 492 - - 1.07 ± 0.38 1.14 ± 0.46 3.59 ± 0.55 3.60 ± 0.58 1.69 ± 0.46 1.66 ± 0.49 1.40 ± 0.29 1.41 ± 0.28
Table S5. The plasma APOC3 and lipid levels of the wild-type homozygotes (rs2854117 CC and rs2854116 TT) and the carriers of one or more variant alleles (rs2854117 T and rs2854116 C)
First author,
reference Genotype TG, mmol/L TC, mmol/L LDL-C, mmol/L HDL-C, mmol/L
Noncarriers Carriers Noncarriers Carriers Noncarriers Carriers Noncarriers Carriers Noncarriers Carriers Petersen KF [29] 19 75 0.84 ± 0.35 1.33 ± 0.98 3.78 ± 0.80 4.14 ± 0.91 2.15 ± 0.67 2.15 ± 0.67 1.27 ± 0.23 1.22 ± 0.44 Valenti L1 [30] 114 202 0.99 ± 0.50 1.06 ± 0.56 - - 2.97 ± 0.78 3.18 ± 0.59 1.50 ± 0.36 1.42 ± 0.31 Valenti L2 [30] 272 486 2.23 ± 1.89 1.95 ± 1.34 - - 3.39 ± 1.17 3.31 ± 1.09 1.22 ± 0.36 1.23 ± 0.34 Hyysalo J [31] 53 364 1.6 ± 0.8 1.7 ± 1.3 5.3 ± 1.1 4.9 ± 1.0 3.2 ± 1.0 2.8 ± 0.9 1.4 ± 0.4 1.4 ± 0.4
Zampino R [32] 45 121 1.17 ± 0.53 1.16 ± 0.62 4.93 ± 1.19 4.63 ± 1.03 - - -
[image:17.792.94.704.376.507.2]Figure S1. Galbraith plot of the association analysis between the APOC3
rs2854116 polymorphism and TG.
Figure S2. Galbraith plot of the association analysis between the APOC3
[image:18.612.164.442.312.509.2]Figure S3. Galbraith plot of the association analysis between the APOC3
rs2854116 polymorphism and LDL-C.
Figure S4. Galbraith plot of the association analysis between the APOC3
[image:19.612.164.445.312.502.2]Figure S5. Galbraith plot of the association analysis between the APOC3
rs2854117 polymorphism and TG.
Figure S6. Galbraith plot of the association analysis between the APOC3
[image:20.612.165.446.311.508.2]Figure S7. Galbraith plot of the association analysis between the APOC3
rs2854116-rs2854117 interaction and TC.
Figure S8. Galbraith plot of the association analysis between the APOC3
[image:21.612.164.451.319.512.2]Figure S9. Galbraith plot of the association analysis between the APOC3