Proceedings of the Multiling 2019 Workshop, co-located with the RANLP 2019 conference, pages 53–62 Varna, Bulgaria, September 6, 2019.
53
EASY-M: Evaluation System for Multilingual Summarizers
Marina Litvak, Natalia Vanetik and Yael Veksler Department of Software Engineering
Shamoon Engineering College Beer Sheva, Israel
{marinal, natalyav, yaelva}@sce.ac.il
Abstract
Automatictext summarizationaims at pro-ducing a shorter version of a document (or a document set). Evaluation of sum-marization quality is a challenging task. Because human evaluations are expen-sive and evaluators often disagree between themselves, many researchers prefer to evaluate their systems automatically, with help of software tools. Such a tool usually requires a point of reference in the form of one or more human-written summaries for each text in the corpus. Then, a system-generated summary is compared to one or more human-written summaries, ac-cording to selected measures (also called metrics). However, a single metric can-not reflect all quality-related aspects of a summary. In this paper we present the EvAluation SYstem for Multilingual Summarization (EASY-M), which enables the evaluation of system-generated sum-maries in 23 languages with several qual-ity measures, based on comparison with their human-generated counterparts. The system also provides comparative results with two built-in baselines. The EASY-M system is freely available for the NLP community1.
1 Introduction
Automatic text summarization aims at represent-ing a text document or a document set in a short concise form, called a summary. The size of a summary is usually limited by a user-defined num-ber of words, sentences, or percentage of the
orig-1https://drive.google.com/file/d/
1GKeJiHCAxA8fKEBpi424nmVDIHGYWKSt/view? usp=sharing
inal text. A summary can be either generic or tai-lored to fit the user’s needs. The former is ex-pected to convey the meaning of the whole text while the latter should reflect the interests of a user. Expressions of the user’s interests can come in many forms, including those of query, sub-ject, and style. Several extensive surveys of au-tomatic summarization can be found in (Nenkova et al., 2011; Nenkova and McKeown, 2012; Das and Martins,2007;Lloret and Palomar,2012).
Automatic text summarization approaches can be divided into two main categories. Extractive summarization(Gupta and Lehal,2010;Gambhir and Gupta,2017) deals with selecting a subset of sentences from the original document(s) without modifying them. Abstractive summarization can compile summaries by extracting parts of original sentences (this approach is known as compressive summarization (Gambhir and Gupta,2017)), or by generating new, original sentences. (Kasture et al.,
2014)
The need for quality assessment of summa-rization tools is obvious. Using human eval-uators is extremely time-consuming and labor-intensive. Additional issues arise when using this approach, such as the qualification of evalu-ators and their agreement on a content of gener-ated summaries. (Pittaras et al., 2019) Also, hir-ing qualified evaluators to work with summaries in multiple languages is not an easy and often te-dious task. Therefore, there is an existing need to construct automatic summary evaluation tools that provide consistent results for multiple languages. Moreover, these tools must provide a wide range of metrics for covering multiple aspects of sum-mary quality, such as the informativeness, cover-age of the main topics of a document, and the co-herency and readability of the summary.
Multilingiual Summarization. We have designed EASY-M for evaluation of summarization results and ranking summarization tools on multiple lan-guages. At its current state, the system enables the user to select a language and to evaluate the quality of generic summaries using several met-rics that address both informativeness and read-ability of summaries. EASY-M also enables users to compare the scores of evaluated summaries to corresponding scores of summaries that were duced by two baseline methods, one of which pro-duces ’ideal’ extractive summaries. By doing so, the system gives the user an idea of how far cur-rent summaries lie from the best result that can be possibly achieved by extractive summarization. EASY-M also enables the user to view the cor-relation between scores of different metrics with Spearman correlation.
This paper is organized as follows. Section
2 surveys related work. Section 3 describes the summarization metrics used by and the baseline summarizers implemented in EASY-M. Section4
shows and explains system’s interface. Section5
addresses the system’s availability. Finally, Sec-tion6concludes our work.
2 Related Work
Multiple MultiLing reports (Giannakopoulos et al., 2011,2015, 2017) give a detailed descrip-tion of evaluating multiple summarizadescrip-tion systems in different languages for various tasks. These evaluations utilized several measures including ROUGE (Lin, 2004) and MeMoG ( Gian-nakopoulos and Karkaletsis, 2011) for automatic evaluation of summarization systems. Both tools were applied separately and autonomously, after their adaptation to multiple languages. This experience demonstrates the actual need in the multilingual evaluation system that can be applied once on the summaries generated by different systems and rank them based on various scores measuring different summary qualities.
2.1 Automatic evaluation
Automatic evaluation relies on comparison be-tween the summaries generated by an automatic system (system summaries) and summaries that have been produced by humans (calledgold stan-dard summaries or reference summaries). Ref-erence summaries may be created from scratch by humans or produced by merging several
human-produced summaries by using the major-ity rule (Nanba and Okumura, 2000). In both cases, reference summaries usually contain new sentences that are not present in original docu-ments. When reference summaries are not avail-able, system summaries may be compared to orig-inal texts through the use of a metric that helps to see how information in the whole text is covered by a summary (Jing et al., 1998). Results of au-tomatic evaluation depend closely on the chosen metric.
2.2 Evaluation metrics
Papers (Jones and Galliers,1995) and (Jing et al.,
1998) contain surveys of early evaluation mea-sures for text summarization. Paper (Mani,2001) gives an overview of different methods for evalu-ating automatic summarization systems, and de-scribes different evaluation criteria such as co-herence, informativeness, different scoring ap-proaches, and means of analyzing summary con-tent.
Following (Jones and Galliers, 1995) and (Steinberger and Jeˇzek, 2012), summarization evaluation methods can be divided into two cate-gories: extrinsic evaluation, where the summary quality is judged by its helpfulness for a given task, andintrinsicevaluation, where a summary is analyzed directly. Our study focuses on intrinsic evaluation of generic summaries (where no user queries are supplied).
2.3 Metric types
2.4 Lexical similarity metrics
There are multiple metrics that compare between system and reference summaries in the lexical level. These metrics measure the similarity be-tween vocabularies (Salton and McGill,1986) of summaries. Some of them are applicable to extrac-tive summarization only, such as metrics based on sentence recall or precision (Kupiec et al., 1995;
Jing and McKeown,1999;Merlino and Maybury,
1999), or metrics that rely on sentence rank (in terms of summary-worthiness); they measure the correlation between sentence sequences represent-ing system and reference summaries (Donaway et al.,2000).
The Bleu machine translation evaluation mea-sure (Papineni et al.,2002) has been used as a sum-marization metric in (Pastra and Saggion,2003).
Metrics in the Recall-Oriented Understudy for Gisting Evaluation (ROUGE) family, proposed in (Lin, 2004), count the number of overlapping units such as n-grams, word sequences, and word pairs between the system and the reference sum-maries. This remains the most popular metric for summarization evaluation. In ( Giannakopou-los and Karkaletsis,2011), the authors present the Merge Model Graph (MeMoG) metric for evalu-ating summaries, which uses n-gram graphs for comparing system and reference summaries. Tests on summaries produced for MultiLing-2015 tasks (Giannakopoulos et al.,2015) have shown a clear indication that the MeMoG is much less sensi-tive than ROUGE to differences in text preprocess-ing. Both tools are also applicable to evaluation of abstractive summaries, but, as all lexical-based methods, they do not consider semantic similarity between system and reference summaries.
2.5 Semantic similarity metrics
An alternative solution to the lexical compari-son between system and reference summaries is to consider their semantics. Utility-based met-rics (Radev, 2000) use more fine-grained ap-proach to measure importance of summary sen-tences; however, they increase the chances of disagreement between different evaluators. The Pyramid method discussed in (Nenkova and Pas-sonneau, 2004) involves semantic matching of content units, to which differential weights are assigned based on their frequency in a corpus of summaries. Semantic models such as la-tent semantic analysis (LSA) (Deerwester et al.,
1990), topic modeling with latent Dirichlet anal-ysis (LDA) (Blei et al., 2003), word embed-dings with Word2Vec (Mikolov et al.,2013), and Doc2Vec (Le and Mikolov,2014) can also be used for comparing summaries to reference summaries or to original documents. In (Steinberger and Jeˇzek, 2012) the authors propose an LSA-based evaluation measure and show its high correlation to human rankings. In (Ng and Abrecht, 2015) and (Kusner et al.,2015) word embeddings were shown as a good means for evaluating summaries.
2.6 Readibility and coherency metrics
A separate place in the world of summariza-tion assessment metrics belongs to methods which address the linguistic quality of system-generated summaries rather than their contents. These metrics naturally depend on the language of summaries and cannot be called language-independent. We give a short description of the most popular metrics that are easy to implement with existing tools.
Proper noun ratio (PNR) is the ratio of proper nouns to the overall number of words in the sum-mary. It is hypothesized that higher PNR indicates higher readability (Smith et al., 2012), because proper nouns contribute to a text disambiguation. Noun ratio (NR) is used to capture the proportion of nouns present in the text. The text with lower proportion of nouns is considered to be easier to read (Hancke et al.,2012). Pronoun ratio (PR) is a linguistic measure indicating the level of semantic ambiguity that can arise while searching for the concept that a pronoun represents (ˇStajner et al.,
2012); a text with lower PR is considered more readable. The Gunning fog index (Gunning,1952) is a readability test for English writing that gives a parametrized measurement of complex words in the text. Average word length (AWL) reflects the ratio of long words used in a text. It was proven that the use of long words makes a text more diffi-cult to understand (Rello et al.,2013).
2.7 Evaluation systems
enough information to categorize a document. In the extrinsic categorization task, an evaluation is made by finding whether there is enough informa-tion contained in a summary to provide success-ful categorization of the document. In an intrin-sic question-answering task a topic-related sum-mary for a document was evaluated in terms of its ’informativeness’, namely, the degree to which it contained answers to a set of topic-related ques-tions.
Paper (Hovy et al., 2006) described a frame-work in which various automated summary con-tent evaluation methods can be situated, and im-plemented a specific variant that uses short text fragments. Multiple similarity metrics were in-troduced and their correlations with other known metrics, such as ROUGE, were reported. Most in-troduced metrics are lexical-based, except one that applied synonym resolution using WordNet. In (Abdi and Idris,2014) the authors present a sum-marization assessment system that does not rely on reference summaries. There, a coverage metric was proposed as a combination of syntactic (words order) and semantic (using WordNet) information of sentence words.
Our system, EASY-M, provides different types of metric suitable for the multilingual domain and also supplies comparison to baselines, one of them being extractive topline summarizer.
3 System design
In this section we describe the capabilities of the EASY system and the algorithms it implements. The system receives the following input from the user.
1. Afolder containing original documentsin UTF-8 text format, where every document is stored in a separate file. In case of multi-document summarization, every multi-document set should be merged into a single file.
2. A folder containing reference summaries should be available, with one or more sum-maries for every document. A document and its reference summaries are matched by their case-sensitive name parts before the file ex-tension. Different reference summaries are distinguished by their first extension.
3. Afolder containing system summaries be-ing evaluated, with one summary for each
document. A document and its summary are matched by a case-sensitive comparison of their name parts before file extension.
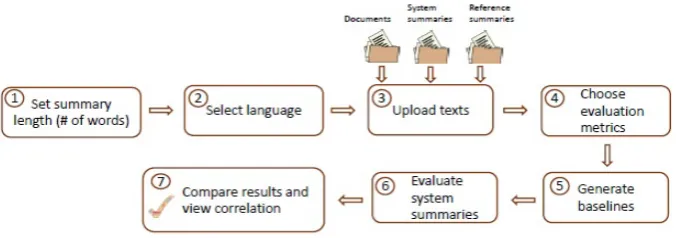
When input documents and summaries are sup-plied, the user first selects the language and sum-mary size, then selects metrics (see Section 3.1) and their parameters. The pipeline of EASY-M is depicted in Figure1. A detailed user story is de-scribed in Section4.
3.1 Summarization quality metrics
In this section, we explain how summarization metrics are used in our system.
3.1.1 ROUGE metrics
Paper (Lin,2004) presented set of metrics called ROUGE that is used for evaluating automatic sum-marization. ROUGE represents a set of similar metrics such as N, L, ROUGE-W, ROUGE-S, and ROUGE-SU. Its main idea is to count overlapping units (such as n-grams, word sequences and word pairs) between a system sum-mary and reference summaries. Intuitively, higher ROUGE scores show that the system summary is of higher quality. This metric is currently the most popular metric of its type, especially in the field of text summarization (Cohan and Goharian,2016).
In our system, we implemented several origi-nal ROUGE metrics and a new measure ROUGE-WSU, introduced in (Colmenares et al.,2015), as described below.
1. ROUGE-N, which measures overlap of n-grams between the system summary and ref-erence summariesR = {r1, . . . , rk}with a
user-definedn, that is usually set to a num-ber between 1 and 4. EASY-M supports both recall- and precision-based ROUGE-N mea-sure.
2. Common-subsequence-based metrics include the following
(a) ROUGE-L, which measures the length of the longest common subsequence
LCS() between the system and ref-erence summaries; this measure is an F-measure computed from LCS-based
PLCS precision and recallRLCS as
fol-lows:
FLCS =
(1 +β2)RLCSPLCS
Figure 1: EASY-M system flow.
where β is the system parameter with default β = 1 (to obtain a harmonic mean).
PLCS = Pk
i=1LCS(ri, S)
|S|
RLCS = Pk
i=1LCS∪(ri, S)
Pk i=1|ri| Here,
LCS∪(ri, S) =∪j=1...mLCS(ri, sj)
wheres1, . . . , smare the sentences ofS.
(b) ROUGE-W (Lin, 2004), which mea-sures the length of the longest weighted common subsequence and differentiates subsequences by their length. It is an F-measureFWLCS of ROUGE-W
preci-sion and recall computed as:
RWLCS =f−1(
WLCS(S, R f(|S|) )
PWLCS =f−1(
WLCS(S, R f(|r1|+· · ·+|rk|)
)
Function f() is smooth with a smooth inverse, and is usually set tof(k) =k2
so thatf(−1)(k) = √k. Parameterβ
is set to1(Sasaki et al.,2007).
3. Skip-based metrics
(a) ROUGE-S measures the overlap of skip-bigrams between a candidate summary and a set of reference summaries. It is similar to ROUGE-2 except that a skip-bigram refers to any pair of words in sentence order that allows for arbitrary
gaps. The precision and recall are com-puted as a ratio of the total number of possible bigrams.
Let SKIP2(S, ri) denote the number
of skip-matches between system sum-marySand reference summaryri. Then
ROUGE-S is defined as an F-measure
RSKIP2 based on precision and recall on
skip-bigrams where
RSKIP2 =
SKIP2(S, R)
C(|S|,2)
PSKIP2 =
SKIP2(S, R)
C(|r1+· · ·+rk|,2)
and C(x,2) is the total possible num-ber of bigrams. The maximum skip distance between two words is lim-ited by the maximum distance parame-ter dMAX−SKIP to be 4, so that
skip-bigrams are taken into account within the maximum skipping distance only. (b) ROUGE-SU measures overlaps of both
skip-bigrams and unigrams between a candidate summary and a set of refer-ence summaries. This is because we do not want to assign a 0 score to a can-didate summary simply because it does not share a skip bigram with any ref-erence summary when instead it has a common unigram. Therefore, unigrams are added to give credit to the candi-date’s summary if it does not contain any pair of words with the reference summary.
problem of ROUGE-SU that gives the same importance to all skip-bigrams ex-tracted from a phrase.
3.1.2 MeMoG metric
The MeMoG metric, presented in ( Giannakopou-los and Karkaletsis, 2011), is an evaluation method that based on n-gram graphs. Experimen-tal proof of its high performance for evaluation of summaries in different languages is presented in (Giannakopoulos et al.,2015).
Given a set of reference summaries, the MeMoG metric creates an n-gram graph for each of them and an n-gram graph for the system sum-mary. Formally, letG={V, E, W}be an n-gram graph, whereV is the set of character n-grams that can be created from the text,Eis the set of edges, andW is the weight function that represents the number of times a pair of n-grams is present in a text within a legal distance from each other. This distance is denotedDwin. In order to compute this
metric, the user should supply the following pa-rameters:
1. Lmin- minimum length of n-grams,
2. Lmax - maximum length of n-grams, and
3. Dwin - the windows size for two n-grams.
The default parameters areLmin = 3,Lmax = 3
and Dwin = 3, following (Giannakopoulos and Karkaletsis,2011). The next step is to represent all reference summaries by a single n-gram graph. We begin by initializing the graph to be an n-gram graph of any of the reference summaries. The ini-tial graph is then updated using every one of the re-maining n-gram reference summary graphs as fol-lows. LetG1be the current merged n-gram graph, and letG2 be the n-gram graph of the next refer-ence summary. Themerge functionU(G1, G2, l) defined edge weights as
w(e) =w1(e) + (w2(e)−w1(e))∗l
where l ∈ [0,1] is the learning factor, w1(e) is the weight ofeinG1, andw2(e)is the weight of
e in G2. In our system we chosel = 1i where
i > 1 is the number of the reference graph be-ing processed. In the MeMoG metric, the score of a summary is one similarity measurement, de-noted byVS, between system summary graphGj
and the merged reference graphGi. The similarity score between edges is defined as
VR(e) =min{wi(e),wj(e)}
/max{wi(e),wj(e)}
wherewi andwj are weights of the same edgee
(identified by its end-node labels) in graphsGiand
Gjrespectively. The final score is computed as
VS(Gi, Gj) =P
VR(e)/max{|Gi|,|Gj|}
3.2 Topic coverage metrics
Topic model is a type of statistical model for dis-covering the abstract topics that occur in a col-lection of documents. Latent Dirichlet allocation (LDA) (Blei et al.,2003;Blei, 2012) allows doc-uments to have a mixture of topics. LDA uses a generative probabilistic approach for discovering the abstract topics, (i.e., clusters of semantically coherent documents). As a result, we assume that every wordwin documentDis assigned its prob-ability distribution{pw,Ti}over topicsT1, . . . , TK
where K is the number of topics supplied as a user-defined parameter. Then for a system sum-marySwe can naturally define topic similarity to document (TSD) and topic similarity to reference summary (TSR) metrics as follows:
1. For every wordw, its topicT(w)is set to be
T(w) = arg maxipw,Ti.
2. A text is represented by topic vector T V = (pw,Ti)w of word topics; if word w is not
present in the text,T V[w] = 0.
3. Topic similarity between document D and system summary S is computed as cosine similarity T SD(D, S) = cos(T VS, T VD)
between their topic vectors.
4. Topic similarity between system summaryS
and reference summariesr1, . . . , rn is
com-puted as maximal cosine similarity between their topic vectors: T SR(r1, . . . , rn, S) =
maxicos(T VS, T Vri)
3.3 Readability metrics
3.4 Baselines
3.4.1 TopK baseline
For this baseline, we simply select the firstK sen-tences of the source document so that the number of words of the candidate summary is at least the predefined word limitW, makingKminimal.
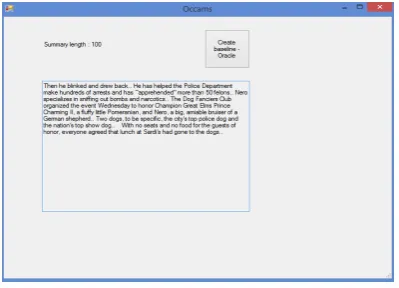
3.4.2 OCCAMS baseline
The OCCAMS, introduced in (Davis et al.,2012), is an algorithm for selecting sentences from a source document when reference summaries are known. This algorithm finds the best possible sentence subset covering reference summaries be-cause reference summaries are visible to it. While no extractive summary can fully match human-generated abstractive reference summaries, OC-CAMS achieves the best possible result (or its good approximation) for the extractive summa-rization task. Comparing system summaries to the result of OCCAMS shows exactly how far the tested system is from realistic best possible extrac-tive summarization result.
The OCCAMS’ parameters are the weights of the terms W, the number of words in sentences
C, and the size of the candidate summary L. LetDbe the source document consisting of sen-tences S1, . . . , Sn and let T = {t1, . . . , tm} be
the set of document’s terms (tokenized stemmed words). Initially OCCAMS computes document matrix A using term-to-sentence assignment and term entropy weights. Then, OCCAMS computes the singular value decomposition of matrix A as
A = U SVT, following the approach of ( Stein-berger and Jeˇzek, 2004). The singular value de-composition produces term weightsw(ti). Then,
the final solution is computed by using Budgeted Maximum Coverage (BMC) from (Khuller et al.,
1999) and Fully Polynomial Time Approximation Scheme (FPTAS) of (Karger,2001) greedy algo-rithms. These algorithms select sentences that pro-vide maximum coverage of the important terms (maximum weight sum), while ensuring that their total length does not exceed the intended summary size.
4 Implementation details
In this section we describe and give examples of the EASY system interface.2
2
Screen images are taken from standalone imple-mentation. Web implementation with partial features
4.1 Operational pipeline
[image:7.595.326.503.146.288.2]The first screen of the system (see Figure2) asks the user to choose language and to set the sum-mary length (if a sumsum-mary is too long, it will be cut to the given number of words).
Figure 2: Choosing language.
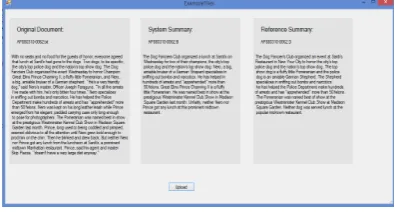
[image:7.595.317.515.473.579.2]In our system, a user can make a choice be-tween analyzing a single file with its system and reference summaries, or analyzing an entire cor-pus. The user needs to supply file names for the document (or directory of documents), reference summary (or summaries) or reference summaries directory, and the system summary or their direc-tory that is to be evaluated. File names are treated as case-sensitive. Figure3shows the input selec-tion interface for the case of a corpus.
Figure 3: Choosing texts, reference and system summary.
Figures4,5and6show results of computation for ROUGE, MeMoG, and topic summarization metrics and readability metrics for the selected in-put. Note that readability analysis is currently sup-ported for the English language only. The top part of the interface in both cases enables the user to se-lect parameters for every metric, while the bottom
part gives the user an opportunity to compute base-line summaries and to compute the chosen metric for baselines with the same parameters as above.
[image:8.595.81.281.116.256.2]Figure 4: Rouge metrics computation with com-parison to baselines.
[image:8.595.82.282.316.422.2]Figure 5: Readability metrics computation.
Figure 6: Topic metrics computation.
Figure7shows baseline summary computed by the OCCAMS algorithm.
5 Availability and reproducibility
The EASY-M system standalone version is implemented in c#, and its Web version is im-plemented in Angular7 on the client side, and sp.net WebAPI2 on the server side. Video of the standalone interface operation is available at https://www.youtube.com/watch?v= HQhzhSQ7O1A&t=143s. Currently, the system
Figure 7: OCCAMS summary.
supports 17 languages: Czech, Danish, Dutch, English, Estonian, Finnish, French, German, Greek, Italian, Norwegian, Polish, Portuguese, Slovene, Spanish, Swedish and Turkish.
6 Conclusions
In this paper we present a multilingual framework named EASY-M for evaluation of automatic sum-marization systems. Currently, EASY-M supports 17 different languages. The system enables the users to compute several summarization metrics, including readability measures (English only), for the same set of summaries and to observe how they correlate with each other using Spearsman’s corre-lation.
[image:8.595.82.278.471.578.2]References
Asad Abdi and Norisma Idris. 2014. Automated sum-marization assessment system: quality assessment
without a reference summary. InThe International
Conference on Advances in Applied Science and En-vironmental Engineering-ASEE.
D M Blei. 2012. Probabilistic topic models.
Commu-nications of the ACM55(4):77–84.
D. M. Blei, A. Y. Ng, and M. I. Jordan. 2003. Latent
dirichlet allocation. Journal of Machine Learning
Research3:993–1022.
Arman Cohan and Nazli Goharian. 2016.
Revisit-ing summarization evaluation for scientific articles.
arXiv preprint arXiv:1604.00400.
Carlos A Colmenares, Marina Litvak, Amin Mantrach, and Fabrizio Silvestri. 2015. Heads: Headline gen-eration as sequence prediction using an abstract feature-rich space. InProceedings of the 2015 Con-ference of the North American Chapter of the Asso-ciation for Computational Linguistics: Human Lan-guage Technologies. pages 133–142.
Dipanjan Das and Andr´e FT Martins. 2007. A survey
on automatic text summarization. Literature Survey
for the Language and Statistics II course at CMU
4:192–195.
Sashka T Davis, John M Conroy, and Judith D Schlesinger. 2012. OCCAMS–an optimal combina-torial covering algorithm for multi-document
sum-marization. InData Mining Workshops (ICDMW),
2012 IEEE 12th International Conference on. IEEE, pages 454–463.
Scott Deerwester, Susan T Dumais, George W Fur-nas, Thomas K Landauer, and Richard Harshman.
1990. Indexing by latent semantic analysis.
Jour-nal of the American society for information science
41(6):391–407.
Robert L Donaway, Kevin W Drummey, and Laura A Mather. 2000. A comparison of rankings produced
by summarization evaluation measures. In
Proceed-ings of the 2000 NAACL-ANLP Workshop on Au-tomatic summarization. Association for Computa-tional Linguistics, pages 69–78.
Mahak Gambhir and Vishal Gupta. 2017. Recent
auto-matic text summarization techniques: a survey.
Ar-tificial Intelligence Review47(1):1–66.
George Giannakopoulos, John Conroy, Jeff Kubina, Peter A Rankel, Elena Lloret, Josef Steinberger, Ma-rina Litvak, and Benoit Favre. 2017. Multiling 2017
overview. In Proceedings of the MultiLing 2017
workshop on summarization and summary evalua-tion across source types and genres. pages 1–6.
George Giannakopoulos, Mahmoud El-Haj, Benoit Favre, Marina Litvak, Josef Steinberger, and
Va-sudeva Varma. 2011. TAC 2011 MultiLing pilot
overview. InProceedings of Text Analytics
Confer-ence. TAC.
George Giannakopoulos and Vangelis Karkaletsis. 2011. AutoSummENG and MeMoG in evaluating
guided summaries. InProceedings of Text Analysis
Conference.
George Giannakopoulos, Jeff Kubina, John Conroy, Josef Steinberger, Benoit Favre, Mijail Kabadjov, Udo Kruschwitz, and Massimo Poesio. 2015. Multi-ling 2015: multiMulti-lingual summarization of single and multi-documents, on-line fora, and call-center con-versations. InProceedings of the 16th Annual Meet-ing of the Special Interest Group on Discourse and Dialogue. pages 270–274.
Robert Gunning. 1952.The technique of clear writing. McGraw-Hill, New York.
Vishal Gupta and Gurpreet Singh Lehal. 2010. A
survey of text summarization extractive techniques.
Journal of emerging technologies in web intelli-gence2(3):258–268.
Julia Hancke, Sowmya Vajjala, and Detmar Meurers. 2012. Readability classification for german using lexical, syntactic, and morphological features. Pro-ceedings of COLING 2012pages 1063–1080.
Eduard Hovy, Chin-Yew Lin, Liang Zhou, and Junichi Fukumoto. 2006. Automated summarization
eval-uation with basic elements. In Proceedings of the
Fifth Conference on Language Resources and Eval-uation (LREC 2006). Citeseer, pages 604–611.
Hongyan Jing, Regina Barzilay, Kathleen McKeown, and Michael Elhadad. 1998. Summarization
evalu-ation methods: Experiments and analysis. InAAAI
symposium on intelligent summarization. Palo Alto, CA, pages 51–59.
Hongyan Jing and Kathleen R McKeown. 1999. The decomposition of human-written summary
sen-tences. In Proceedings of the 22nd annual
inter-national ACM SIGIR conference on Research and development in information retrieval. ACM, pages 129–136.
Karen Sparck Jones and Julia R Galliers. 1995.
Eval-uating natural language processing systems: An analysis and review, volume 1083. Springer Science & Business Media.
David R Karger. 2001. A randomized fully polynomial time approximation scheme for the all-terminal
net-work reliability problem. SIAM review43(3):499–
522.
NR Kasture, Neha Yargal, Neha Nityanand Singh, Neha Kulkarni, and Vijay Mathur. 2014. A survey
on methods of abstractive text summarization. Int.
J. Res. Merg. Sci. Technol1(6):53–57.
Samir Khuller, Anna Moss, and Joseph Seffi Naor. 1999. The budgeted maximum coverage problem.
Julian Kupiec, Jan Pedersen, and Francine Chen. 1995.
A trainable document summarizer. InProceedings
of the 18th annual international ACM SIGIR confer-ence on Research and development in information retrieval. ACM, pages 68–73.
Matt Kusner, Yu Sun, Nicholas Kolkin, and Kilian Weinberger. 2015. From word embeddings to
docu-ment distances. InInternational Conference on
Ma-chine Learning. pages 957–966.
Quoc Le and Tomas Mikolov. 2014. Distributed
rep-resentations of sentences and documents. In
Inter-national Conference on Machine Learning. pages 1188–1196.
Chin-Yew Lin. 2004. ROUGE: A package for
auto-matic evaluation of summaries. InProceedings of
the Workshop on Text Summarization Branches Out (WAS 2004). pages 25–26.
Elena Lloret and Manuel Palomar. 2012. Text sum-marisation in progress: a literature review. Artificial Intelligence Review37(1):1–41.
Inderjeet Mani. 2001. Summarization evaluation: An
overview. InNAACL 2001 Workshop on Automatic
Summarization.
Inderjeet Mani, Gary Klein, David House, Lynette Hirschman, Therese Firmin, and Beth Sundheim. 2002. SUMMAC: a text summarization evaluation.
Natural Language Engineering8(1):43–68.
Andrew Merlino and Mark Maybury. 1999. An
em-pirical study of the optimal presentation of multime-dia summaries of broadcast news. Cambridge, MA: MIT Press.
Tomas Mikolov, Ilya Sutskever, Kai Chen, Greg S Cor-rado, and Jeff Dean. 2013. Distributed representa-tions of words and phrases and their
compositional-ity. InAdvances in neural information processing
systems. pages 3111–3119.
Hidetsugu Nanba and Manabu Okumura. 2000. Pro-ducing more readable extracts by revising them. In
Proceedings of the 18th conference on Computa-tional linguistics-Volume 2. pages 1071–1075.
Ani Nenkova and Kathleen McKeown. 2012. A
sur-vey of text summarization techniques. In Mining
text data, Springer, pages 43–76.
Ani Nenkova, Kathleen McKeown, et al. 2011.
Au-tomatic summarization. Foundations and Trends in
Information Retrieval5(2–3):103–233.
Ani Nenkova and Rebecca Passonneau. 2004. Evalu-ating content selection in summarization: The
pyra-mid method. InProceedings of the human language
technology conference of the north american chap-ter of the association for computational linguistics: Hlt-naacl 2004.
Jun-Ping Ng and Viktoria Abrecht. 2015. Better sum-marization evaluation with word embeddings for
rouge.arXiv preprint arXiv:1508.06034.
Kishore Papineni, Salim Roukos, Todd Ward, and Wei-Jing Zhu. 2002. Bleu: a method for automatic
eval-uation of machine translation. In Proceedings of
the 40th annual meeting on association for compu-tational linguistics. Association for Computational Linguistics, pages 311–318.
Katerina Pastra and Horacio Saggion. 2003. Colouring
summaries bleu. InProceedings of the EACL 2003
Workshop on Evaluation Initiatives in Natural Lan-guage Processing: are evaluation methods, metrics and resources reusable?. Association for Computa-tional Linguistics, pages 35–42.
Nikiforos Pittaras, Stefano Montanelliy, George Gian-nakopoulos, Alfio Ferraray, and Vangelis Karkalet-sis. 2019. Crowdsourcing in single-document sum-mary evaluation: the argo way. In Marina Litvak and Natalia Vanetik, editors,Multilingual Text Anal-ysis: Challenges, Models, and Approaches, World Scientific, chapter 8.
Dragomir R Radev. 2000. Summarization of
multi-ple documents: clustering, sentence extraction, and
evaluation. InProceedings of the Workshop on
Au-tomatic Summarization, 2000. Association for Com-putational Linguistics.
Luz Rello, Ricardo Baeza-Yates, Laura Dempere-Marco, and Horacio Saggion. 2013. Frequent words improve readability and short words improve under-standability for people with dyslexia. InIFIP Con-ference on Human-Computer Interaction. Springer, pages 203–219.
Gerard Salton and Michael J McGill. 1986.
Introduc-tion to modern informaIntroduc-tion retrieval. McGraw-Hill, Inc.
Yutaka Sasaki et al. 2007. The truth of the F-measure.
Teach Tutor mater1(5):1–5.
Christian Smith, Henrik Danielsson, and Arne J¨onsson. 2012. A good space: Lexical predictors in vector
space evaluation. InProceedings of the eighth
in-ternational conference on Language Resources and Evaluation (LREC), Istanbul, Turkey. Citeseer.
Sanja ˇStajner, Richard Evans, Constantin Orasan, and Ruslan Mitkov. 2012. What can readability mea-sures really tell us about text complexity. In Pro-ceedings of workshop on natural language pro-cessing for improving textual accessibility. Citeseer, pages 14–22.
Josef Steinberger and Karel Jeˇzek. 2004. Text sum-marization and singular value decomposition. In In-ternational Conference on Advances in Information Systems. Springer, pages 245–254.
Josef Steinberger and Karel Jeˇzek. 2012. Evaluation
measures for text summarization. Computing and