Structure Changes during Amorphization of Ge–Se Alloys by Mechanical Milling
Takeshi Usuki
1, Fumiaki Araki
1;*, Osamu Uemura
1, Yasuo Kameda
1, Toshio Nasu
2and Masaki Sakurai
31Department of Material and Biological Chemistry, Faculty of Science, Yamagata University, Yamagata 990-8560, Japan 2Faculty of Education, Yamagata University, Yamagata 990-8560, Japan
3
Institute for Materials Research, Tohoku University, Sendai 980-8577, Japan
Amorphous GeSe2, Ge3Se4 and Ge4Se5 have been prepared by mechanical milling(MM), and their structural changes have been
investigated by X-ray diffraction, Raman scattering and EXAFS measurements. Amorphous Ge4Se5was obtained at the millingtime of 50 h in
the present experiment, which has never been obtained by the rapid quenchingfrom the melt. The short-range order in GeSe2remains almost
unchanged during the milling. Since the configuration of tetrahedral units in the crystalline phase becomes rapidly less ordered with increasing the millingtime, the amorphization is complete at a short millingtime. On the other hand, Ge3Se4and Ge4Se5samples, both of which are
eutectic mixtures of intermediate compounds of GeSe2and GeSe, need longer milling times for the amorphization, as they are accompanied by
the change in local structures. The short-range order in these Ge–Se alloys is described by covalent 4(Ge)–2(Se) folded coordination structure. The structural feature of crystalline GeSe phase with a partial ionicity,i.e.3(Ge)–3(Se) folded coordination, disappears not only in amorphous Ge3Se4but also in amorphous Ge4Se5, where the concentration ratio of Ge/Se is close to that of the stoichiometric composition of GeSe. The
bond-lengths of Ge–Se and Ge–Ge in these amorphous alloys are determined to be 0.236 and 0.248 nm, respectively, which are consistent with the correspondingcovalent distances.
(Received September 9, 2002; Accepted January 16, 2003)
Keywords: mechanical milling, germanium–selenium alloys, amorphization, X-ray diffraction, Raman, EXAFS, short-range ordering
1. Introduction
Ge–Se alloys form two intermediate compounds, that is, congruently melting GeSe2and peritectically formed GeSe.1)
Crystalline GeSe2is constructed by GeSe4=2tetrahedral units
connectingeach other at the corners or edges, in which a central Ge is covalently bonded to four Se.2) The crystal structure of GeSe is a distorted NaCl type with a partial ionicity, in which both Ge and Se are surrounded by six different nearest neighbors, three at a shorter distance and other three at a longer one.3) It is well-known that the amorphous formingcomposition of Ge–Se alloys ranges from pure Se to Ge3Se4 by a rapidly melt-quenching
method.4) It has become apparent that the 4(Ge)–2(Se) folded structural model with covalent nature is applicable for amorphous samples in this composition range.5,6)A lot of structural studies for amorphous Ge–Se alloys have been performed in relation with their physical properties, such as photo induced crystallization phenomena.7)
However, there is a lack of information concerning structure changes during the amorphization process in these systems. Particularly, a fundamental interest for the Ge-chalcogen systems is focused on the structural difference between amorphous and crystalline alloys in the vicinity of the composition of GeSe.
At present, there is conflictingstructural information on amorphous GeSe films which were prepared by sputtering and vacuum-evaporatingtechniques. Information on the sputtered and evaporated films are largely affected by the measuringconditions of the films. Fuosset al.have reported, in their X-ray differential anomalous scatteringstudy of sputtered Ge0:5Se0:5 film, that its amorphous structure has
three-coordinated Ge and Se, based on the atomic config-uration in crystalline GeSe phase.8) On the other hand, a
recent EXAFS study by Gurman et al. on a sputtered film showed that amorphous GeSe maintains a 4(Ge)–2(Se) coordinated structure.9) In this situation, the study of coordination structure in amorphous Ge–Se alloys around the composition of GeSe is highly desired.
In order to investigate the structure changes from crystal-line phase to amorphous one, X-ray diffraction, Raman scatteringand EXAFS measurements have been performed for the binary Ge–Se system with the help of mechanical millingmethod, which is one of the most suitable techniques to obtain amorphous materials. In addition, the present paper supplies information on the short-range order in amorphous Ge4Se5, which has not been obtained by rapid quenching
from the melt.
2. Experimental Procedures
Purities of Ge and Se used are 99.999%. Stoichiometric amounts of Ge and Se were melted and reacted together in an evacuated quartz tube. The crystalline alloy prepared was annealed in advance to ensure its homogeneity before milling. The starting material for the mechanical milling of GeSe2sample is a pure stoichiometric GeSe2, and those for
Ge3Se4and Ge4Se5samples are eutectic mixtures of
crystal-line GeSe2and GeSe. The total mass of crystalline powders
employed for mechanical millingwas about 3 g. The powder sample was put into an yttoria stabilized zirconia (YTZP) vial, together with YTZP balls (10 mm in diameter). The mechanical millingwas made usinga shaker ball mill machine under Ar atmosphere (SPEX-8000). It was con-firmed by the X-ray fluorescence trace elemental analysis that the impurity contamination from a vial and balls was less than 0.1 at%.
X-ray diffraction intensities with Cu-Kradiation, Raman spectra and EXAFS patterns were measured to investigate the structural changes during amorphization of the sample due to
*Graduate Student, Yamagata University.
mechanical milling. The Raman spectra were measured using a spectrometer (JASCO NR-1000) with a 514.5 nm line of an NEC GRG-3200 Ar ion laser operated at 20 mW. The Raman scatteringintensities were recorded at every 1 cm1
frequen-cy interval and at a scanningspeed of 12 cm1/min. The scan
was repeated thirty times for the data accumulation. The calibration of the monochromator was made using89 emission lines of Ne. The EXAFS measurement at Ge K-edge was performed at the BL-12C station of KEK-PF (Tsukuba, Japan), with a silicon (111) monochromator calibrated with the Cu K-edge of a standard copper foil. The storage ring was operated at 3.0 GeV with a maximum beam current of 350 mA. The intensity of the incident beam,
I0, and that of the transmitted beam,I, were measured using two ionization chambers filled with a N2(85)–Ar(15) mixture
forI0, and Ar forI, respectively.
Detailed structural analyses of amorphous alloys were carried out by X-ray diffraction with Mo-Kradiation usinga - diffractometer (manufactured by RIGAKU Co.) with a horizontal sample support. The diffraction intensities were counted at every 2¼0:2 interval over a range of 5<Q<171nm1 (Q¼4sin=, is the scattering
angle) with a fixed counting time of 100 s. The whole 2 range was scanned three times to minimize any long-term instrumental drift.
The correction and normalization methods for X-ray diffraction intensities and EXAFS oscillation functions have already been described in our previous papers.10,11)
3. Experimental Results
The amorphization of GeSe2sample due to the mechanical
millingwas completed within a millingtime of 1 h. It took 5 h for Ge3Se4and more than 50 h for Ge4Se5. It should be noted
that amorphous Ge4Se5is not obtainable by rapid quenching
from the melt.4)The GeSe sample with distorted NaCl type structure as the startingmaterial did not become amorphous perfectly even at the millingtime of more than 300 h.
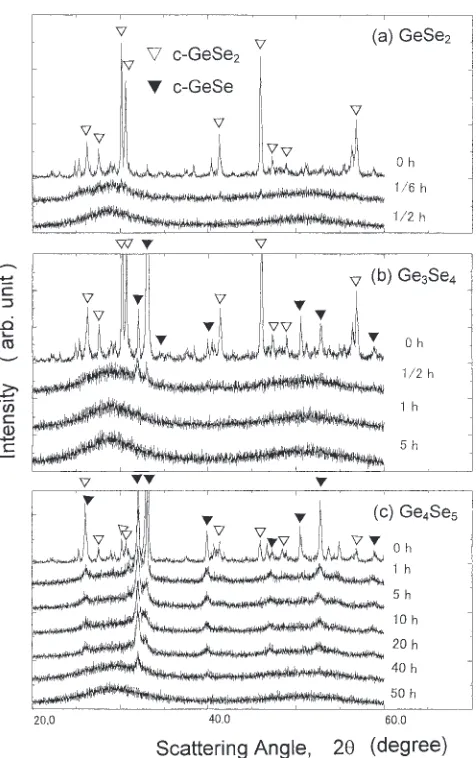
Figure1 shows X-ray diffraction patterns of GeSe2,
Ge3Se4 and Ge4Se5 samples at respective millingtimes.
Sharp diffraction patterns of GeSe2 phase were easily
replaced by halo patterns during milling, suggesting the similarity of bondingfeature or atomic structure between crystalline and amorphous GeSe2. For Ge3Se4 and Ge4Se5
samples, the diffraction patterns of GeSe2 phase in the
eutectic mixture disappears at the early stage of the milling, while the disappearance of the Bragg lines of GeSe phase occurs very slowly, particularly at the composition of Ge4Se5, although finally the amorphous halo patterns can
be obtained.
Figure2 shows the variation of Raman spectra for the above three samples during the milling. Before the milling, a strongmain peak assigned to the characteristic vibration band of crystalline GeSe2appears at 210 cm1together with other
crystalline bands at lower energy side. The intensity of the main peak becomes weaker rapidly with increasingmilling time. Besides this peak, another vibration band grows at about 200 cm1 for amorphous phases. In addition, a broadened 175 cm1 band is clearly observed in Ge3Se4
and Ge4Se5samples after becomingamorphous. This band is
attributable to Ge-enriched structural units such as Se3=2Ge–
(GeSe2=2)n–GeSe3=2and Ge(Geð4mÞ=4Sem=2).12)
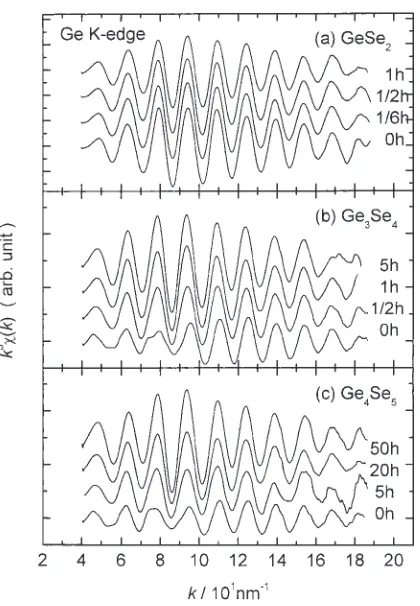
Figure3shows EXAFS oscillation functions,k3 ðkÞ, vsk
(wave number vector magnitude) observed at Ge K-edge at several millingtime for the three samples. At the stoichio-metric composition of GeSe2(Fig.3(a)), the functional form
of k3 ðkÞ remains unchanged in both amplitude and phase duringthe milling, indicatingthat the local structural environment around Ge and Se differs little in crystalline and amorphous GeSe2. On the other hand, it can be seen in
Figs.3(b) and (c) that the amplitudes ofk3 ðkÞof Ge
3Se4and
Ge4Se5samples dynamically vary with increasingthe milling
time. Namely, the position of the maximum amplitude in
k3 ðkÞshifts fromk120nm1at 0 h to90nm1at a final
amorphous state, which is strongly related to the appearance of direct Ge–Ge bonds and the drastic change in Ge–Se bondingnature. This feature is consistent with the result of Raman spectra that excess Ge atoms, which may be produced by the destruction of GeSe phase, enter into the GeSe4=2
network matrix to form Ge-enriched structural units. An example of the DSC measurement in Ge4Se5 sample
for consideringthe change in thermal stability of the amorphous phase duringmillingis shown in Fig.4. It appears that both crystallization (TX) and glass transition (Tg)
Fig. 1 X-ray diffraction patterns for GeSe2(a), Ge3Se4(b) and Ge4Se5(c)
[image:2.595.309.547.66.445.2]temperatures in the amorphous phase become higher with increasingthe millingtime, that is, the thermal stability in the amorphous phase increases with proceedingamorphization of the alloy.
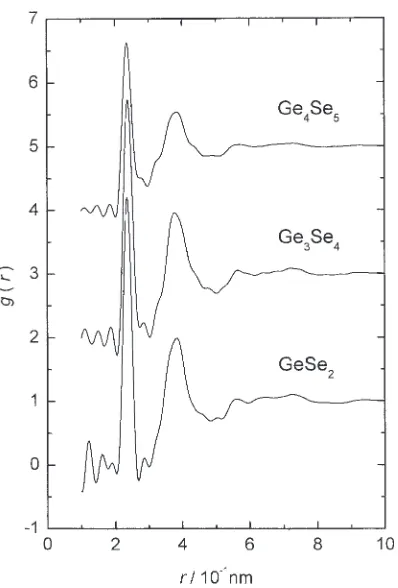
X-ray structure factors,SðQÞ, and the correspondingpair distribution functions,gðrÞ, in amorphous GeSe2, Ge3Se4and
Ge4Se5 are shown in Figs.5 and 6, respectively. The first
sharp diffraction peak (FSDP) inSðQÞat about 10 nm1is the
strongest for GeSe2and gradually weakens with Ge content.
Since the FSDP means the presence of the medium-range order in the amorphous phase, the ordered connection of GeSe4=2tetrahedra may be damaged by the formation of
Ge-enriched structural units. The first peak ingðrÞfor the three amorphous alloys is well-resolved and located at a relatively shorter distance, indicatingthat the three alloys have a covalent nature. Although the composition is nearly equal to the stoichiometric composition of GeSe, amorphous Ge4Se5
has a prominently covalent coordination environment, differingfrom the crystalline GeSe phase with a partial ionicity.
Fig. 2 Raman spectra for GeSe2(a), Ge3Se4(b) and Ge4Se5(c) at respective millingtimes.
Fig. 3 EXAFS oscillation functions,k3 ðkÞ, at Ge K–edge for GeSe 2(a),
Ge3Se4(b) and Ge4Se5(c) at respective millingtimes.
Fig. 4 Trace of the DSC measurement aroundTg andTxfor Ge4Se5 at
[image:3.595.99.498.69.274.2] [image:3.595.66.276.329.632.2] [image:3.595.325.525.330.566.2]4. Discussion
4.1 Amorphization process during mechanical milling
As shown in Fig.2(a), there are two peaks at around 200 and 210 cm1 in the Raman spectra for amorphous GeSe
2.
These two bands can be connected with the A and A bands
in the crystalline GeSe2, which correspond to the breathing
vibration of corner-sharingand edge-sharingtetrahedra, respectively.13)With increasingdisorder in the crystal toward the amorphous state, the A and Abands become broadened
through the disorder effects; especially the A band is
strongly influenced by the degree of disorder.13)Intermediate compound, GeSe2, has high and low temperature phases, but
only the former can be produced in the usual preparation from the liquid phase.1) The atomic structure of high temperature phase has two dimensional layers (2D form) composed of corner-sharingand edge-sharingGeSe4=2
tetra-hedra.2) Low temperature phase has three dimensional network structure (3D form) composed of corner-sharing tetrahedra alone.14)Therefore, the present results of Raman spectra suggest that both 2D and 3D forms are stable in the amorphous state at GeSe2. On the other hand, intensity of the
210 cm1 Raman band for amorphous samples decreases
rapidly with increasingGe content,i.e., the fraction of edge-sharingtetrahedra as basic buildingblocks in the amorphous state decreases with increasingGe content. Moreover, seeing the Raman spectrum in Ge3Se4sample at a millingtime of 1 h
or that in Ge4Se5sample at 40 h, the 175 cm1band, which is
related to the Ge-enriched units, rapidly grows after the perfect disappearance of 150 cm1 band (vibration band related to the ionic GeSe phase15)). In other words, it appears that the excess Ge atoms produced by the destruction of GeSe phase are dissolved into the random GeSe4=2network matrix
to form Ge-enriched corner-sharingstructural units, such as Se3=2Ge–(GeSe2=2)n–GeSe3=2and Ge(Geð4mÞ=4Sem=2).12)
The change of the local order for GeSe2, Ge3Se4 and
Ge4Se5samples in the amorphizingprocess by the
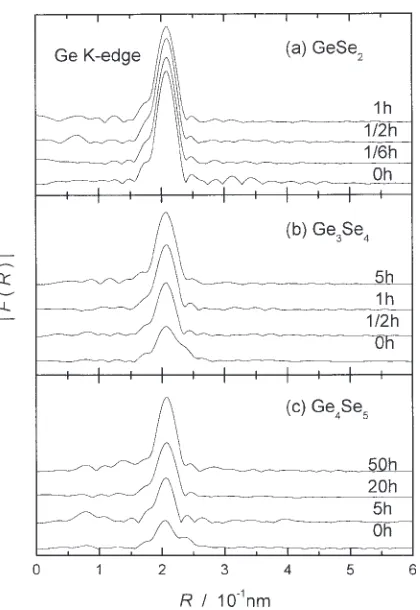
mechan-ical millingbecomes further apparent by consideringthe EXAFS distribution function in real space. Figure7 shows the EXAFS distribution functions, FðRÞ, the Fourier trans-formation of k3 ðkÞ shown in Fig.3, at the Ge K-edge at several millingtimes for the three samples. The first coordination shell in GeSe2 sample, which corresponds to
the main FðRÞpeak, changes little before and after milling. On the other hand, a remarkable difference in the local orderingcan be seen between crystalline and amorphous states for Ge3Se4and Ge4Se5samples. A subpeak or shoulder
located at about R¼0:240nm in FðRÞ at 0 h, which is attributable to the contribution of longer Ge–Se bonds with the partial ionic nature in the crystalline GeSe phase, perfectly disappears after becomingamorphous. Same results are confirmed by our Se K-edge EXAFS experiment for these samples. When the amorphization is complete, there is not any considerable difference in the shape of the main FðRÞ peak among the three amorphous alloys, suggesting that they have a common local structure or bondingfeature as well. The position ofFðRÞpeak shifts only a little to a largerRwith increasingGe content, because the first coordination shell in the amorphous state consists of Ge–Se and Ge–Ge bonds for Ge3Se4and Ge4Se5samples.
Fig. 5 X-ray structure factors for amorphous GeSe2, Ge3Se4and Ge4Se5.
Fig. 6 X-ray pair distribution functions for amorphous GeSe2, Ge3Se4and
[image:4.595.70.270.67.366.2] [image:4.595.71.270.418.712.2]Based on the present experimental results, we attempt to obtain structural parameters, the interatomic distance and coordination number, in the first coordination shell for GeSe2, Ge3Se4 and Ge4Se5 samples, employingthe EXAFS
and X-ray diffraction data. For the EXAFS data (Figs. 3and
7), simulations of the Fourier filtered experimental signals have been performed, usinga standard least-squares fitting procedure.11) The atomic phase-shift and backscattering amplitude derived theoretically by Teo and Lee were employed in the present fitting.16) The best-fit curves were obtained assumingthat the Ge–Se correlation alone is contained for GeSe2 sample, and two shells with Ge–Se
and Ge–Ge correlations are contained for Ge3Se4and Ge4Se5
samples. Table1 lists interatomic distances of Ge–Se and Ge–Ge given in the present EXAFS curve fitting. For the stoichiometric composition of GeSe2, the local structural
environment around Ge differs little duringthe milling, where the Ge–Se interatomic distance,rGe{Se, is estimated to
be 0.235 nm at all millingstage. For the Ge3Se4 and Ge4Se5
samples, the Fourier transform moduli show two peaks at crystalline stage (0 h) with a shortrGe{Se of 0.235 nm and a longer one of 0.255 nm. The present values of interatomic distances in the crystalline phases are identical to the correspondingones in literatures, provingthe adequacy of the present EXAFS data analysis.2,3)In the amorphous phase, the longer Ge–Se bond disappears at the early stage of the milling. The quantitative analysis shows the presence of direct Ge–Ge bonds with an average distance of 0.248 nm besides the shorter Ge–Se bonds of 0.235 nm. These distances are very close to the ideal covalent values of 0.236 nm for Ge–Se and 0.244 nm for Ge–Ge, respectively.
4.2 Structural analysis of amorphous GeSe2, Ge3Se4 and Ge4Se5
In order to estimate the coordination number of constitut-ingatoms in amorphous alloys, we analyze the results of X-ray diffraction intensities shown in Fig.5. The contribution ofi–jpair to the observed X-raySðQÞcan be expressed as,
SðQÞ ¼X Xcicjfifj cifj
2Si{jðQÞ;
Si{jðQÞ 1¼ ð2ijÞ
cini{jfifj X
cifj
2
exp 1
2l 2 i{jQ
2
sinðri{jQÞ ri{jQ
; ð1Þ
where,ni{j,ri{jandli{jare the number of atomjaround atom i, bond-length and root mean square displacement ofi–jpair, respectively. The sum of Si{jðQÞ from Ge–Se and Ge–Ge
pairs was fitted to the observed SðQÞ at Q>80nm1. As
initial values ofrGe{Se andrGe{Ge, the result of the EXAFS measurement was adopted. An example of the fittingis displayed in Fig.8. A fairly good agreement between observed and calculated SðQÞ is obtained in the range of
Q>80nm1. Figure8 also shows contributions of partial pair correlationsgi{jðrÞto the totalgðrÞin the first
coordina-tion shell, where gi{jðrÞ were calculated by the Fourier
transformation ofSi{jðQÞ. Structural parameters of the first
coordination shell in amorphous GeSe2, Ge3Se4and Ge4Se5
obtained by the present least-squares fittingare listed in Table2. As shown in Table2, values ofrGe{SeandrGe{Geare
in good agreement with those obtained by the present EXAFS experiment, and do not vary against composition. Similarly, the total coordination numbers of Ge,nGe ¼nGe{SeþnGe{Ge
and that of Se,nSe ¼nSe{Ge¼ ðcGe=cSeÞnGe{Se, are close to 4 and 2, respectively, for any compositions, denotingthe common covalent feature in the three amorphous alloys.
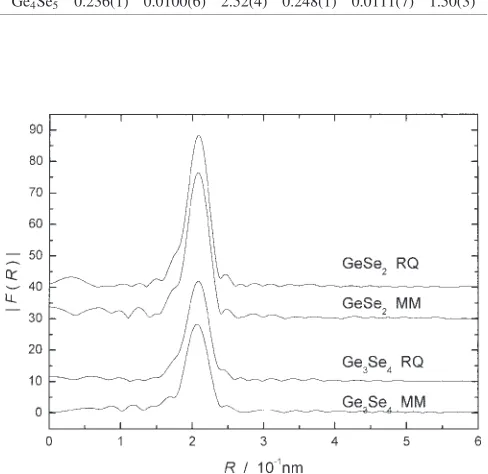
Finally, we compare the short-range order in amorphous GeSe2 and Ge3Se4 prepared by the mechanical millingand
[image:5.595.65.275.67.372.2]rapid quenchingfrom the melt. Figure9 gives results of EXAFS FðRÞ at Ge K-edge for mechanically milled and rapidly quenched samples. Clearly, there is no significant
Table 1 Bond lengths of Ge–Se and Ge–Ge obtained by the EXAFS curve fittinganalysis for GeSe2, Ge3Se4and Ge4Se5at respective millingtimes.
Millingtime Shorter Ge–Se Longer Ge–Se Ge–Ge
h nm nm nm
0 0.235(1) — —
GeSe2
1/6 0.235(1) — —
1/2 0.236(1) — —
1 0.236(1) — —
0 0.235(1) 0.256(2) —
Ge3Se4
1/2 0.235(1) — 0.248(2)
1 0.236(1) — 0.248(2)
5 0.236(1) — 0.249(2)
0 0.236(1) 0.255(2) —
Ge4Se5
5 0.235(1) — 0.249(2)
20 0.235(1) — 0.249(2) 50 0.236(1) — 0.248(2)
Fig. 7 EXAFS distribution functions,FðRÞ, at Ge K–edge for GeSe2(a),
[image:5.595.305.549.94.270.2] [image:5.595.338.540.376.471.2]difference of the atomic configuration in the first coordina-tion shell. Assumingthat the structure of the quenched sample reflects the liquid state, it may be concluded that Ge– Se alloys at these compositions have a common short-range order in the amorphous and liquid states.
5. Conclusions
The structural change in the amorphizing process by the mechanical millingfor GeSe2, Ge3Se4 and Ge4Se5 samples
has been investigated through X-ray diffraction, Raman spectroscopy and EXAFS measurements. The results are summarized as follows;
(1) Amorphous Ge4Se5 was first prepared by the
mechan-ical milling.
(2) The short-range order in GeSe2 sample, which is a
single intermediate phase before milling, changes little after becomingamorphous, except for a slight mod-ification of the atomic connection of neighboring GeSe4=2tetrahedra.
(3) The structure of Ge3Se4and Ge4Se5samples, which are
eutectic mixtures of intermediate GeSe2 and GeSe
phases before the milling, changes during the milling; namely, the atomic configuration in intermediate GeSe phase is perfectly destroyed, and the isolated Ge atoms form new Ge-enriched structural units in the GeSe4=2
network matrix, such as Se3=2Ge–(GeSe2=2)n–GeSe3=2
and Ge(Geð4mÞ=4Sem=2).
(4) Ge4Se5 sample, which is close to the stoichiometric
composition of GeSe, has an ideally covalent structure in the amorphous state similarly to GeSe2 and Ge3Se4
samples.
(5) Interatomic distances of Ge–Se and Ge–Ge included in the first coordination shell in the amorphous state are determined to be 0.236 and 0.248 nm, respectively, which are composition-independent, and almost equal to the correspondingcovalent distances.
(6) The total coordination numbers of Ge and Se in the amorphous state are determined to be 4 and 2, respectively, which gives evidence for the covalent nature of amorphous GeSe2, Ge3Se4 and Ge4Se5.
(7) There is no difference of the atomic configuration in the first coordination shell between amorphous GeSe2 and
Ge3Se4 prepared by mechanical millingand rapid
quenching.
Acknowledgements
Authors would like to thank Mr. S. Takahashi for his help in the DSC measurement. This work has been partially supported by a Grant-in-Aid for Scientific Research No. 13650731 from the Ministry of Education, Culture, Sports, Science and Technology, Japan. This work was also performed under the inter-university cooperative research program of the Institute for Materials Research, Tohoku University.
REFERENCES
1) F. A. Shunk: Constitution of Binary Alloys, Second Supplement, (MacGraw-Hill, 1969) pp. 394.
2) V. G. Dittmer and H. Schaefer: Acta Crystallog. B32(1976) 2726– 2728.
3) A. Okazaki: J. Phys. Soc. Jpn.13(1958) 1151–1155.
4) P. Tronc, M. Bensoussan, A. Brenac and C. Sebenne: Phys. Rev. B8
(1973) 5947–5956.
5) See for example, J. C. Phillips: J. Non-Cryst. Solids44(1981) 17–30. Table 2 Structural parameters of Ge–Se and Ge–Ge correlations in the first
coordination shell for mechanically milled amorphous GeSe2, Ge3Se4and
Ge4Se5.
Ge–Se bonds Ge–Ge bonds
r l n r l n
nm nm nm nm
GeSe2 0.236(1) 0.0097(8) 3.90(3) — — —
Ge3Se4 0.237(1) 0.0100(7) 2.72(5) 0.248(1) 0.0109(6) 1.36(5)
Ge4Se5 0.236(1) 0.0100(6) 2.52(4) 0.248(1) 0.0111(7) 1.50(3)
Fig. 9 EXAFS distribution functions at Ge K-edge in both mechanical milling(MM) and rapid quenching(RQ) samples for GeSe2and Ge3Se4.
[image:6.595.51.289.73.261.2] [image:6.595.47.291.429.666.2]6) R. W. Fawcett, C. N. J. Wagner and G. S. Cargill III: J. Non-Cryst. Solids8/10(1972) 369–375.
7) K. Inoue, K. Kawamoto and K. Murase: J. Non-Cryst. Solids95&96
(1987) 517–524.
8) P. H. Fuoss, P. Eisenberger, W. K. Warburton and A. Bienenstock: Phys. Rev. Lett.46(1981) 1537–1540.
9) S. J. Gurman, J. Choi and E. A. Davis: J. Non-Cryst. Solids227–230
(1998) 833–836.
10) O. Uemura, N. Hayasaka, Y. Kameda and T. Usuki: phys. stat. sol. (b) 200 (1997) 385–393.
11) K. Abe, O. Uemura, T. Usuki, Y. Kameda and M. Sakurai: J.
Non-Cryst. Solids232–234(1998) 682–687.
12) G. Lucovsky, R. J. Nemanich, S. A. Solin and R. S. Keezer: Solid State Commun.17(1975) 1567–1572.
13) O. Matsuda, K. Inoue, T. Nakaue and K. Murase: J. Non-Cryst. Solids
150(1992) 202–206.
14) T. Okabe, K. Nakamura and M. Nakagawa: J. Non-Cryst. Solids117– 118(1990) 215–218.
15) P. Tronc, M. Bensoussan, A. Brenac and G. Errandona: J. Physique38
(1977) 1493–1498.